Which of the following is represented by 'Lorenz Curve'?
A
Employment
B
Inflation
C
Deflation
D
Income distribution
Video Solution
Text Solution
The correct Answer is:D
In economics, the Lorenz curve is a graphical representation of the distribution of income or of wealth. The graphplots percentiles of the population according to income or wealth on the horizontal axis. It was developed by Max O. Lorenz in 1905 for representing inequality of the wealth distribution.
|
Updated on:21/07/2023
Similar Questions
Knowledge Check
- Question 1 - Select One
Which of the following represents market demand curve ?
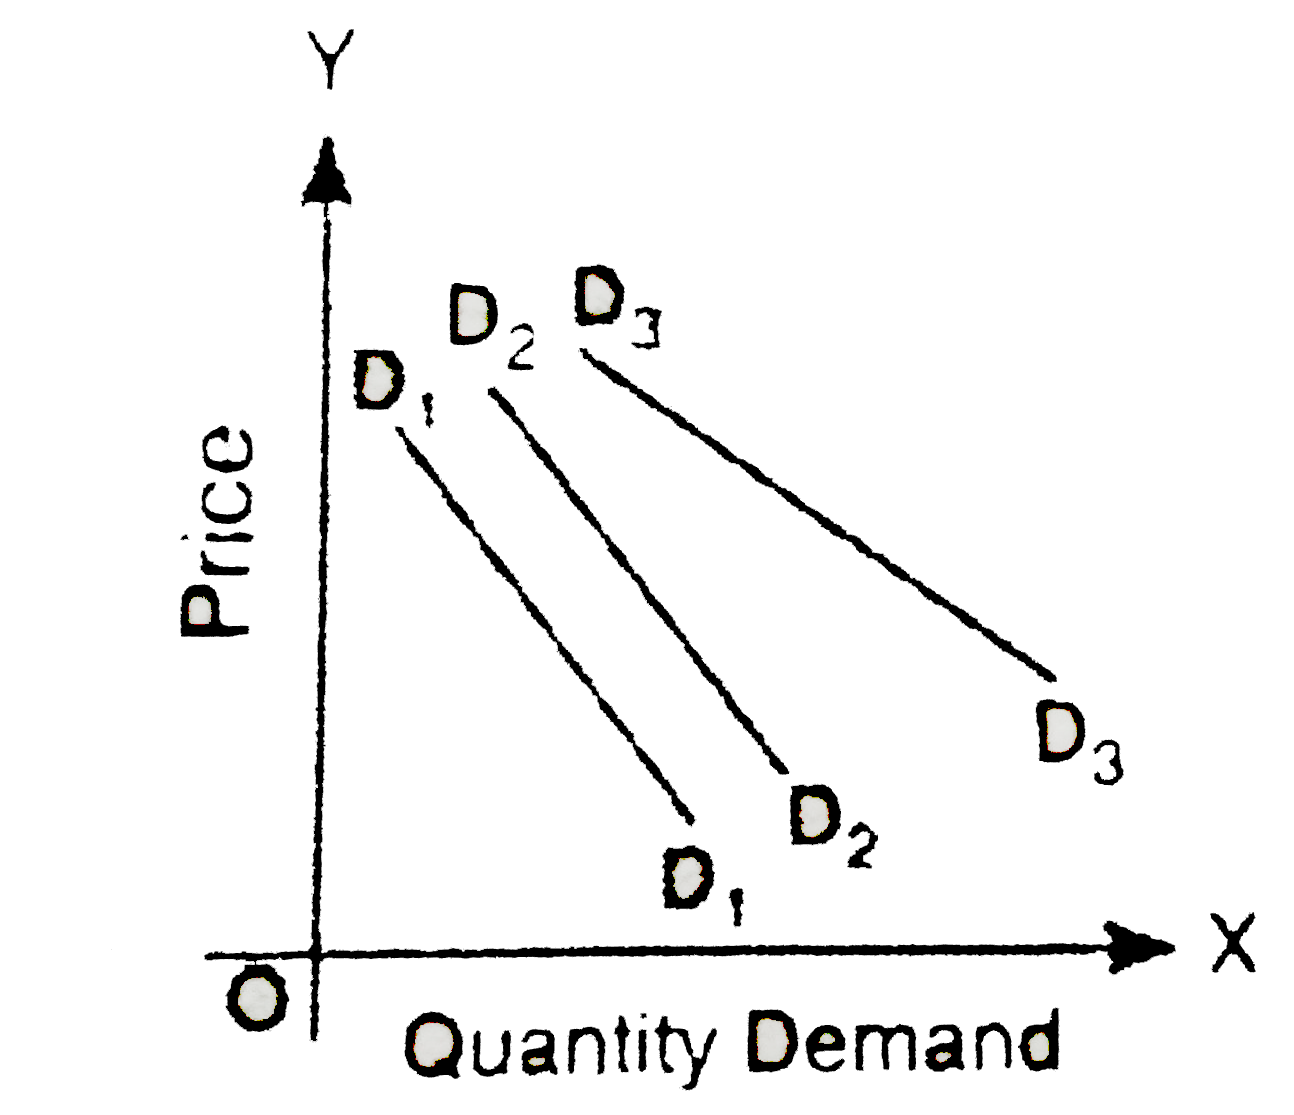 AD1D1BD3D3CD2D2DNone of the above
 - Question 2 - Select One
Which of the following curves represents a zero order reaction ? [(a−x) =reactant concn.]
A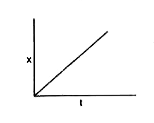 B
B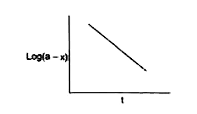 C
C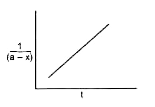 D
D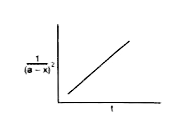
- Question 3 - Select One
The rate of decay (R) of nuclei in a radioactive sample is plotted against time (t). Which of the following best represents the resulting curve ?
A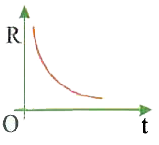 B
B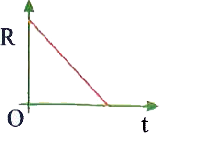 C
C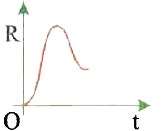 D
D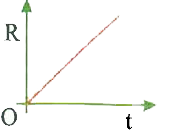
Which of the following curves represent the Henry's law
View SolutionWhich of the following curves represents a first order reaction.
View SolutionWhich of the following curves represents a third order reaction ?
View SolutionWhich of the following curve represent zero order reaction of A→ products ?
View SolutionWhich of the following curve represent zero order reaction of A→ products ?
View Solution

