1960 से 2004 तक की अवधि में अनाज के उत्पादन में कितने गुना वृद्धि हुई है?
चार गुना
Topper's Solved these Questions
- खाद्य संसाधनों से सुधारBOOK - ALOK BHARTI PUBLICATIONCHAPTER - खाद्य संसाधनों से सुधारEXERCISE - मॉडल प्रश्न (लघु उत्तरीय प्रश्न-I)
9 Videos
- खाद्य संसाधनों से सुधारBOOK - ALOK BHARTI PUBLICATIONCHAPTER - खाद्य संसाधनों से सुधारEXERCISE - मॉडल प्रश्न (लघु उत्तरीय प्रश्न-II)
7 Videos
- खाद्य संसाधनों से सुधारBOOK - ALOK BHARTI PUBLICATIONCHAPTER - खाद्य संसाधनों से सुधारEXERCISE - मानक NCERT प्रश्न एवं उनके उत्तर ((B) अभ्यास प्रश्न )
9 Videos
- ऊतकBOOK - ALOK BHARTI PUBLICATIONCHAPTER - ऊतकEXERCISE - मॉडल प्रश्न (बहुविकल्पीय प्रश्न)
9 Videos
- जीवन की मौलिक इकाईBOOK - ALOK BHARTI PUBLICATIONCHAPTER - जीवन की मौलिक इकाईEXERCISE - मॉडल प्रश्न (बहुविकल्पीय प्रश्न)
10 Videos
Similar Questions
भूख की समस्या को दूर करने के लिए हमें क्या करना चाहिए?
View Solutionकार्बोहाइड्रेट, प्रोटीन और वसा प्रदान करने वाले अनाजों के नाम लिखें।
View Solutionफसल उत्पादन की एक विधि का वर्णन कीजिए जिससे उच्च उत्पादन को सुनिश्चित किया जा सके।
View Solutionकिस प्रकार के ऊतकों की क्रियाशीलता के कारण पौधों में वार्षिक वलय बनते हैं?
View Solutionतारककाय किस में पाया जाता है
View SolutionA number is first increased by 40% and then decreased by 25%, again increased by 15% and then decreased by 20%, What is the net increase decrease per cent in the number ?
एक संख्या में पहले 40% की वृद्धि हुई है और फिर 25% की कमी हुई, फिर से 15% की वृद्धि हुई और फिर 20% की कमी हुई, संख्या में कुल वृद्धि या कमी के प्रतिशत को ज्ञात करे।
View SolutionThe bar chart shows the annual food grain production (in million tonnes) for years 2012-2017. For how many years is the production less than the average production during the given period? यह दंड आरेख वर्ष 2012-2017 की अवधि में वार्षिक खाद्यान्न उत्पादन (मिलियन टन में ) को दर्शाता है | कितने वर्ष उत्पादन इस अवधि के औसत उत्पादन से कम है ?
View SolutionThe bar graph given below shows the wheat production (in tonnes) of a large farm during the year 2011-2018. In how many years was wheat production higher than the average production of the period? नीचे दिए गए दंड आरेख में वर्ष 2011-2018 के दौरान किसी बड़े फार्म के गेहूं उत्पादन (टन में) को दर्शाया गया है | अवधि के औसत उत्पादन की तुलना में दिए गए कितने वर्षो में गेहूं उत्पादन अधिक था ?
View SolutionThe given table represents the production of different types of motorcycles (in thousands) over a period of six years. Study the table carefully and answer the questions that follows: दी गयी तालिका छः वर्षों की अवधि के दौरान अलग-अलग प्रकार की मोटर साइकिलों के उत्पादन ( हज़ार में ) को दर्शाती है | इस तालिका का ध्यानपूर्वक अध्ययन करें तथा फिर पूछे गए प्रश्नों का उत्तर दीजिए | What is the percentage increase in the total production of all types of motorcycles from 2014to 2018? 2014 से 2018 तक सभी प्रकार की मोटरसाइकिल के कुल उत्पादन में कितने प्रतिशत की वृद्धि हुई है ?
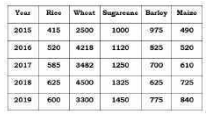
View SolutionIn the following table, the production of various crops (in tonnes) is given from 2015 to 2019. Study the table and answer the question that follows:
दी गयी तालिका में, 2015 से 2019 तक विभिन्न फसलों का उत्पादन (टन में ) दिया गया है | इस तालिका का अध्ययन करें तथा फिर पूछे गए प्रश्न का उत्तर दीजिए | The percentage growth of maize in the year 2019 over the year 2015 is: (correct to one decimal place)
वर्ष 2019 में वर्ष 2015 की तुलना में मक्का के उत्पादन में कितने प्रतिशत की वृद्धि हुई है ? ( दशमलव के एक स्थान तक )
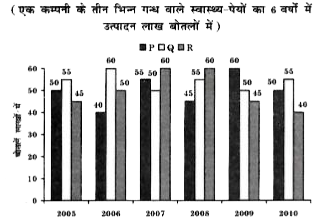
View SolutionIn which of the following years the percentage of rise or fall in production from the previous year is maximum for the flavour of Q ?
निम्न में से किस वर्ष में, पिछले वर्ष की तुलना में गन्ध Q के उत्पादन में वृद्धि या हास अधिकतम रहा है?

View SolutionStudy the chart carefully and answer the questions. The chart shows production of an item (in tones) during certain years. The production decreased from 2004-05 to 2005 - 06 by निम्न आरेख का ध्यानपूर्वक अध्ययन कर दिए गए प्रश्नों के उत्तर दें: आरेख किसी वर्ष के दौरान एक मद का उत्पादन (टनों में) दर्शाता है। वर्ष 2004-05 से 2005-06 में उत्पादन में कितनी कमी हुई ?
View SolutionRise in the price of a commodity means किसी वस्तु की कीमत में वृद्धि से क्या अभिप्रेत है?
View SolutionThe following figure shows the number of students (in thousands) admitted and passed out per your in a college during years 2000 to 2004, study the figure and answer the questions : : निम्नलिखित आकृति में किसी कॉलेज में वर्ष 2000 से वर्ष 2004 तक प्रति वर्ष भर्ती हुए और उर्तीण हुए छात्रों की संख्या (हजार में) दर्शायी गई है। आकृति का अध्ययन कर प्रश्नों के उत्तर दीजिए : The percent increase in the number of students admitted in the year 2003 over that in 2001 is वर्ष 2001 की तुलना में वर्ष 2003 में भर्ती हुए छात्रों की संख्या में हुई प्रतिशत वृद्धि कितनी है ?
View Solutionएक स्थिर आयतन ऊष्मातापी में अणुभार 28 की एक गैस के 3.5 gको 298.0K पर ऑक्सीजन के अधिवाकय में जलाया गया था दहन प्रक्रम के कारण उष्मामापी के टप्प 298.0K से 298.45 K तक की वृद्धि पायी गयी दिया हुआ है की उष्मामापी की उष्मा धारिता 2.5 kg K^-1 है गैस के दहन की अन्थेलपी का संख्यात्मक मान में है
View Solutionताप में प्रत्येक 10^@C की वृद्धि पर अभिक्रिया की दर दोगुनी हो जाती है। 10^@C से 100^@C तक ताप में वृद्धि के परिणामस्वरूप दर में वृद्धि मूल दर की कितनी गुना है?
View Solution
