(Questions 15-19): The pie-chart shown below gives the distribution of land in a village under various food crops. Study the pie-chart carefully and answer the questions that follow: Distribution of areas (in acres) under various food crops (FIGURE) Which combination of three crops contribute to 50% of the total area under the food crops? (a) Wheat, Barley and Jowar (b) Rice, Wheat and Jowar (c) Rice, What and Barley (d) Bajra, Maize and Rice
Step by step video & image solution for (Questions 15-19): The pie-chart shown below gives the distribution of land in a village under various food crops. Study the pie-chart carefully and answer the questions that follow: Distribution of areas (in acres) under various food crops (FIGURE) Which combination of three crops contribute to 50% of the total area under the food crops? (a) Wheat, Barley and Jowar (b) Rice, Wheat and Jowar (c) Rice, What and Barley (d) Bajra, Maize and Rice by Maths experts to help you in doubts & scoring excellent marks in Class 14 exams.
Updated on:21/07/2023Topper's Solved these Questions
Similar Questions
Reading of pie chart for the angle wise distribution of different crops
View SolutionDirections : The pie-chart given below shows expenditure incurred by a family on various items and their savings. Study the chart and answer the questions based on the pie-chart
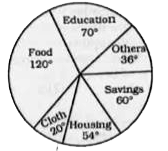
The ratio of expenditure on food to saving is :
View Solution
Knowledge Check
The given pie chart shows the percentage distribution of 450 employees in an organisation. Study the pie chart and answer the question that follows.
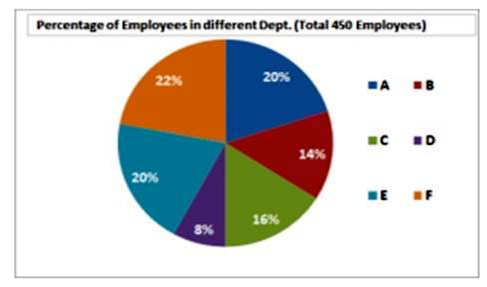
What is the number of employees working in departmetn B?A90B72C36D63Directions : The Paichart shows Distribution of Spacial Childern Population the year 1994-96. Study the pie-chart and answer the following questions
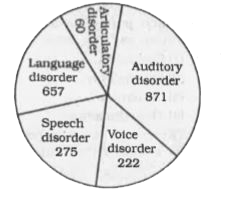
Find the ratio between atrticulatory diorder and speech disorder cases.A43.7%B42.7%C41.7%D40.7%Study the table graph carefully to answer the questions that follows
Production of main crops in India (in million tonnes)
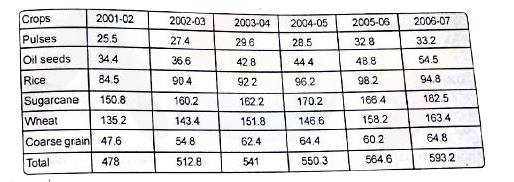
Production of rice was what percentage of the total crops produced in the year 2001-02 ?A18.5B19.2C21.7D17.6
Following is the pie-chart showing the spendings of a family on various items in a particular year
Study the pie chart and answer questions.
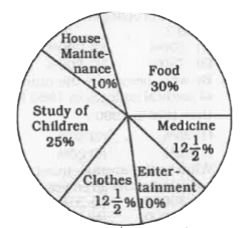
The ratio of the total amount spent for food and medicine is
View SolutionThe pie chart given below shows the spending of a family on various heads during a month. Study the graph and answer the following questions.
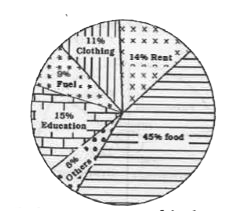
What is the ratio of the expenses on Education to the expenses on Food?
View SolutionThe pie chart given here shows the spendings of a country on various sports during a particular year. Study the chart carefully and answer the questions given below:
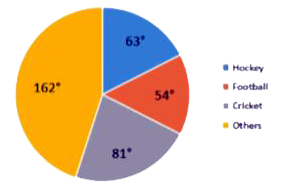
What percent of the total spendings is spent on others?
View SolutionThe pie chart given below shows the spendings of a family on various heads during a month. Study the graph and answer the questions
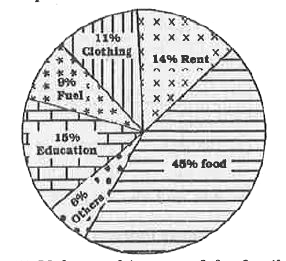
What is the ratio of the expenses on Education to the expenses on Food?
View SolutionWhich of the following is a non-food crop?
View Solution
