In how many of the given years, were the exports from Company Z more than the average annual exports over the given years? (a) 2 (b) 3 (c) 4 (d) 5 (e) 6
To solve the problem step by step, we need to determine how many years the exports from Company Z were more than the average annual exports over the given years.
Step 1: Calculate the total exports over the years
First, we need to sum up the exports from Company Z for each year. Let's assume the exports for the 7 years are as follows:
- Year 1: Rs 60 crores
- Year 2: Rs 90 crores
- Year 3: Rs 120 crores
- Year 4: Rs 90 crores
- Year 5: Rs 60 crores
- Year 6: Rs 80 crores
- Year 7: Rs 100 crores
Now, we will calculate the total exports:
Total Exports=60+90+120+90+60+80+100=600 crores
Step 2: Calculate the average annual exports
Next, we need to find the average annual exports over the 7 years. The average is calculated by dividing the total exports by the number of years:
Average Exports=Total ExportsNumber of Years=6007≈85.71 crores
Step 3: Compare each year's exports to the average
Now, we will compare the exports of each year with the average exports (85.71 crores):
- Year 1: Rs 60 crores (less than 85.71)
- Year 2: Rs 90 crores (more than 85.71)
- Year 3: Rs 120 crores (more than 85.71)
- Year 4: Rs 90 crores (more than 85.71)
- Year 5: Rs 60 crores (less than 85.71)
- Year 6: Rs 80 crores (less than 85.71)
- Year 7: Rs 100 crores (more than 85.71)
Step 4: Count the number of years with exports greater than the average
From the comparison, we find that the years where exports were greater than the average (85.71 crores) are:
- Year 2 (90 crores)
- Year 3 (120 crores)
- Year 4 (90 crores)
- Year 7 (100 crores)
Thus, there are a total of 4 years where the exports were more than the average.
Final Answer
The answer to the question is (c) 4.
---
First, we need to sum up the exports from Company Z for each year. Let's assume the exports for the 7 years are as follows:
- Year 2: Rs 90 crores
- Year 3: Rs 120 crores
- Year 4: Rs 90 crores
- Year 5: Rs 60 crores
- Year 6: Rs 80 crores
- Year 7: Rs 100 crores
Next, we need to find the average annual exports over the 7 years. The average is calculated by dividing the total exports by the number of years:
Now, we will compare the exports of each year with the average exports (85.71 crores):
- Year 2: Rs 90 crores (more than 85.71)
- Year 3: Rs 120 crores (more than 85.71)
- Year 4: Rs 90 crores (more than 85.71)
- Year 5: Rs 60 crores (less than 85.71)
- Year 6: Rs 80 crores (less than 85.71)
- Year 7: Rs 100 crores (more than 85.71)
From the comparison, we find that the years where exports were greater than the average (85.71 crores) are:
- Year 3 (120 crores)
- Year 4 (90 crores)
- Year 7 (100 crores)
The answer to the question is (c) 4.
Topper's Solved these Questions
Similar Questions
Knowledge Check
- Question 1 - Select One
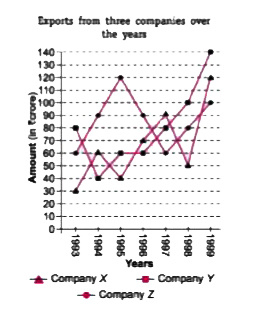
In How any of the given years. Were the exports from Company Z more than the average annual exports over the given years ?A2B3C4D5 - Question 2 - Select One
In how many years were the imports more than 80% of the average exports of the country during the given 5 years.
A4B2C1D3 - Question 3 - Select One
Study the following graph and answer questions
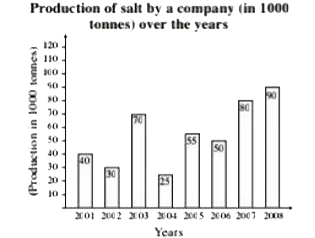
In how many of the given years was the production of salt more than the average production of the given years?A1B2C3D4
Study the graph and answer the question
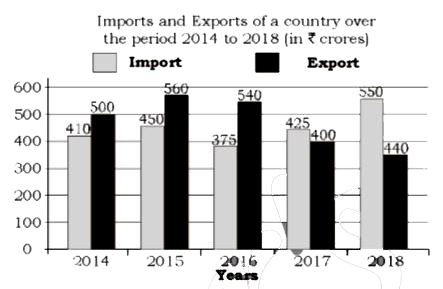
In how many years were the exports of the country more than the average imports during the given yearView Solution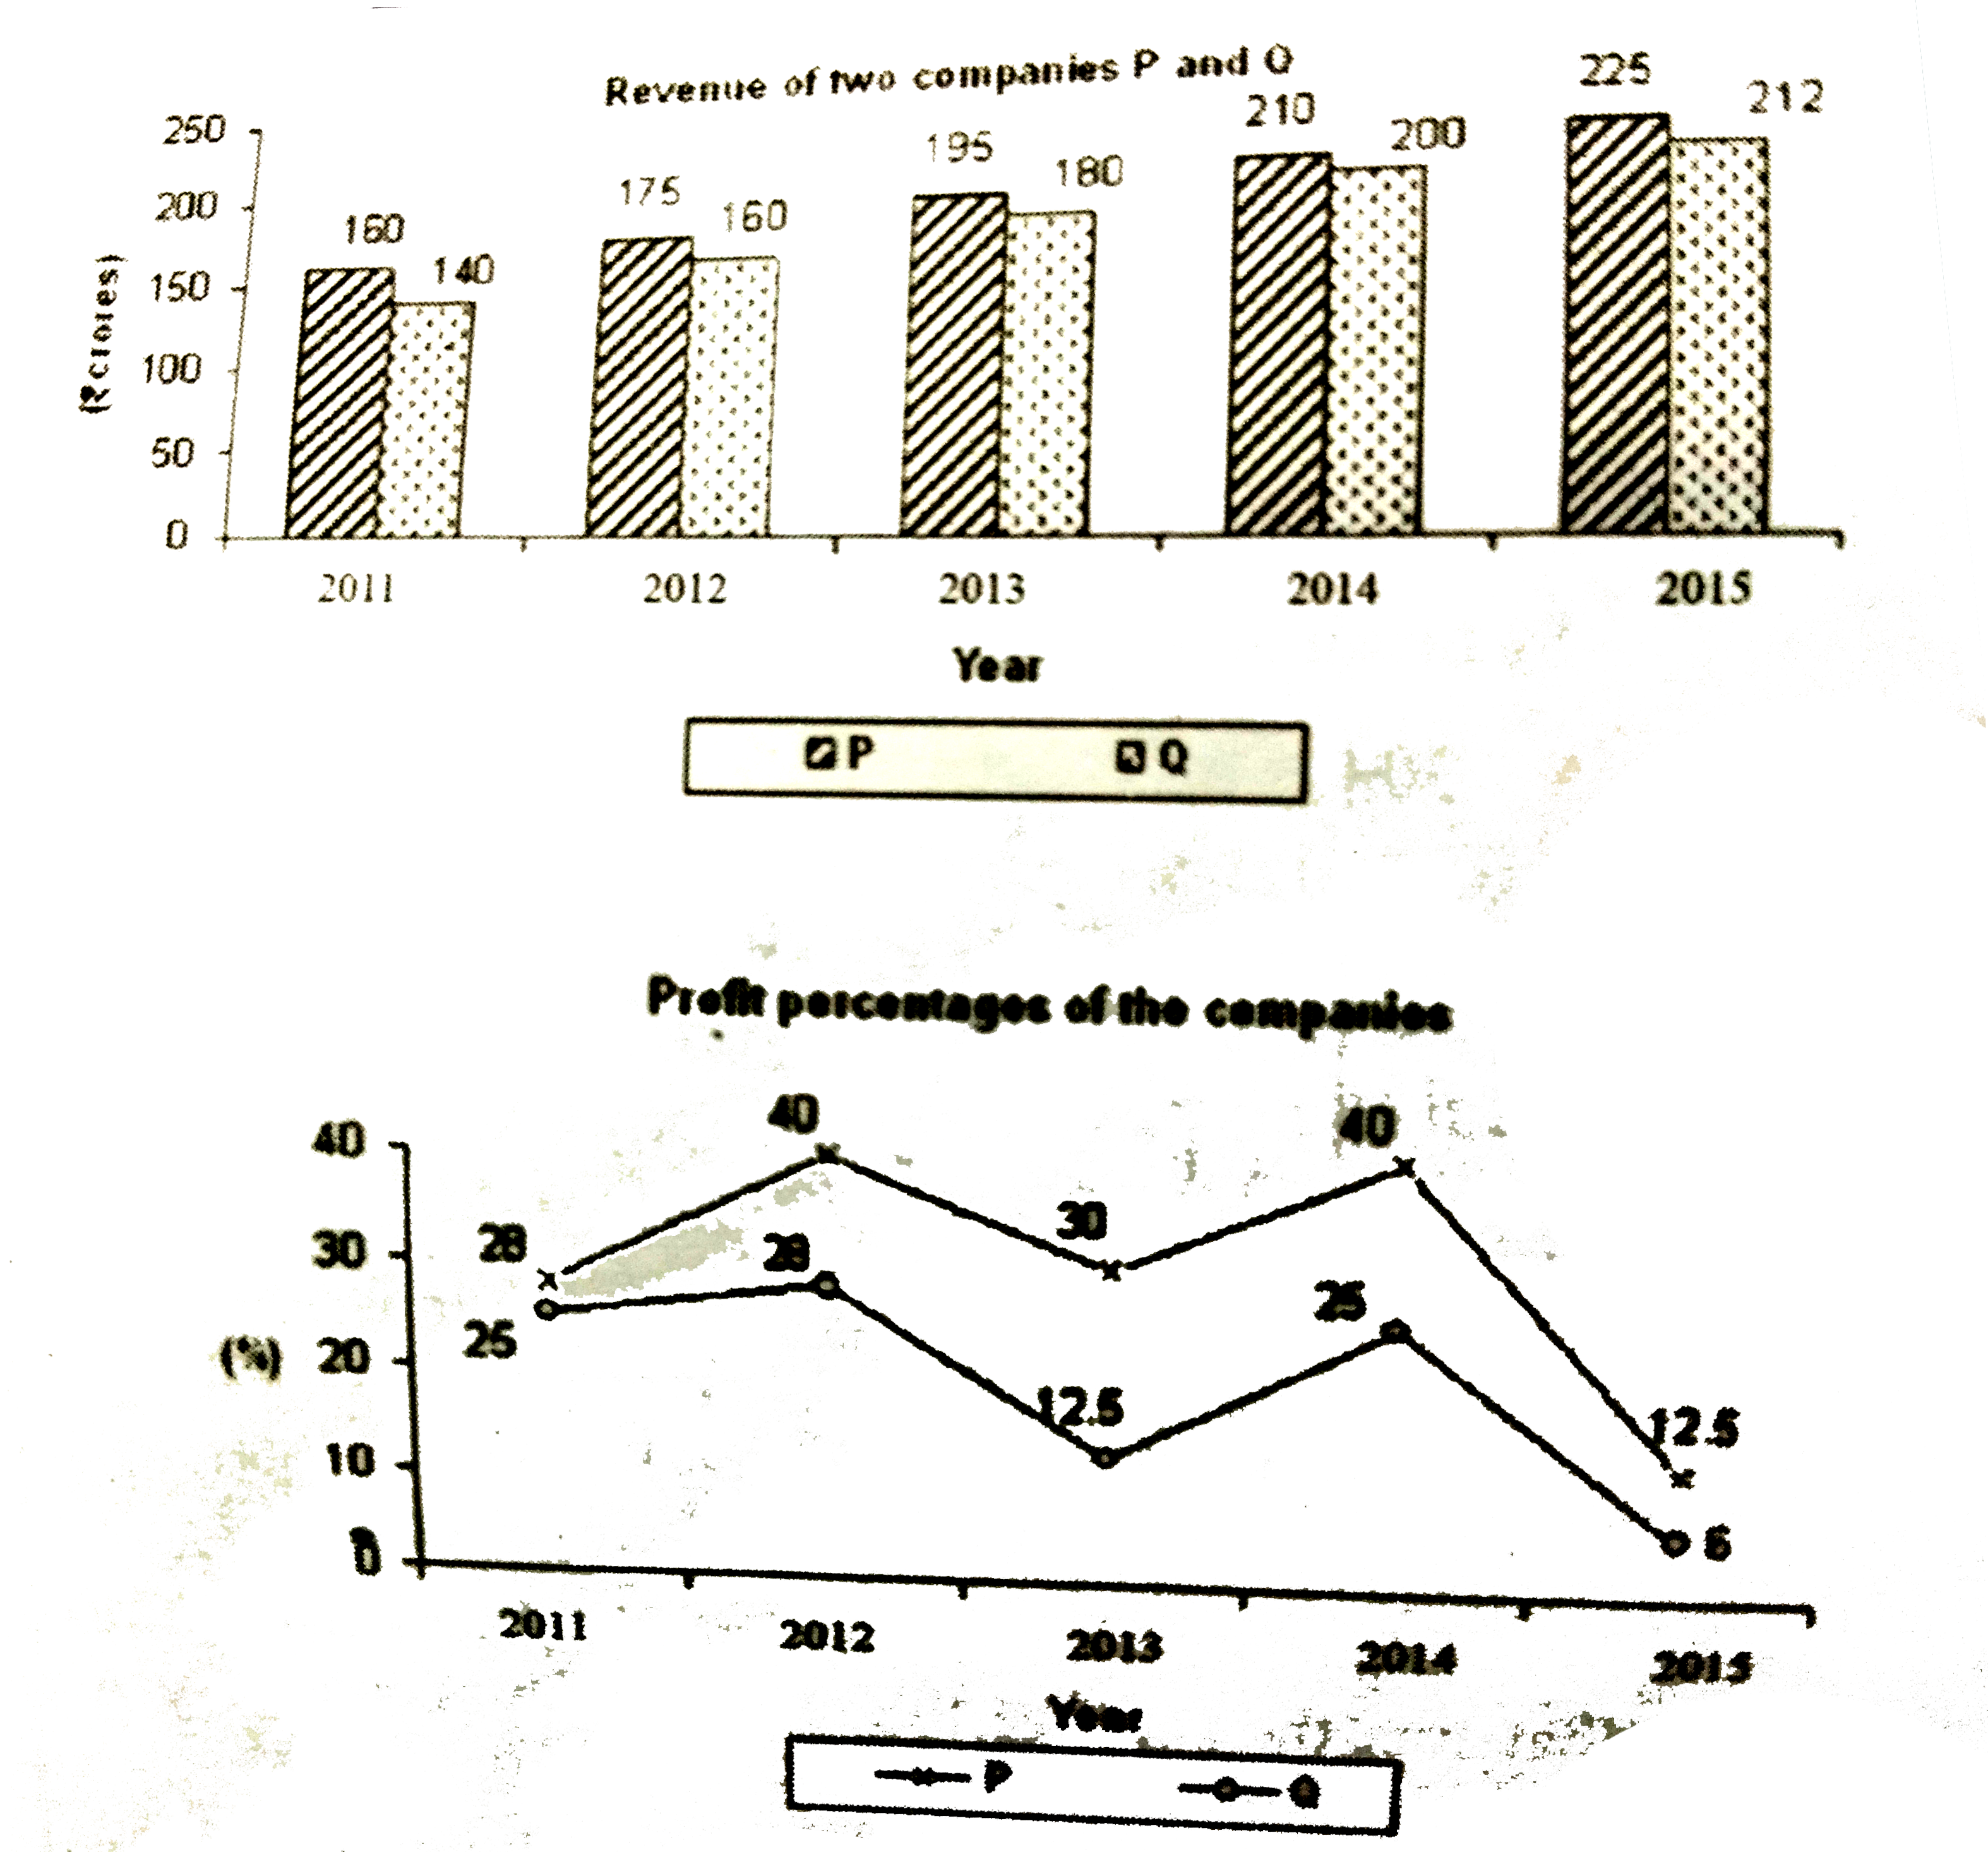
In how many given years was the profit of the company P{ more than the profit of the company Q at least Rs. 15 crore ?View SolutionIn how many years was the export above average for the given period? (a) 2 (b) 4 (c) 5 (d) 3
View SolutionDirections (Questions 24-28): Study the following graphs and answer the questions given below which are based on these graphs (FIGURE) Average annual exports during the given period for Company Y is approximately what percent of the average annual exports for Company Z ? (a) 87.12% (b) 89.64% (c) 91.21% (d) 93.33% (e) 95.15%
View SolutionThe given bar graph shows the imports and exports (in Rs crores) of steel by a country from 2013 to 2017.
दिया गया दंड आरेख एक देश के द्वारा 2013 से 2017 तक इस्पात के आयात और निर्यात ( करोड़ रुपये में) को दर्शाता है |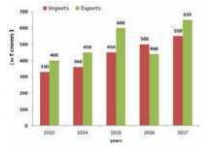 In how many years were the imports more than 80% of the average exports (per year) of the
country during the given 5 years?
दिए गए 5 वर्षों के दौरान कितने वर्ष देश के आयात देश के औसत निर्यात ( प्रति वर्ष ) के 80% से अधिक रहे हैं?View Solution


