Directions (Questions 24-28): Study the following graphs and answer the questions given below which are based on these graphs (FIGURE) Average annual exports during the given period for Company Y is approximately what percent of the average annual exports for Company Z ? (a) 87.12% (b) 89.64% (c) 91.21% (d) 93.33% (e) 95.15%
Step by step video & image solution for Directions (Questions 24-28): Study the following graphs and answer the questions given below which are based on these graphs (FIGURE) Average annual exports during the given period for Company Y is approximately what percent of the average annual exports for Company Z ? (a) 87.12% (b) 89.64% (c) 91.21% (d) 93.33% (e) 95.15% by Maths experts to help you in doubts & scoring excellent marks in Class 14 exams.
Updated on:21/07/2023Topper's Solved these Questions
Similar Questions
Study the following graph and answer the questions given below it.
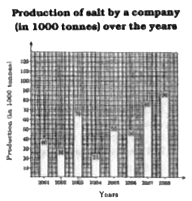
What was the percentage decline in the product of salt from 2003 to 2004 ?
View SolutionStudy the following graph and answer the questions given below it.
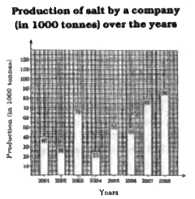
What was the percentage increase in production of salt in 2008 compared to that of 2001 ?
View Solution
Knowledge Check
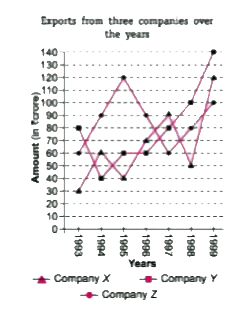
Average annual exports during the given period for company V is approximately what per cent of the av- erage annual exports for company Z?A0.8712B0.8964C0.9121D93. 33 %Study the following graph carefully and answer the questions given below it -----
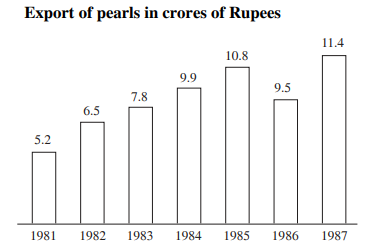
In how many years was the export above the average for the given period ?A2B3C4D5Study the following graph and answer these questions given below:-
Tea in India (in million kg.)
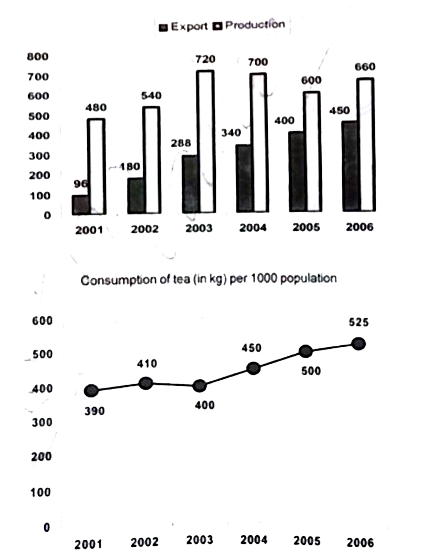
What was approximately the average production during the period?A650 millionB625 millionC600 millionD616 million
Read the following graph carefully and answer the questions given below.
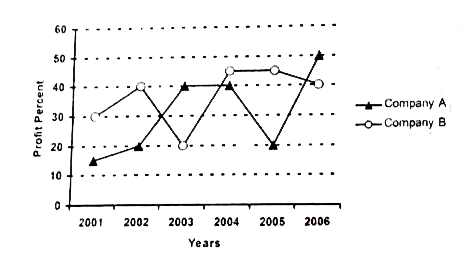
In which year the average of the profit percent of the both companies was the maximum ?
View SolutionStudy the following graph carefully and answer the questions given below it -----
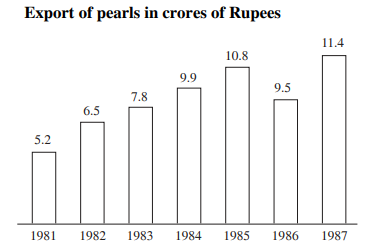
What was the percentage increase in export from 1986 to 1987 ?
View SolutionRead the following graph carefully and answer the questions given below.
Production of sugar in three different factories over years (in thousand tonnes)
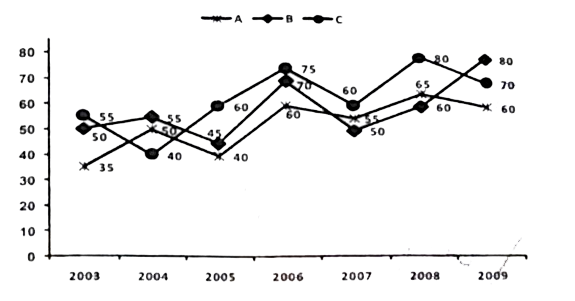
The average production of company A is approximately what percent of average production of company C ?
View SolutionStudy the following graph carefully and answer the questions given below it -----
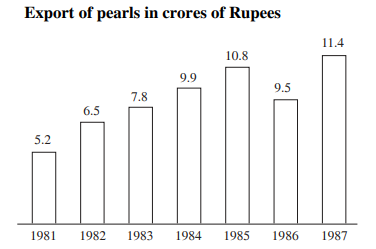
In which year was the export equal to the average export of the preceding and the following year ?
View SolutionStudy the following graph carefully and answer the question given below-----
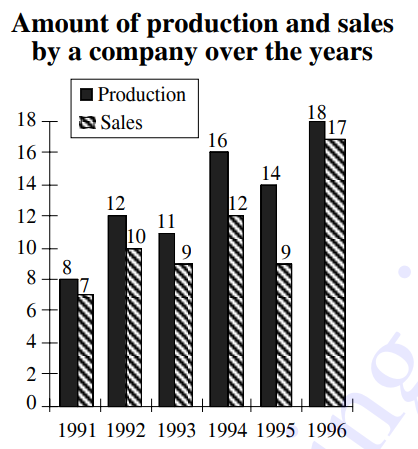
What was the percentage drop in sales from 1992 to 1993 ?
View Solution
