which of the following graph represents the expression f(x)=ax2+bx+c (a≠0) when a>0,b<0 $ c<0 ?
Step by step video & image solution for which of the following graph represents the expression f(x) = ax^2 + bx + c (a!=0) when a>0,b<0 $ c<0 ? by Maths experts to help you in doubts & scoring excellent marks in Class 11 exams.
Updated on:21/07/2023Similar Questions
Knowledge Check
For which of the following graphs of the quadratic expression f(x)=ax2+bx+c, the product of abc is negative
A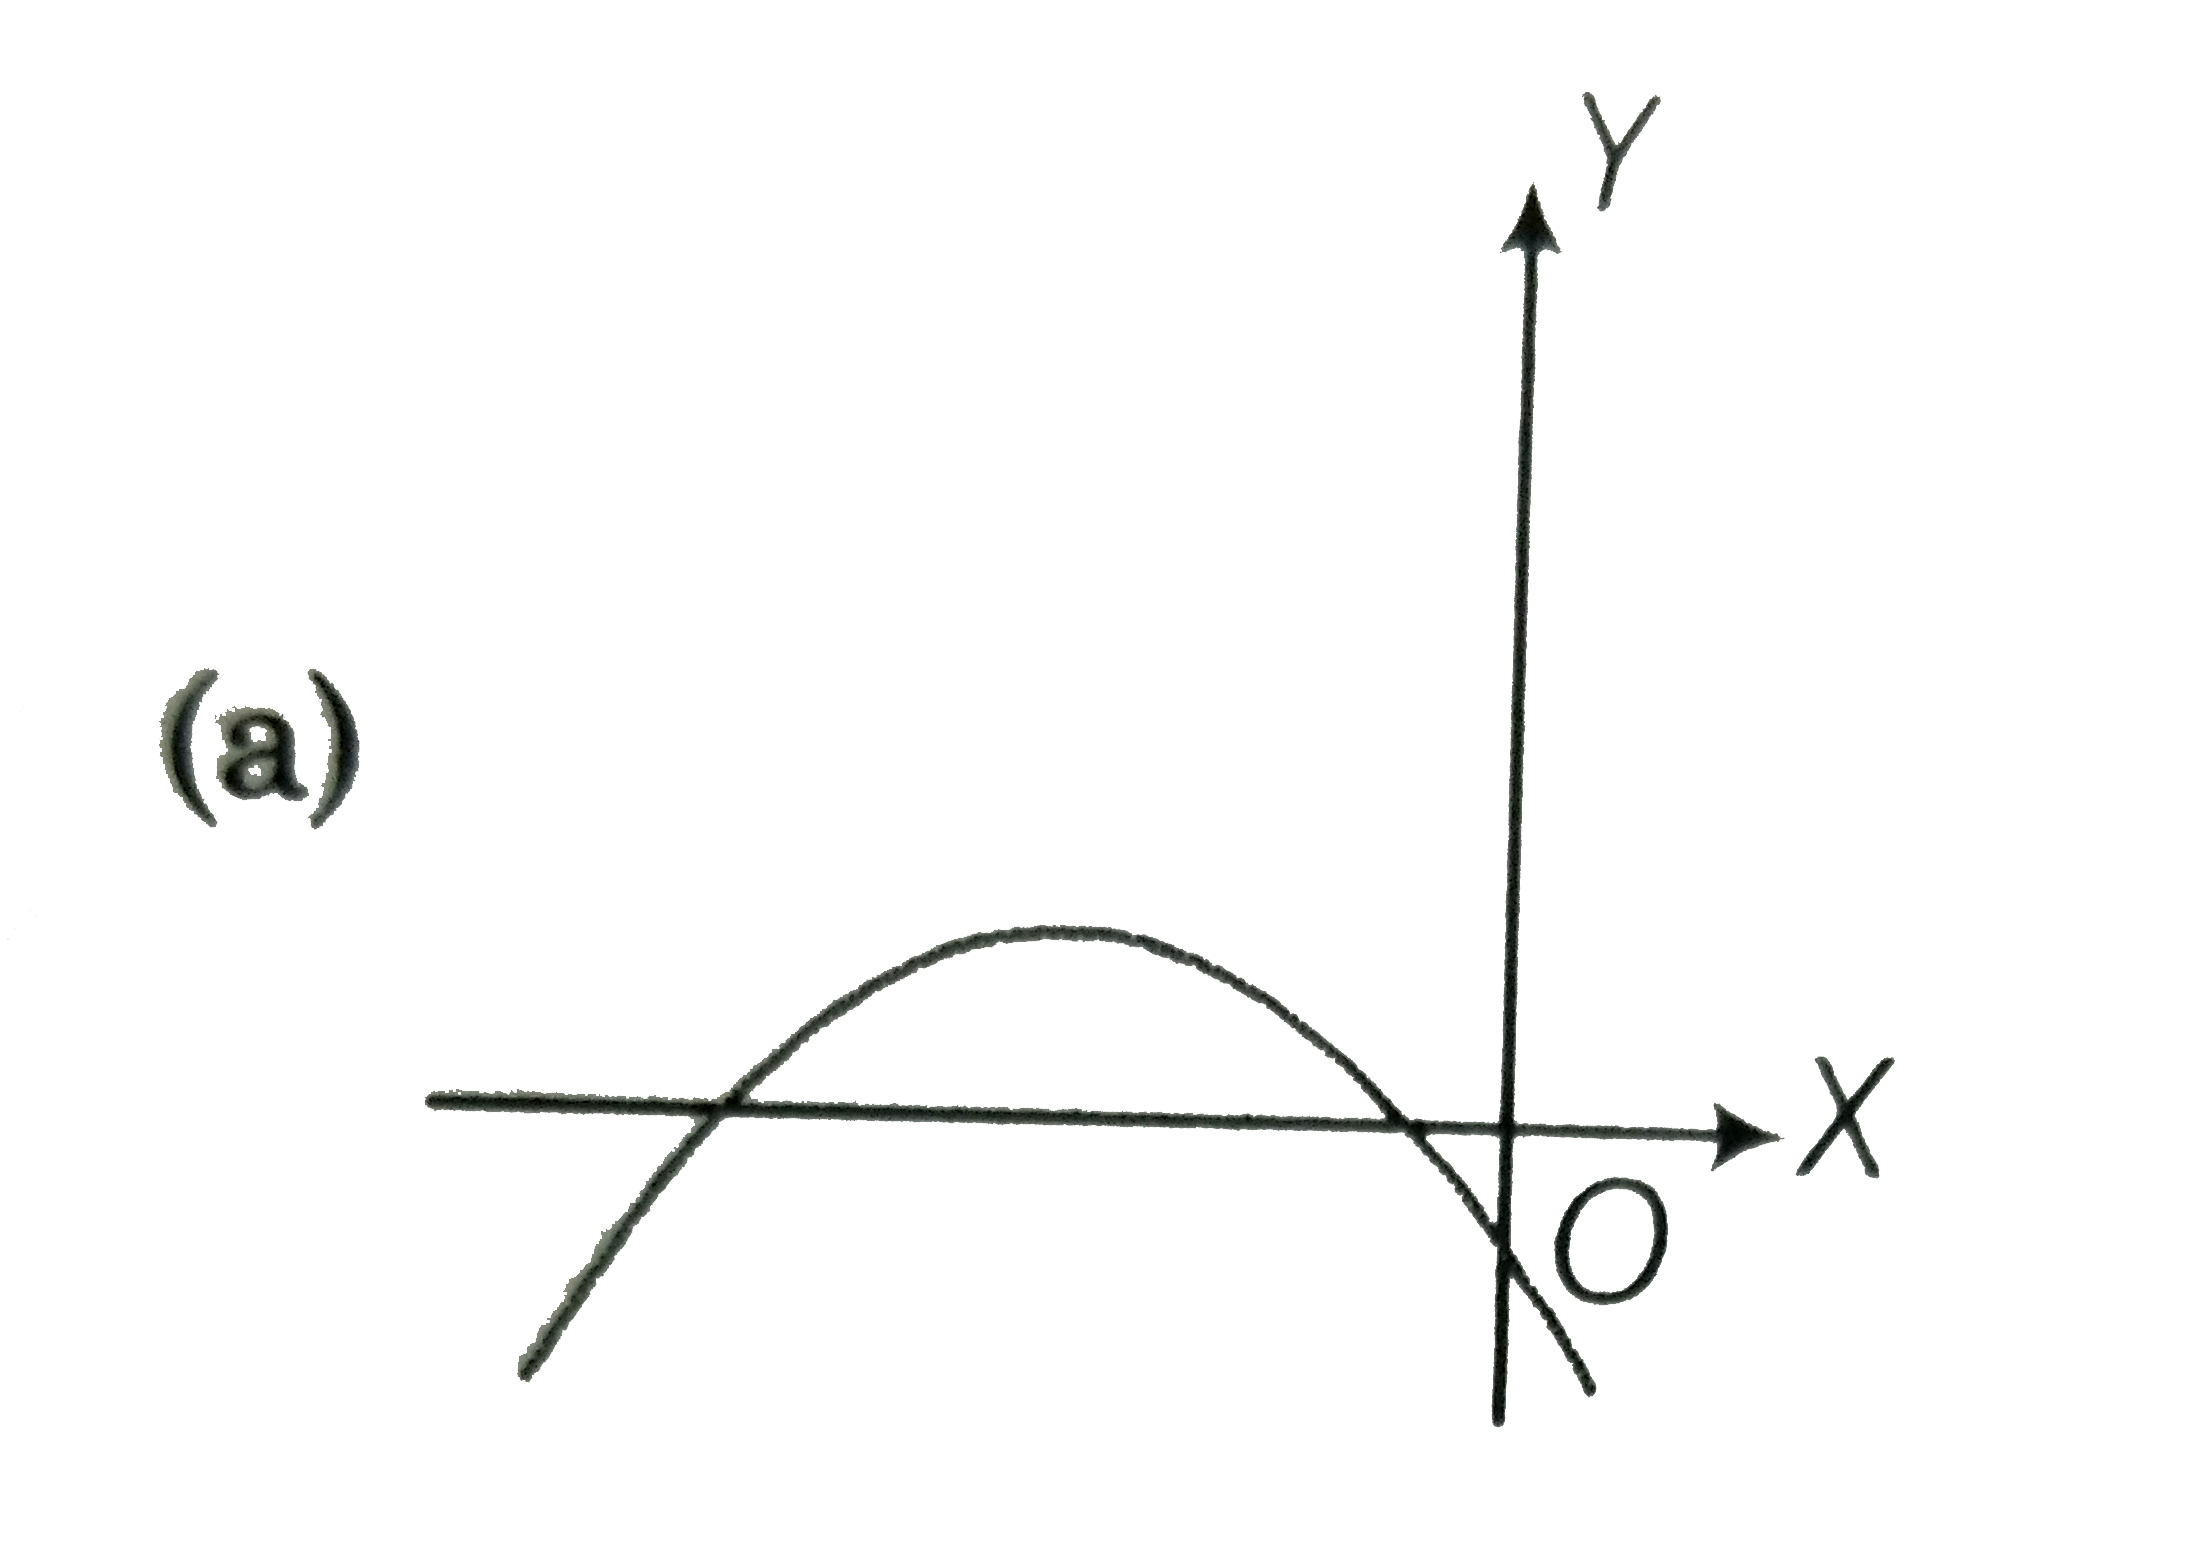 B
B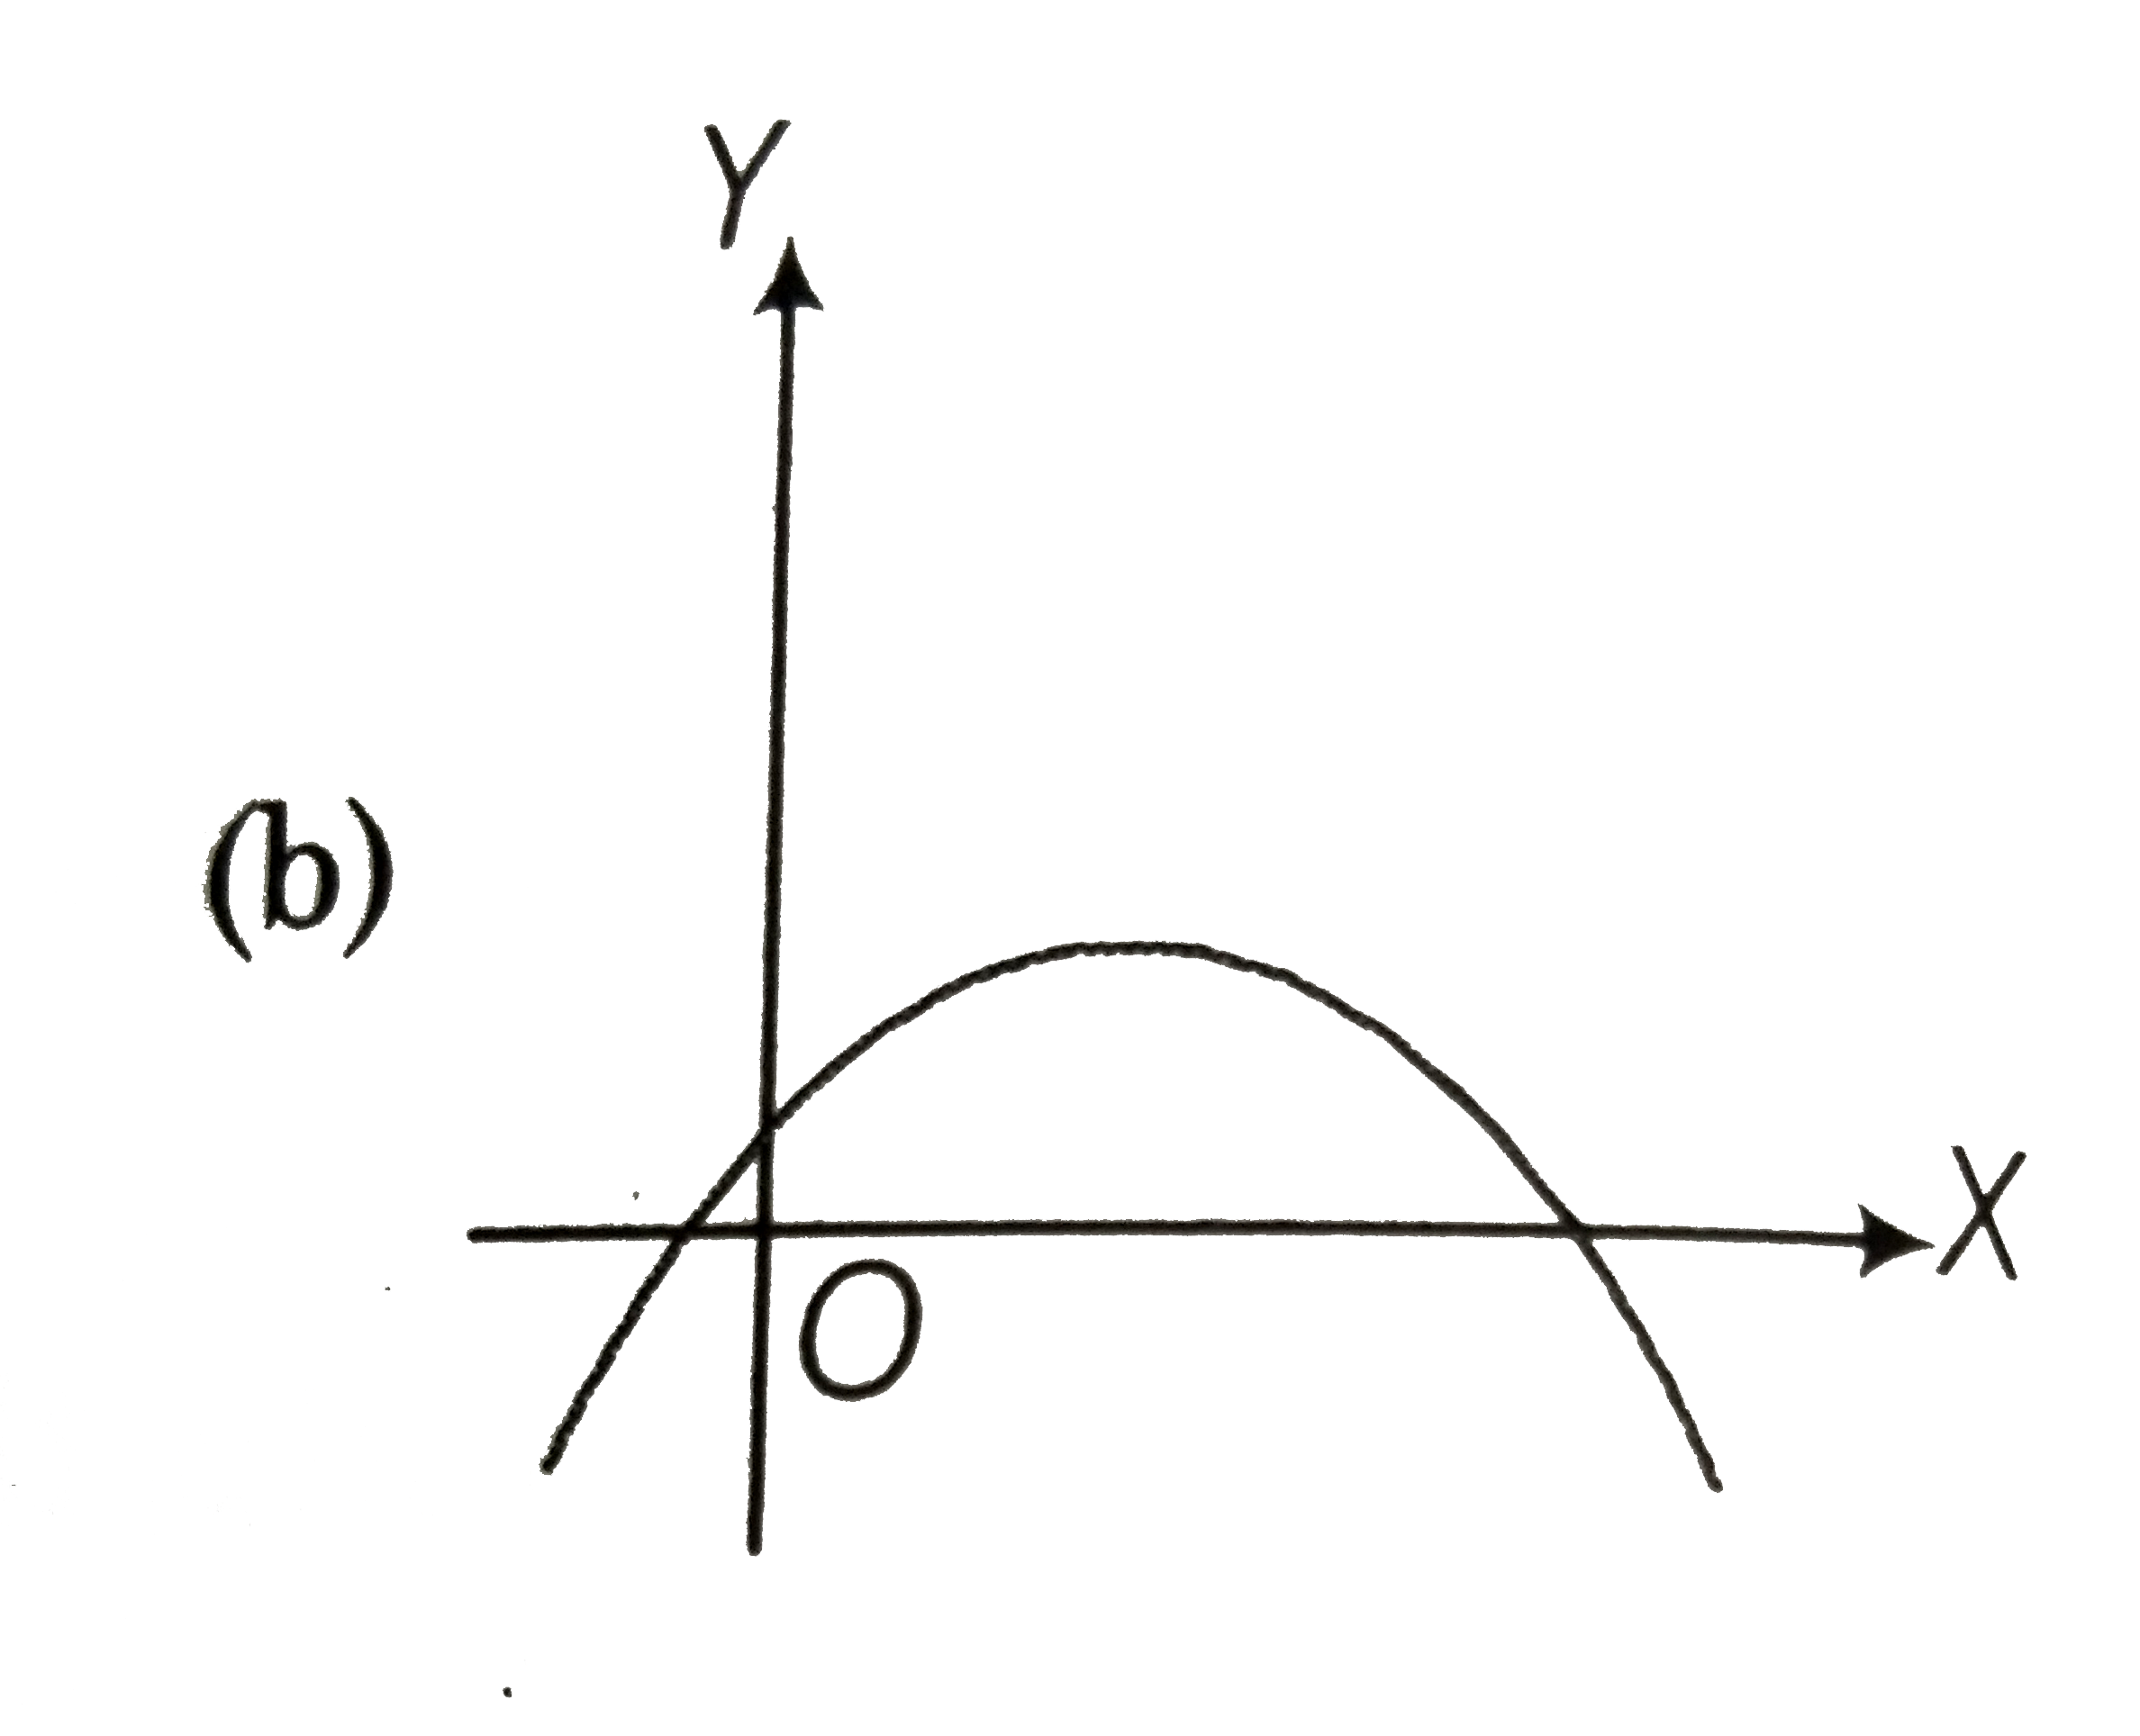 C
C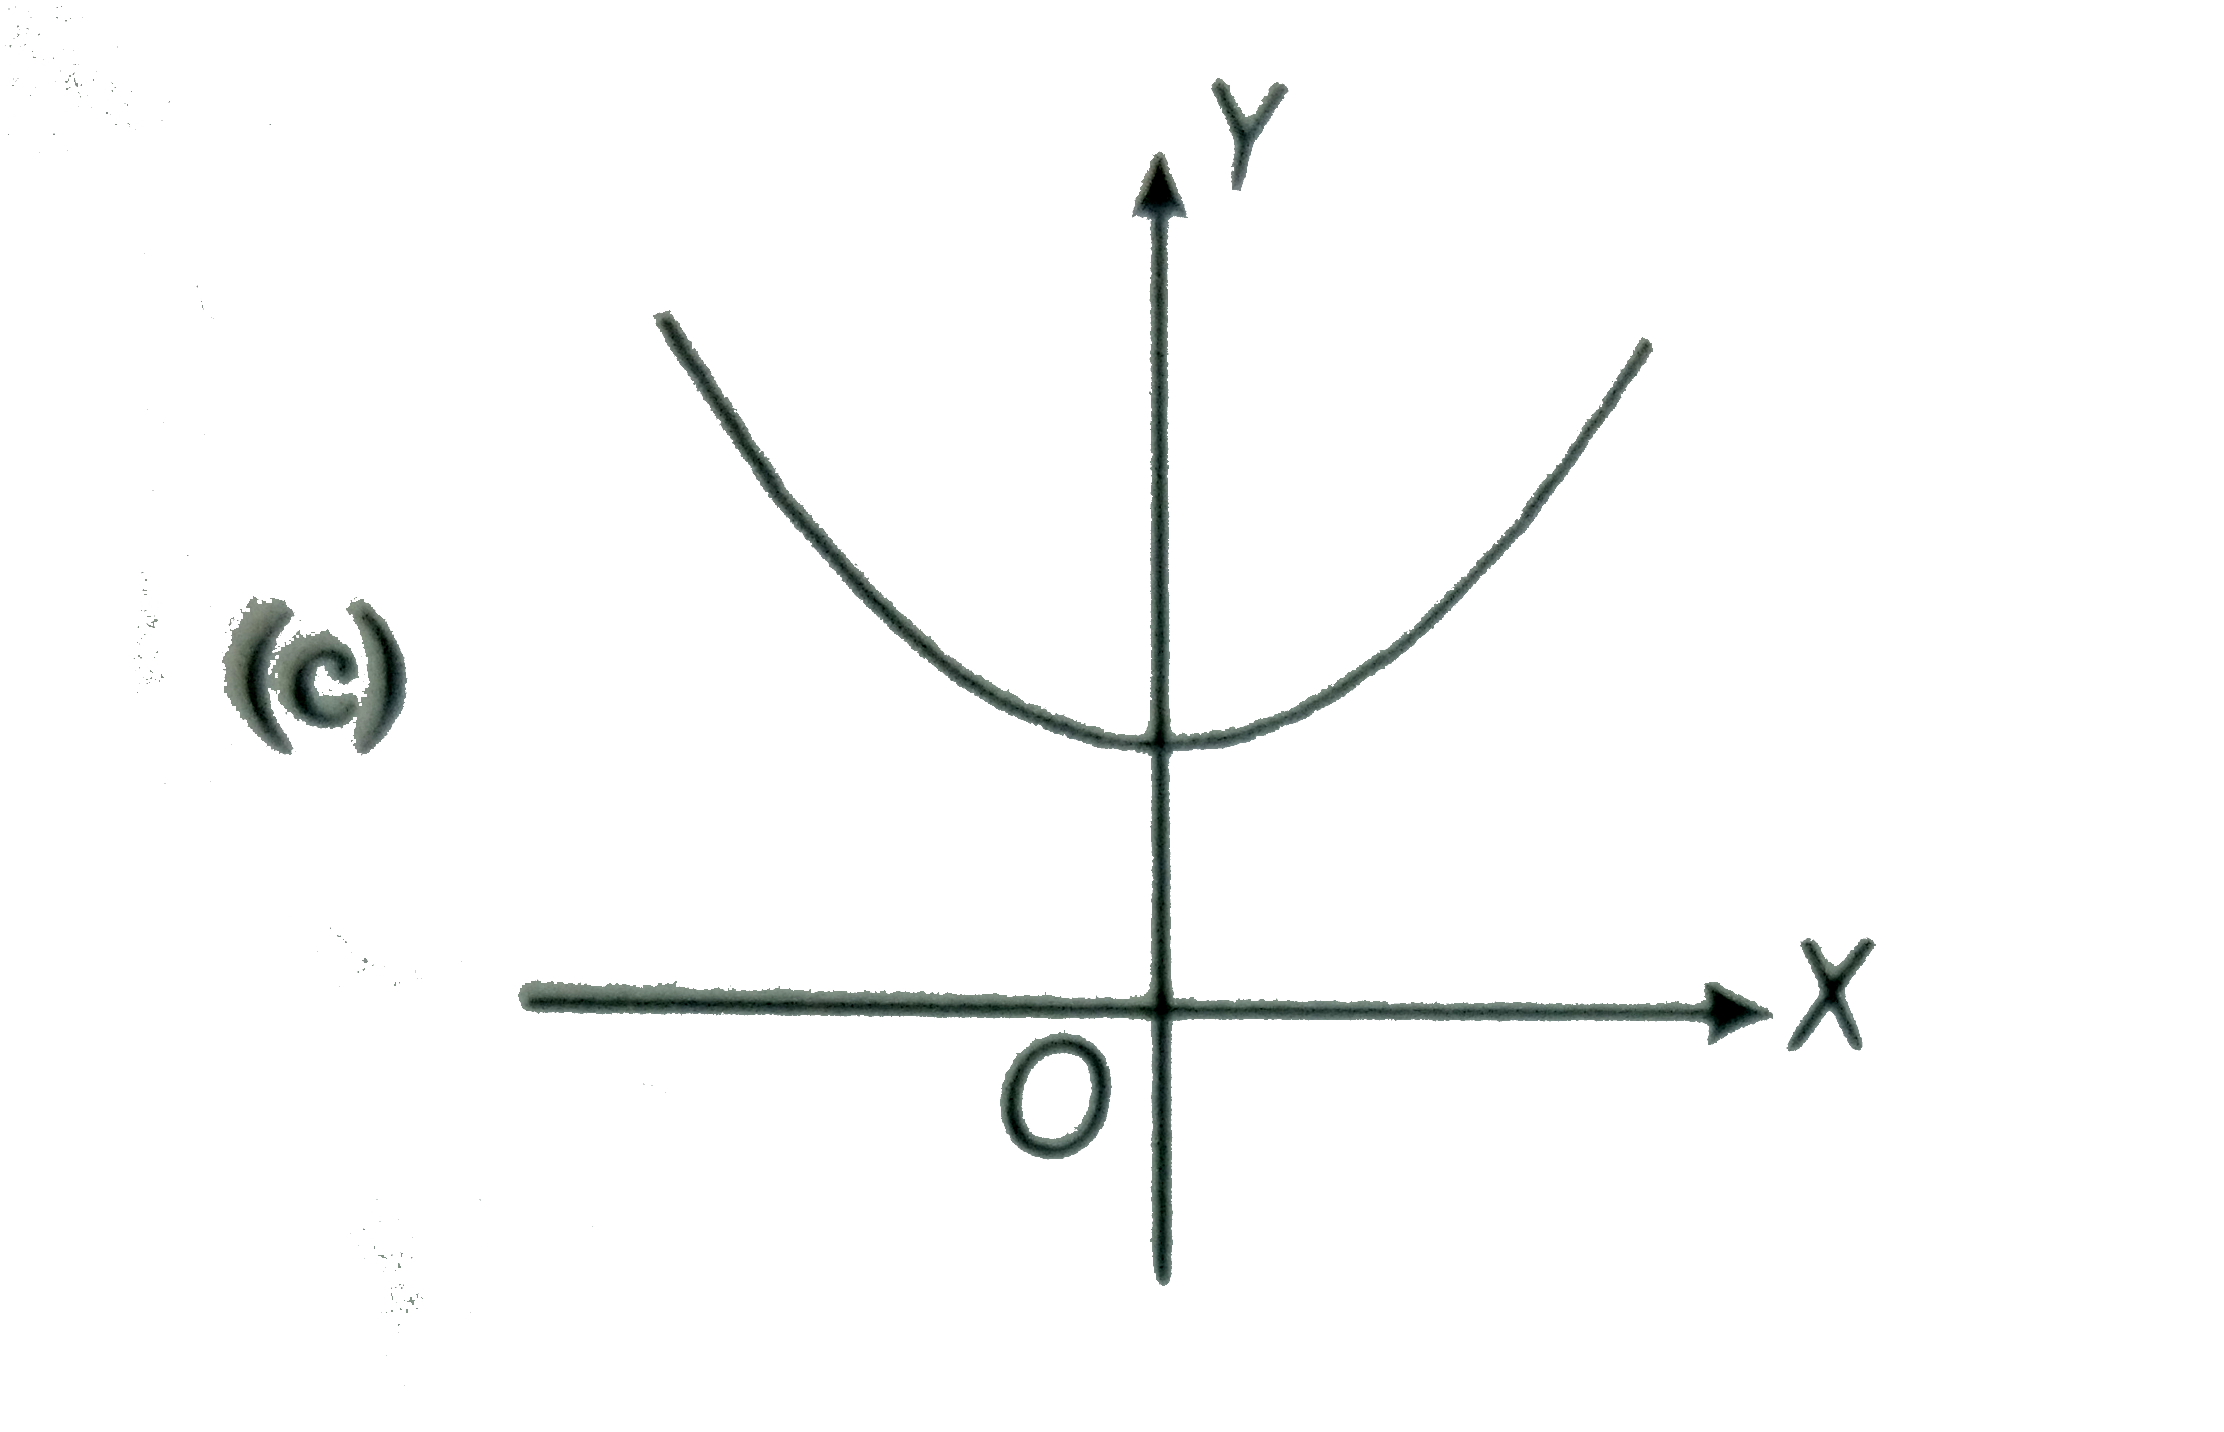 D
D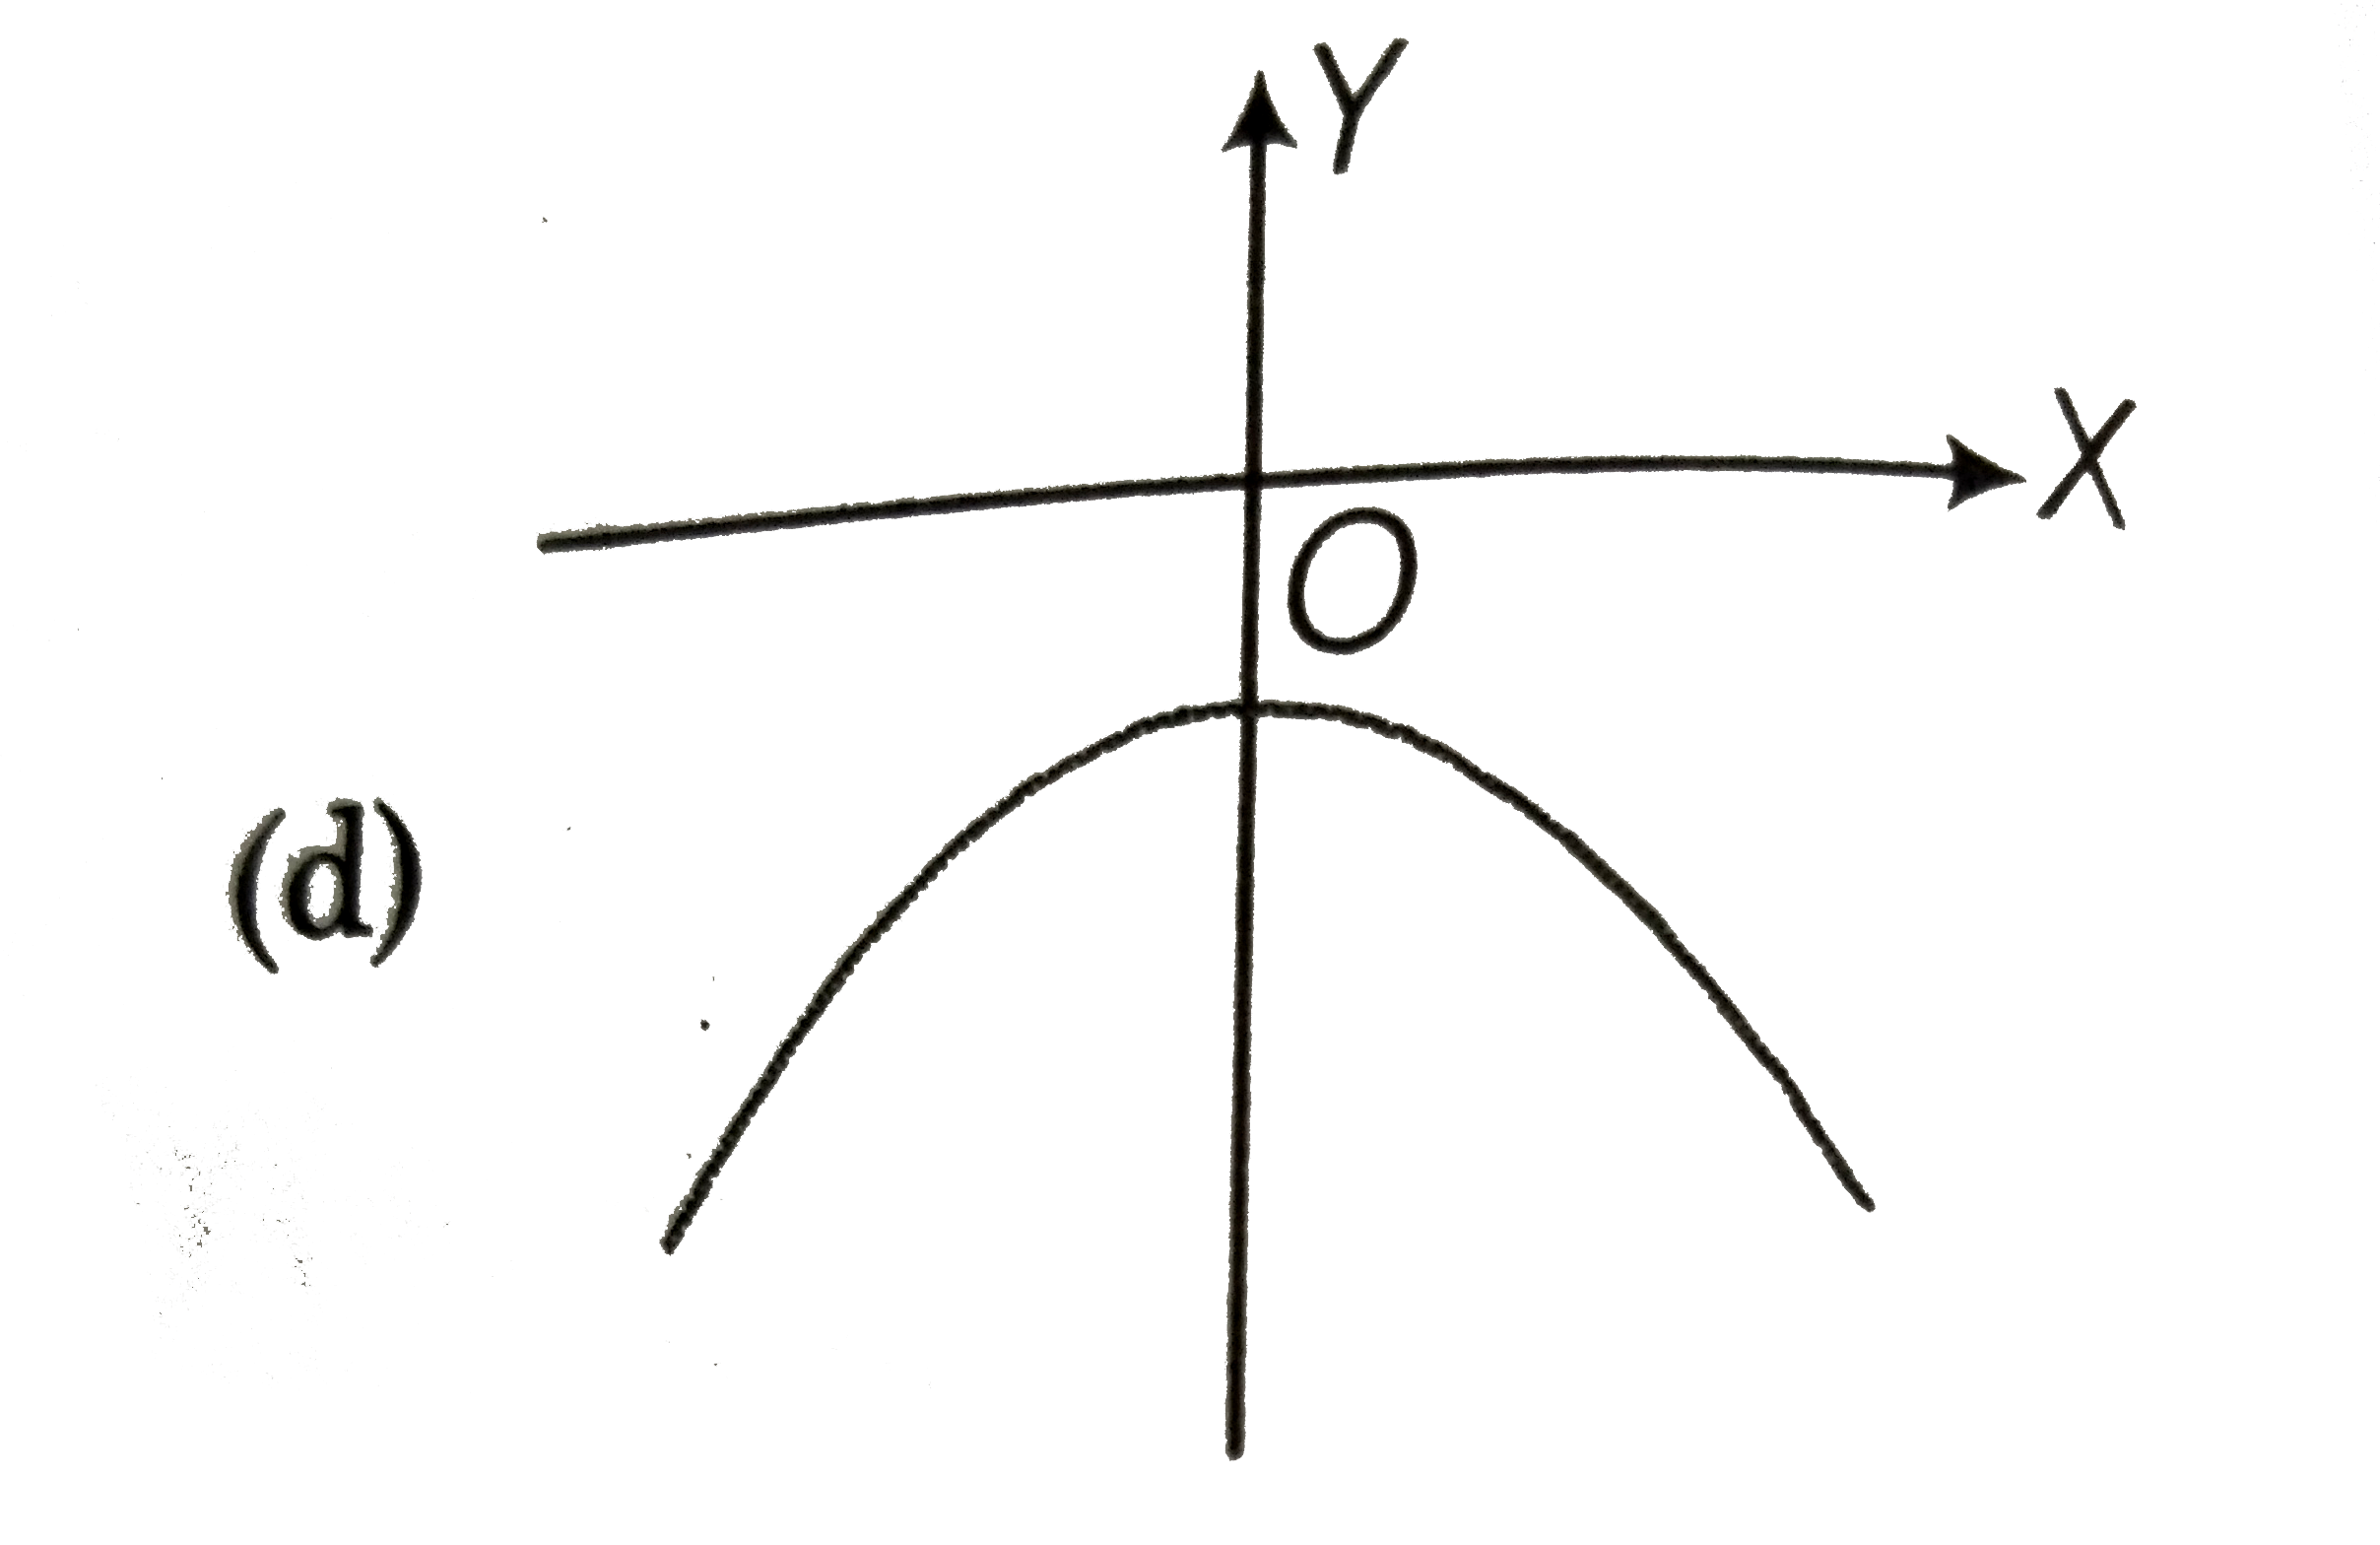
For which of the following graphs of the quadratic expression y=ax2+bx+c, the product a.b.c is negative.
A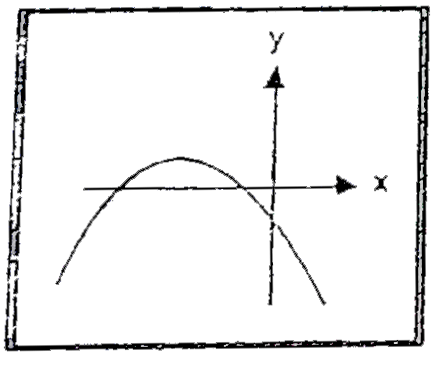 B
B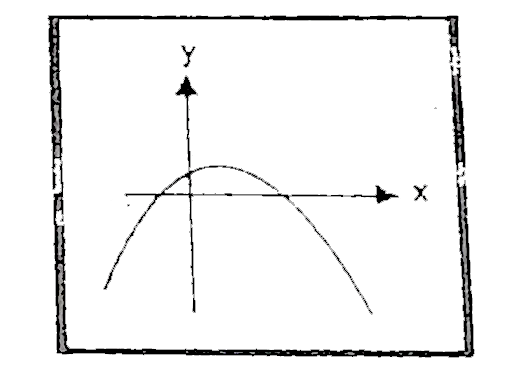 C
C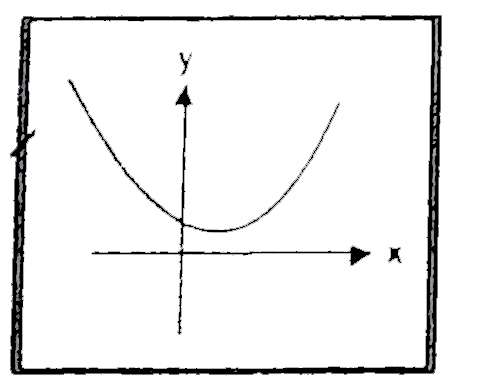 D
D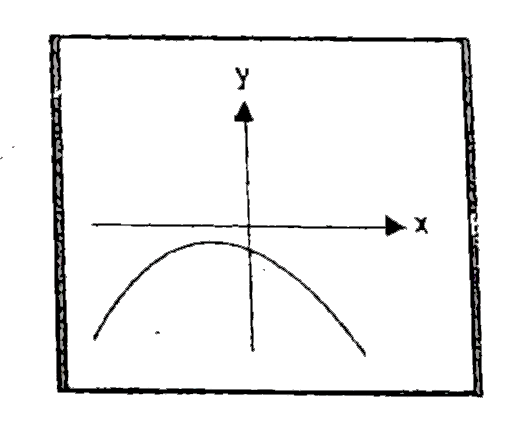
If a,b,c ∈R, then for which of the following graphs of the quadratic polynomial y=ax2−2bx+c(a≠0), the product (abc) is negative ?
A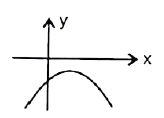 B
B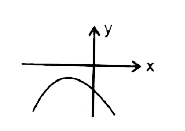 C
C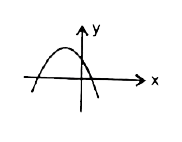 D
D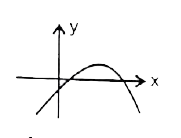
which one of the following can best represent the graph of quadratic polynomial y=ax2+bx+c (where a<0,b<0andc>0) ?
View SolutionThe following figure shows the graph of f(x)=ax2+bx+c, find the sign of a,bandc.
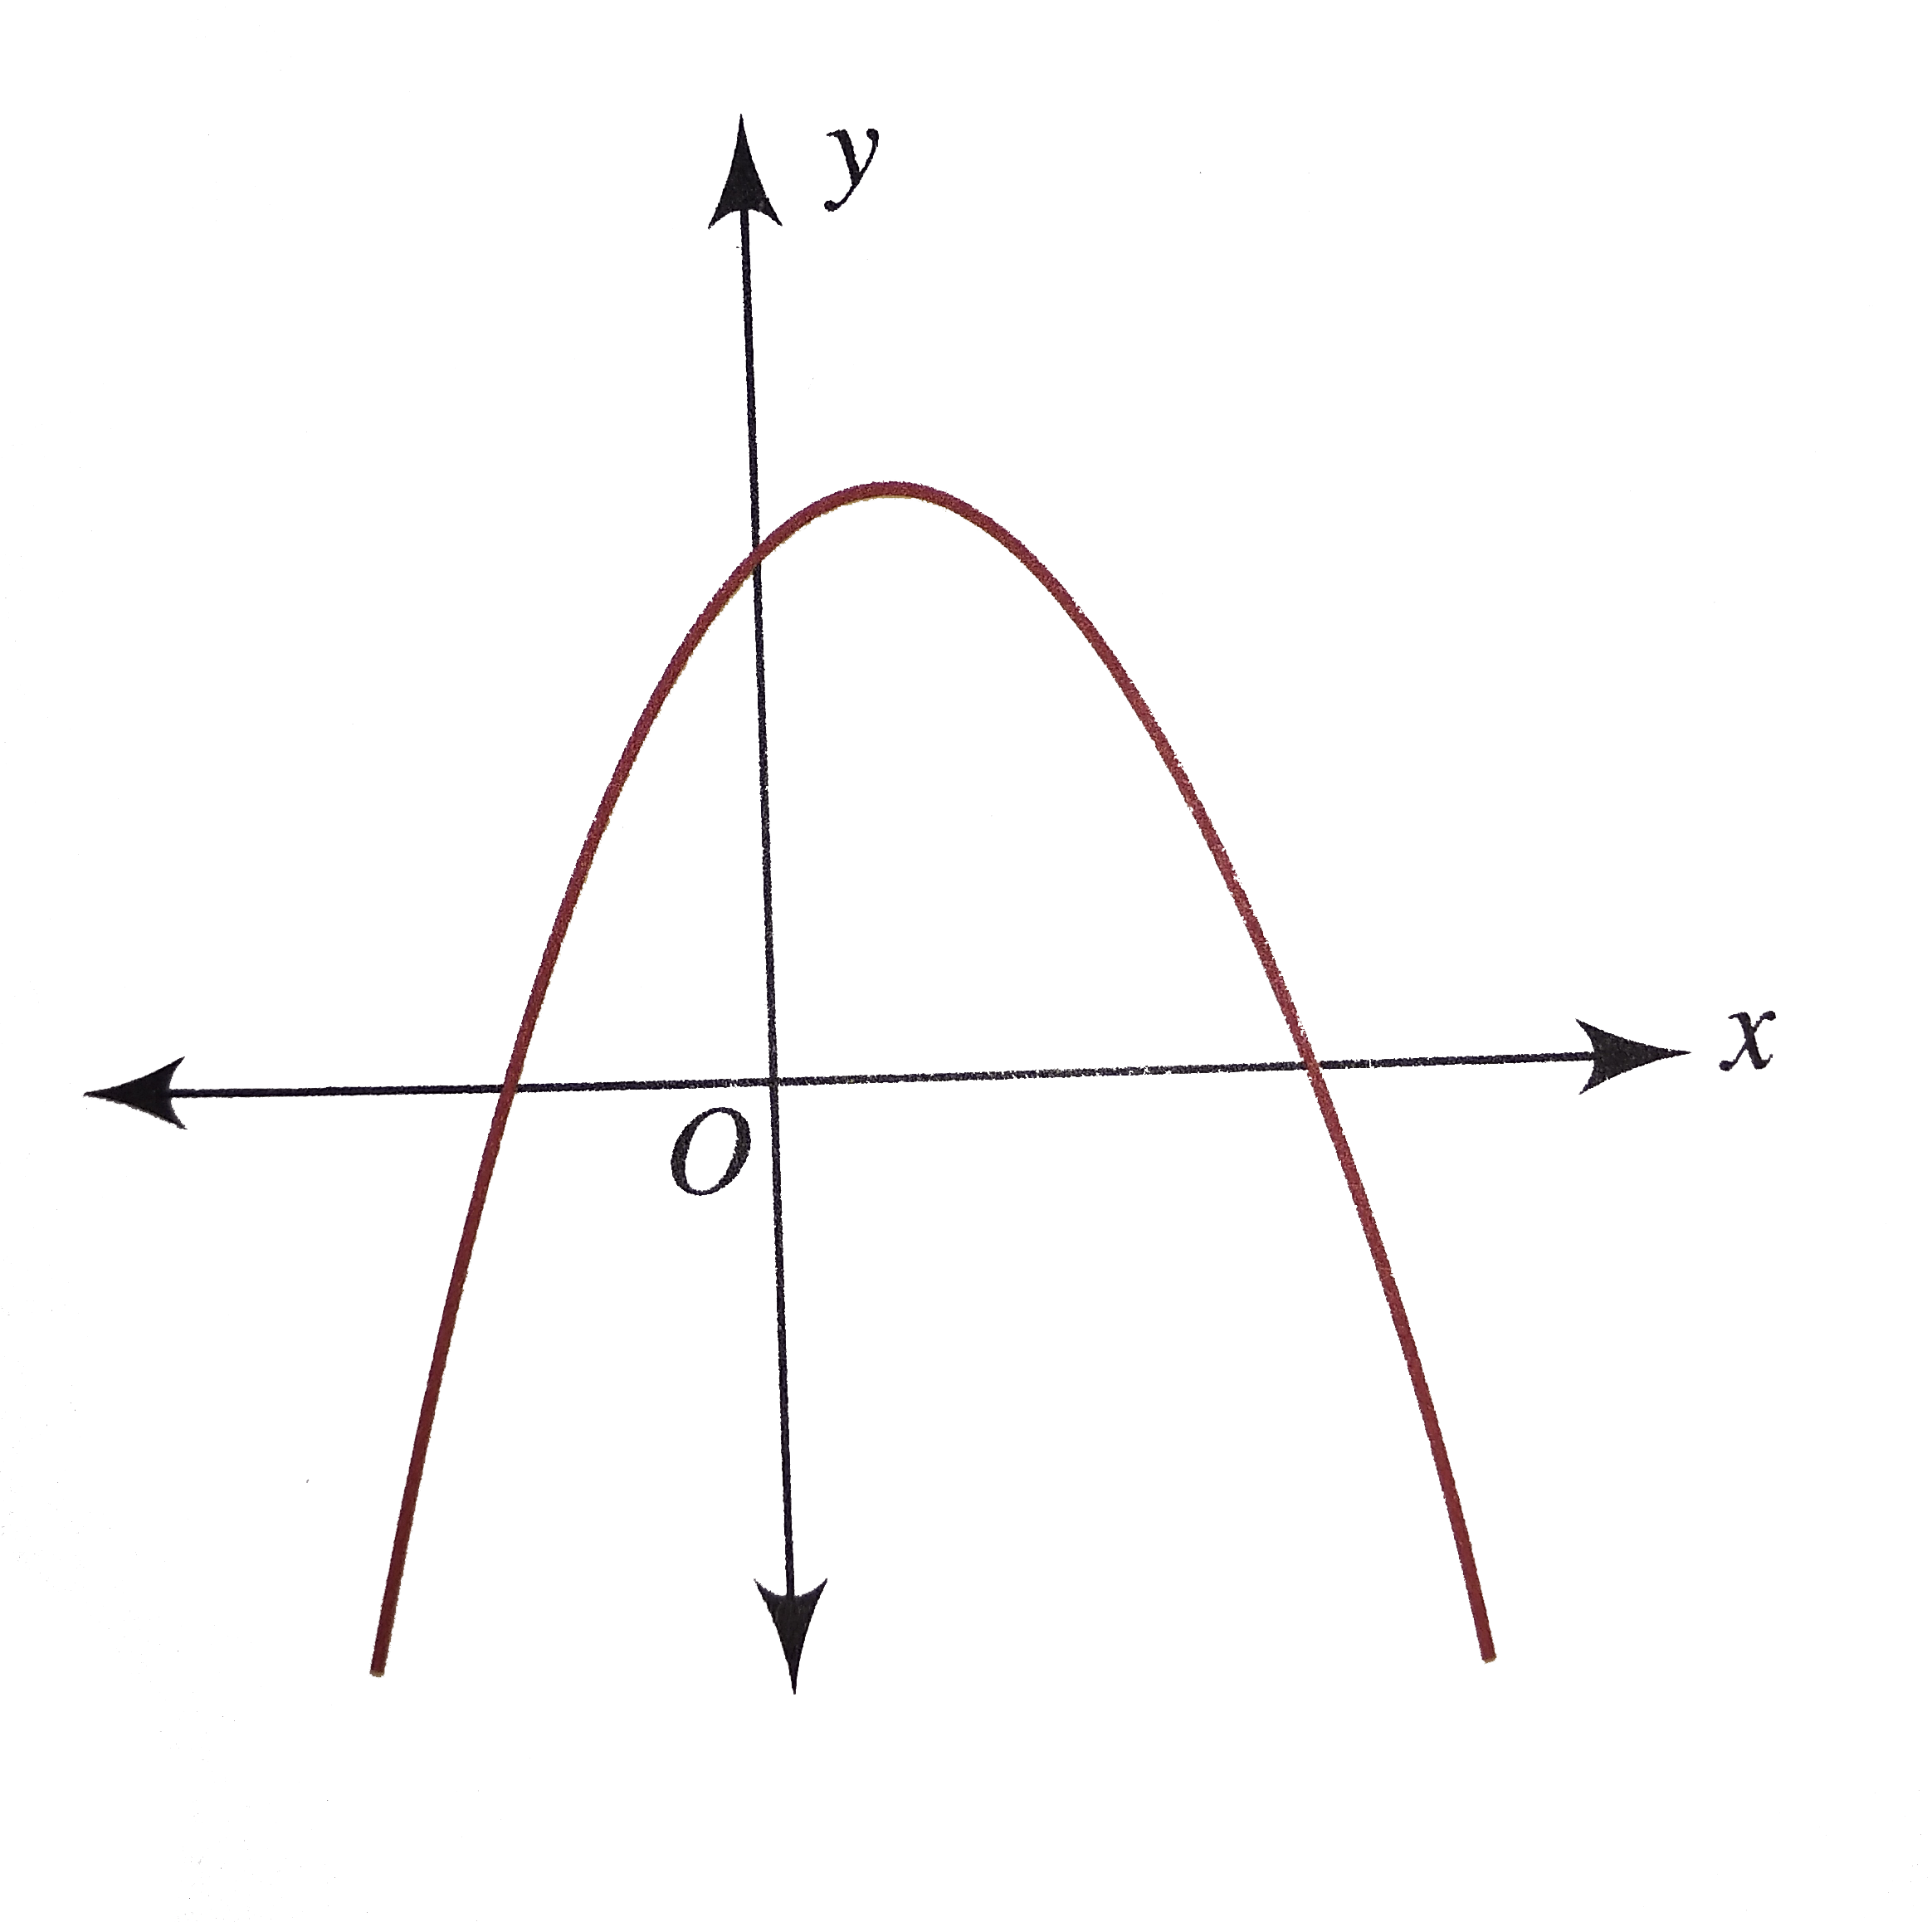
View SolutionThe following figure shows the graph of f(x)=ax2+bx+c, find the signs of a,bandc.

View SolutionIt is given that the expression ax2+bx+c is positive for all x greater than 5 .Then which of the following is true.
(1) the equation ax2+bx+c=0 has equal roots
(2) a>0andb<0
(3) a>0 but b may or may not be negative
(4) c>5
View SolutionFor which of the following graphs the quadratic expression y=ax2+bx+c the product abc is negative ?
View Solution
