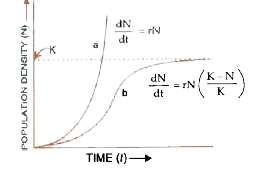
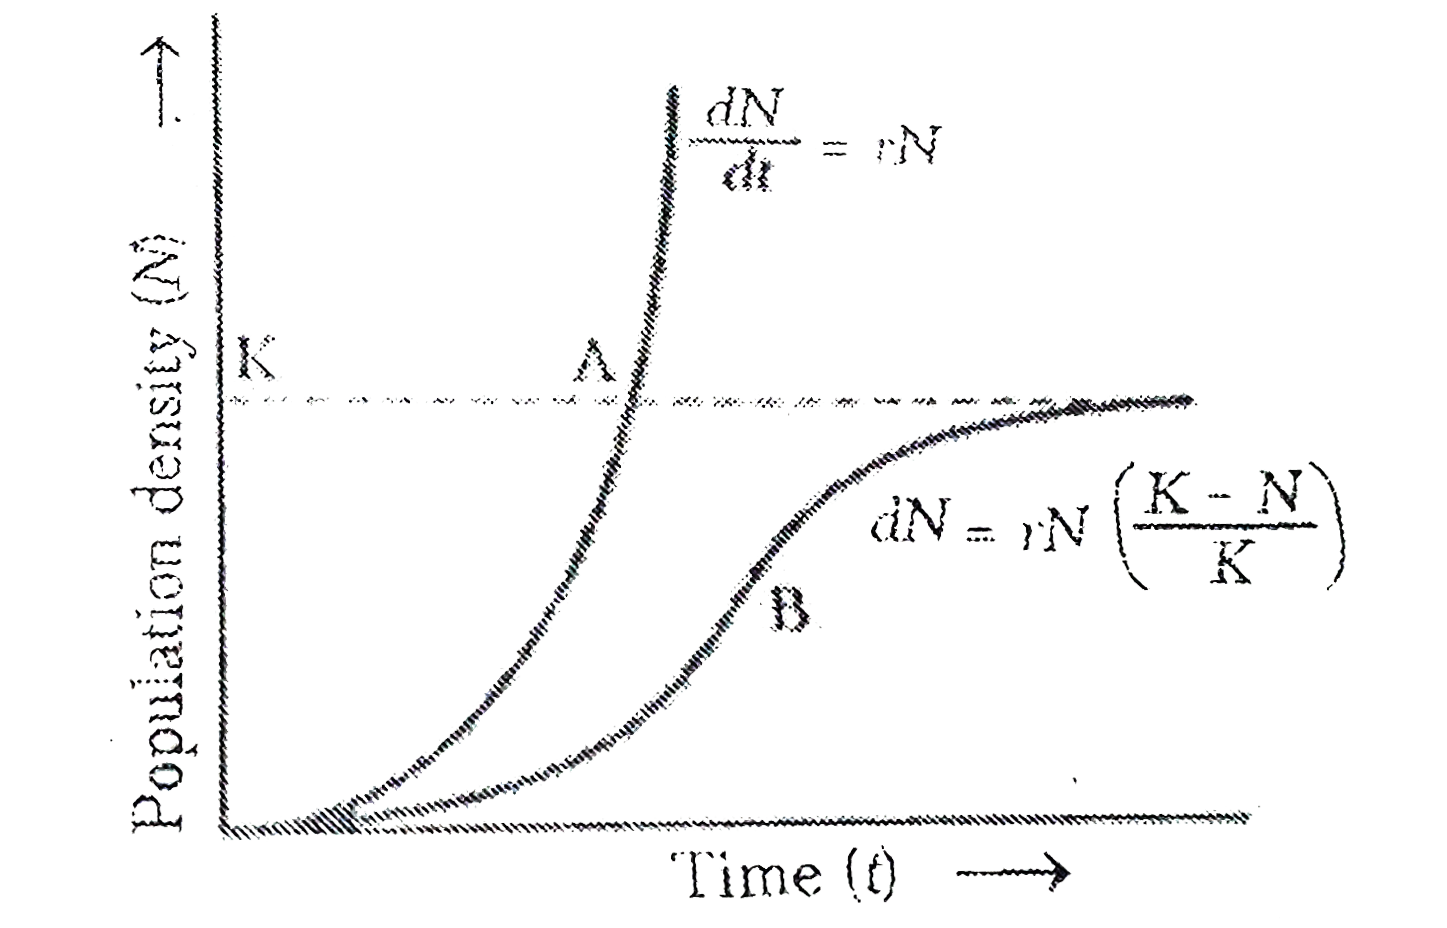
The following graph shows two types of population growth curves:

(i) Name the growth curves.
(ii) What does "K" stand for ?
Video Solution
|
Answer
Step by step video & image solution for The following graph shows two types of population growth curves: (i) Name the growth curves. (ii) What does "K" stand for ? by Biology experts to help you in doubts & scoring excellent marks in Class 12 exams.
Updated on:21/07/2023Topper's Solved these Questions
- ORGANISMS AND POPULATIONS BOOK - MODERN PUBLICATIONCHAPTER - ORGANISMS AND POPULATIONS EXERCISE - REVISION EXERCISES (IV. SHORT ANSWER TYPE - II QUESTIONS) (B. QUESTIONS FROM CBSE EXAMINATIONS)
15 Videos
- ORGANISMS AND POPULATIONS BOOK - MODERN PUBLICATIONCHAPTER - ORGANISMS AND POPULATIONS EXERCISE - REVISION EXERCISES (VI. LONG ANSWER TYPE QUESTIONS)(A. QUESTIONS FROM STATE BOARD EXAMINATIONS)
12 Videos
- ORGANISMS AND POPULATIONS BOOK - MODERN PUBLICATIONCHAPTER - ORGANISMS AND POPULATIONS EXERCISE - REVISION EXERCISES (III. SHORT ANSWER TYPE - I QUESTIONS) (B. QUESTIONS FROM CBSE EXAMINATIONS)
18 Videos
- MOLECULAR BASIS OF INHERITANCE BOOK - MODERN PUBLICATIONCHAPTER - MOLECULAR BASIS OF INHERITANCE EXERCISE - CHAPTER PRACTICE TEST (Section - E)
1 Videos
- PRINCIPLES OF INHERITANCE AND VARIATIONBOOK - MODERN PUBLICATIONCHAPTER - PRINCIPLES OF INHERITANCE AND VARIATIONEXERCISE - CHAPTER PRACTICE TEST section-e(Long answer type question)
1 Videos
Similar Questions
Knowledge Check
Population growth curve is sigmoid, if the growth pattern is
ALogisticBGeometricCExponentialDAccretionaryPopulation growth-curve is sigmoid, if the growth pattern is
AlogisticBgeometricCexponentialDaccretionaryThe equation for J-shaped population growth curve is
AdNdt=rNBdNdt=rN(K−NK)CNt=N0+B+I−D−EDD=NS
Name two types of growth curves.
View SolutionDraw population growth curves and explain them .
View SolutionWhat are the two components of population growth?
View SolutionThe graph shows two types of population growth curve A is exponential and B is logistic.

Which one of the following growth model considered as more realistic one?
View SolutionIn sigmoid populations growth curve, the initial stage of the curve is called :
View Solution
