The table given below represents the amount of education loan ( in Rs. Crores ) disbursed by 5 banks of a country over 5 years.

Which of the following is the correct order of percentage increase in loan amount disbursed by the given banks from 2010 to 2014 ?
Bank 3 > Bank 5 > Bank 2 > Bank 1 > Bank 4
Bank 2 > Bank 3 > Bank 5 > Bank 1 > Bank 4
Bank 5 > Bank 2 > Bank 3 > Bank 4 > Bank 1
Bank 2 > Bank 5 > Bank 4 > Bank 3 > Bank 1
The correct Answer is:3
Step by step video, text & image solution for The table given below represents the amount of education loan ( in Rs. Crores ) disbursed by 5 banks of a country over 5 years. Which of the following is the correct order of percentage increase in loan amount disbursed by the given banks from 2010 to 2014 ? by Maths experts to help you in doubts & scoring excellent marks in Class 14 exams.
Updated on:21/07/2023Similar Questions
The table given below represents the amount of edication loan (in Rs. crores) disturbed by 5 banks of a country over 5 years.

Which of the following is the correct order of percentage increase in loan amount disbursed by the given banks from 2010 t 2014?
View SolutionThe table given below represents the amount of edication loan (in Rs. crores) disturbed by 5 banks of a country over 5 years.

Which banks show a continuous trend of increase / decrease in loan amount disbursed over 5 years?
View Solution
Knowledge Check
The table given below represents the amount of education loan ( in Rs. Crores ) disbursed by 5 banks of a country over 5 years.

Which banks show a continuous trend of increase /decrease in loan amount disbursed over 5 years ?ABank 1 and Bank 4BBank 1, Bank 4 and Bank 3CBank 1, Bank 4 and Bank 5DBank 1, Bank 4 and Bank 5The table given below represents the amount of education loan ( in Rs. Crores ) disbursed by 5 banks of a country over 5 years.

What is the percentage increase in education loan disbursed by Bank 2 from 2010 to 2014 ?A85.42B87.69C89.21D83.18The table given below represents the amount of education loan ( in Rs. Crores ) disbursed by 5 banks of a country over 5 years.

What can be said about the two following ratios ?
I. Loan amount disbursed by Bank 1 in 2011/Loan amount disbursed by Bank 2 in 2014
II. Loan amount disbursed by Bank 3 in 2014/Loan amount disbursed by Bank 4 in 2011AI>IIBI<IICI=IIDNo relation
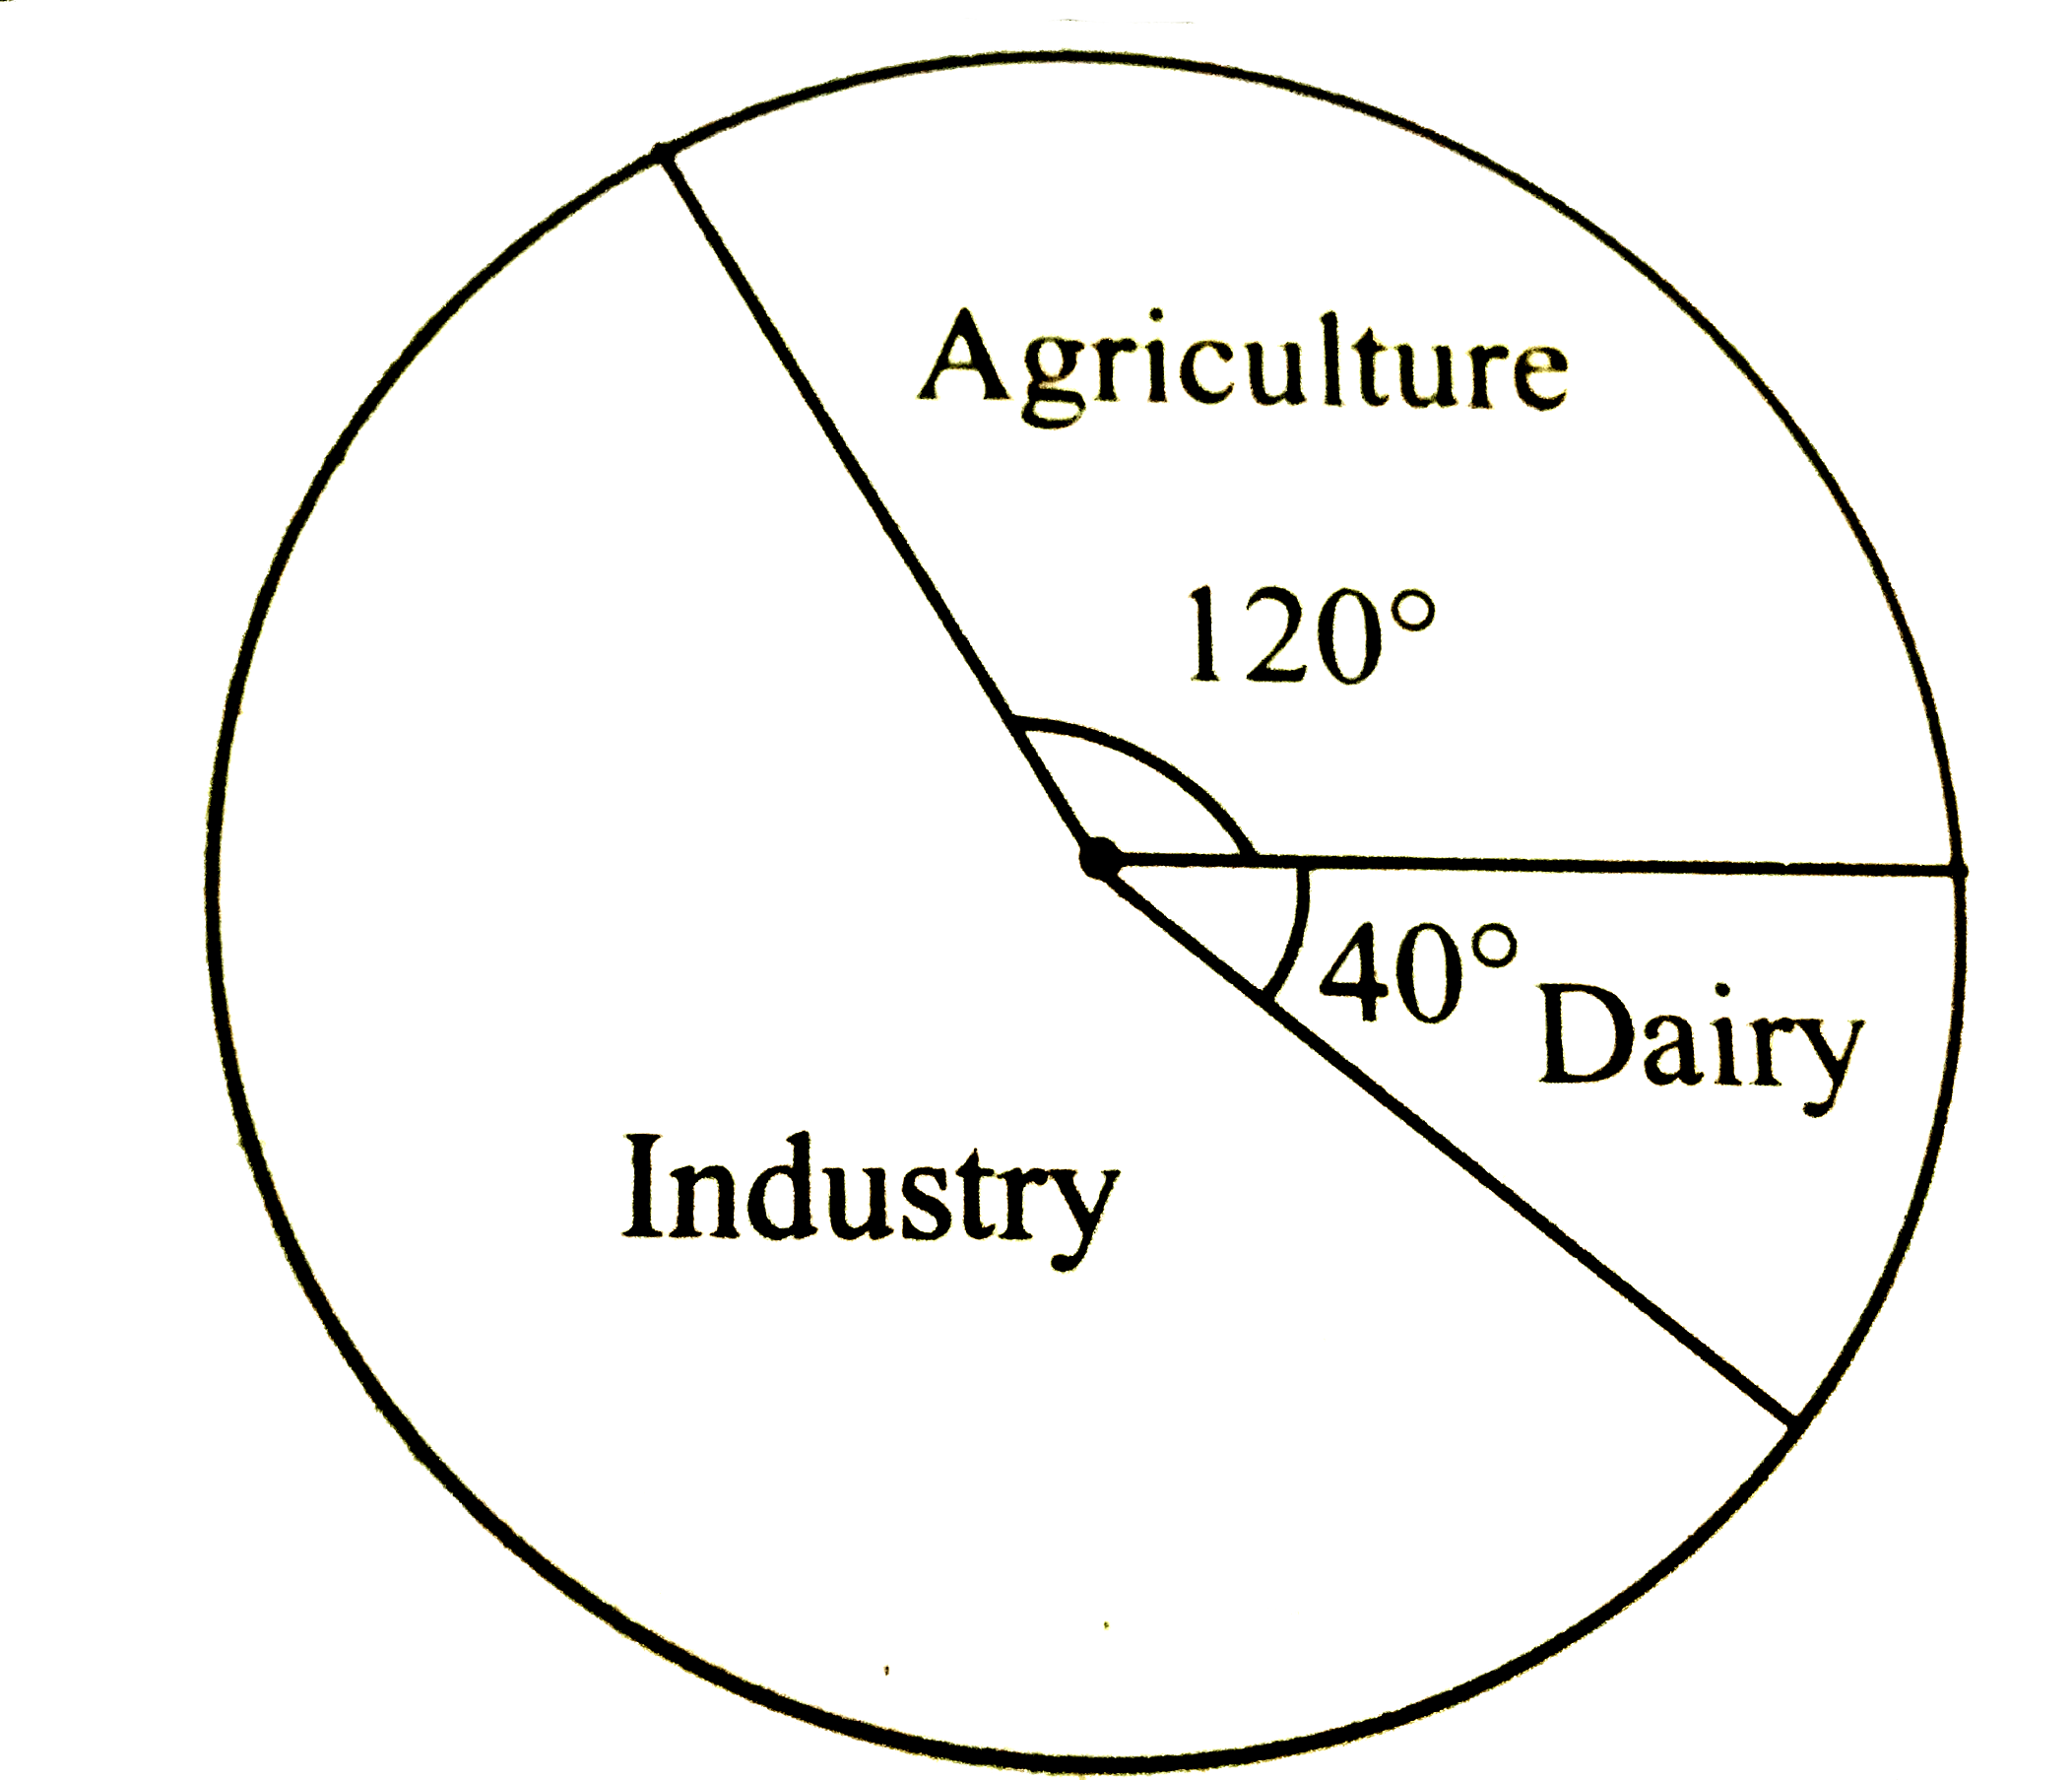
The following pie diagram represents the sectorwise loan amount in crores of rupees distributied by a bank. From the information answer the following questions:
i. If the dairy sector receives Rs20 crores, then find the total loan disbursed.
ii. Find the loan amount for agriculture sector and also for idustrial sector.
iii How much additional amount did industrial sector receive than agriculture sector?

View SolutionThe table given below represents the amount of education loan (in Rs. crores) disbursed by 5 banks of a country over 5 years.

What is the percentage increase in education loan disbursed by Bank 2 from 2010 to 2014?
View SolutionThe table given below represents the amount of edication loan (in Rs. crores) disturbed by 5 banks of a country over 5 years.

What can be said about the two following ratios?
I. Loan amount disbursed by Bank 1 in 2010/ loan disbursed by Bank 2 in 2014
II. Loan amount disbursed by Bank 3 in 2014 / Loan amount disbursed by Bank 4 in 2011
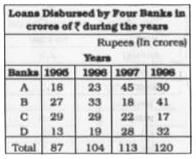
View SolutionRead the following table and answer the questions below it:

In which of the following banks, there was a continued increase in loan disbursement throughtout the years ?
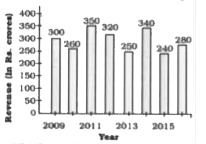
View SolutionThe bar graph given below represents the revenue of a firm for 8 years. All the revenue figures have been shown in terms of Rs. crores.

In which year the firm has shown maximum percentage with respect to the previous year ?
View Solution
