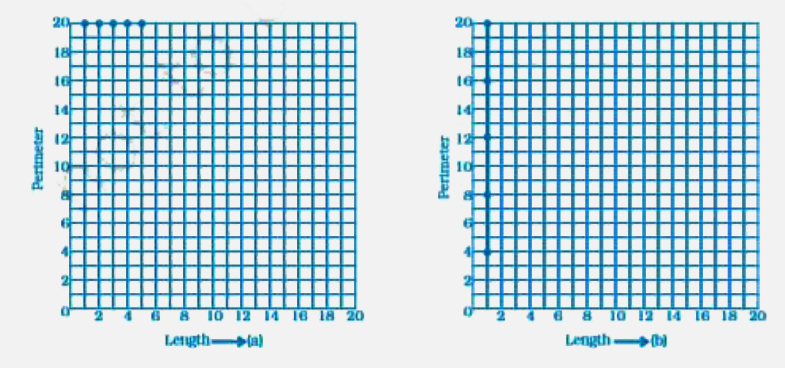
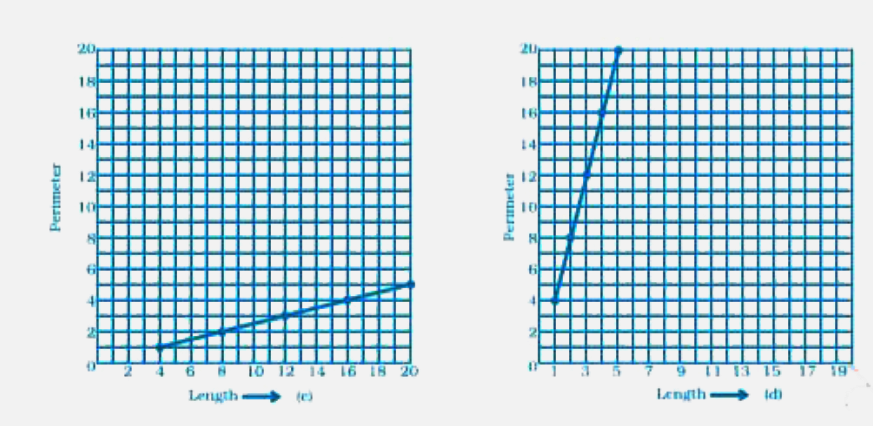
All the graphs below are intended to represent the same motion. One of them does it incorrectly. Pick it up.
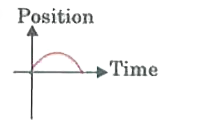
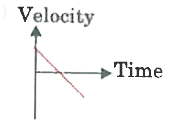
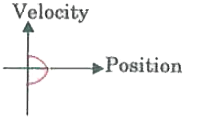
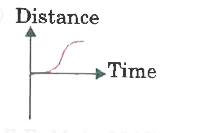
The correct Answer is:D
Option a,b and c represent the graphs for a situation when velocity of the particle first decreases and then becomes zero for a moment and then it increases in the opposite direction. But in the graph d we can see that speed is first increasing and then decreasing hence this is not consistent with others So option d is incorrect.
Topper's Solved these Questions
- BOOK - MODERN PUBLICATIONCHAPTER - MOTION IN A STRAIGHT LINE EXERCISE - COMPETITION FILE ( C.(MULTIPLE CHOICE QUESTIONS))13videos
MOTION IN A STRAIGHT LINE
- BOOK - MODERN PUBLICATIONCHAPTER - MOTION IN A STRAIGHT LINE EXERCISE - COMPETITION FILE ( D.(MULTIPLE CHOICE QUESTIONS))9videos
MOTION IN A STRAIGHT LINE
- BOOK - MODERN PUBLICATIONCHAPTER - MOTION IN A STRAIGHT LINE EXERCISE - COMPETITION FILE ( A.(MULTIPLE CHOICE QUESTIONS))20videos
MOTION IN A STRAIGHT LINE
- BOOK - MODERN PUBLICATIONCHAPTER - MOTION IN A PLANE EXERCISE - Chapter Practice Test15videos
MOTION IN A PLANE
- BOOK - MODERN PUBLICATIONCHAPTER - OSCILLATIONS EXERCISE - Practice Test (For Board Examination)12videos
OSCILLATIONS
Similar Questions
Knowledge Check
- Question 1 - Select One or More
Which of the graphs shown below represent the motion with uniform speed?
A B
B C
C D
D
- Question 2 - Select One
Which of the following curves does not represent motion in one dimensions?
A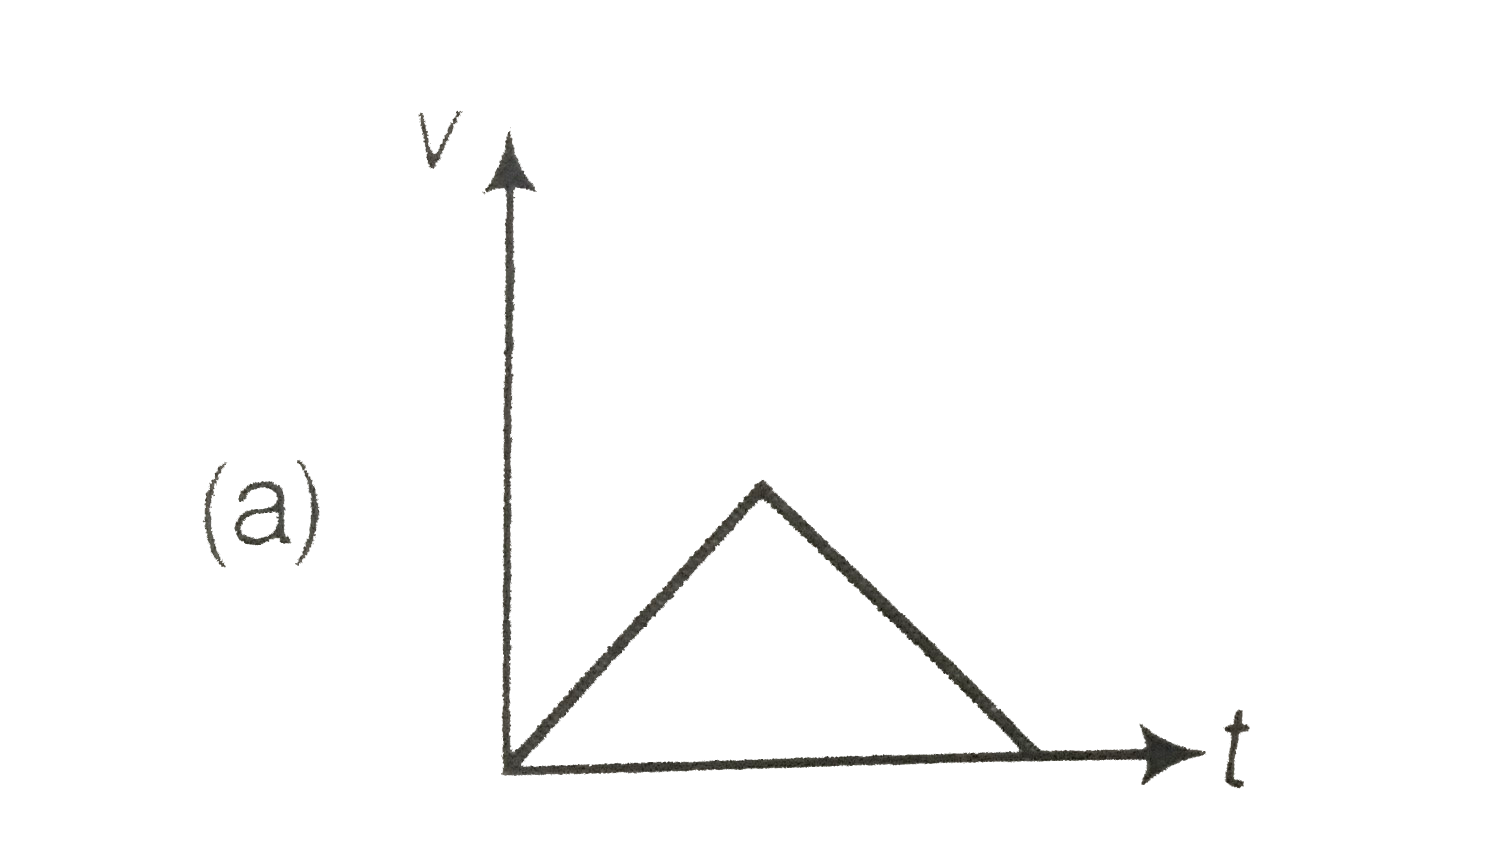 B
B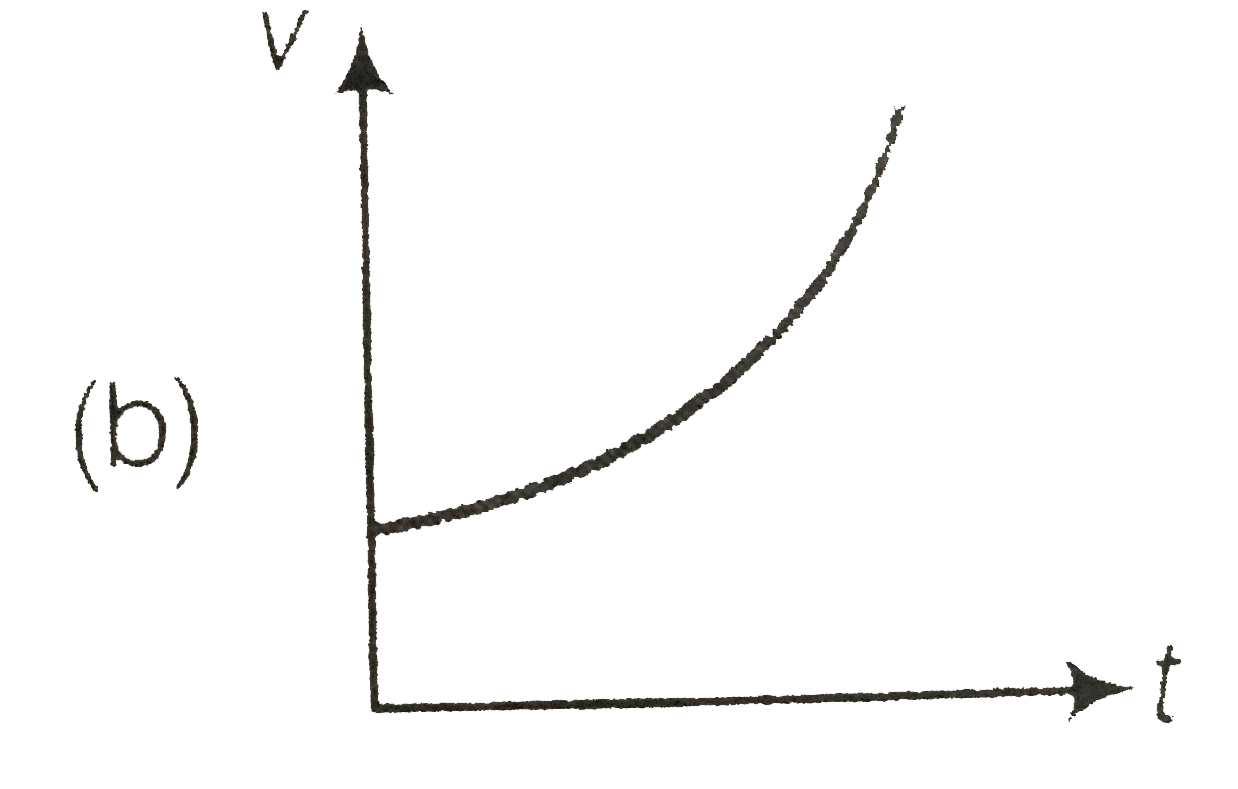 C
C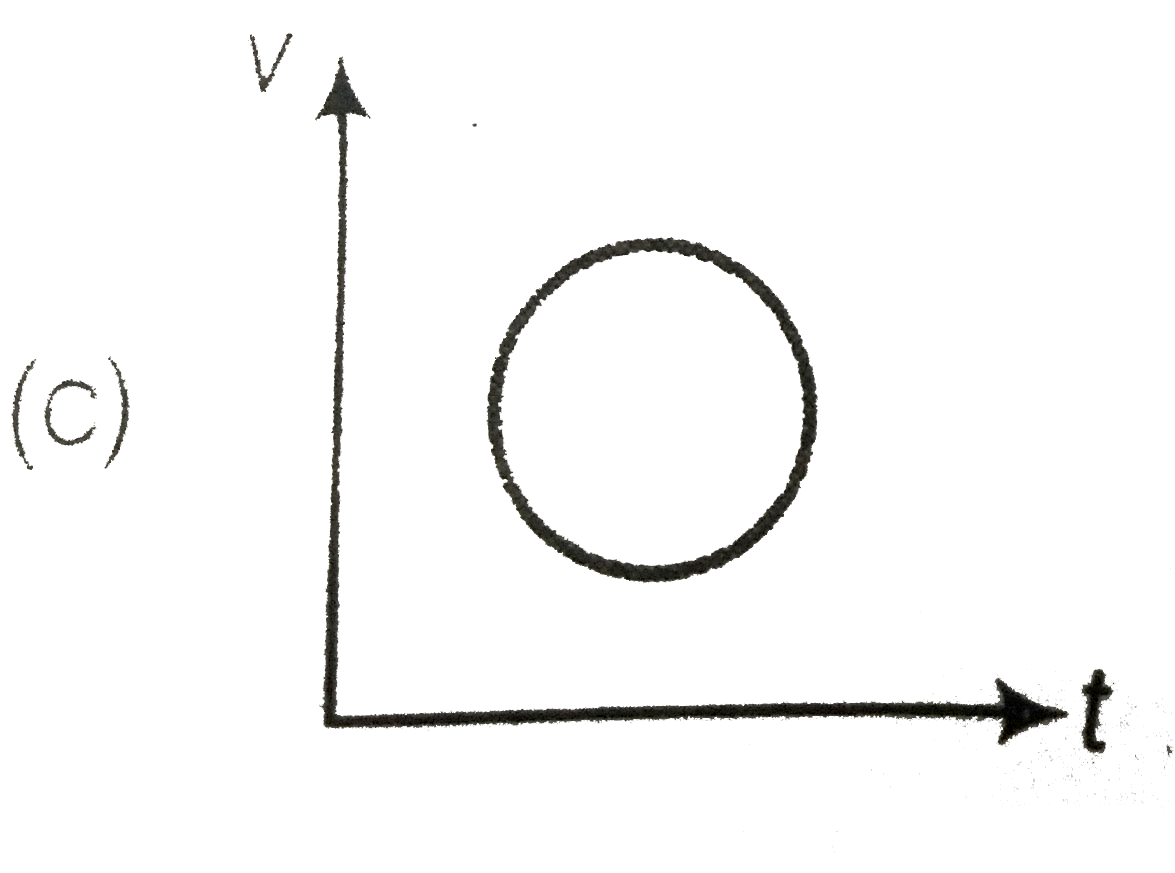 D
D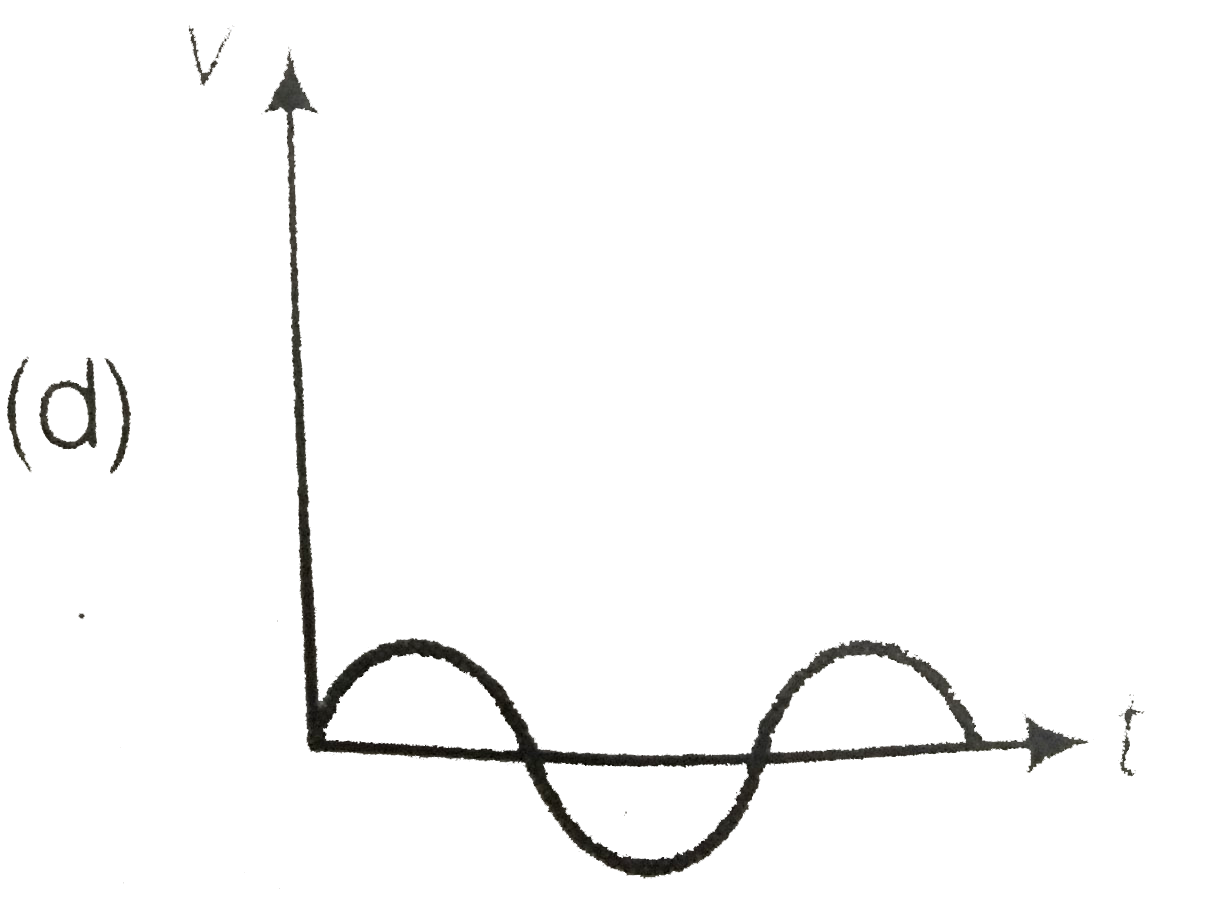
- Question 3 - Select One
Which of the following curves does not represent motion in one dimension ?
A B
B C
C D
D
Which of the graphs shown below does not represent the relationship between incident light and the electron ejected from metal surface?
View SolutionStudy the charactristics of a population represented in the graphs below.
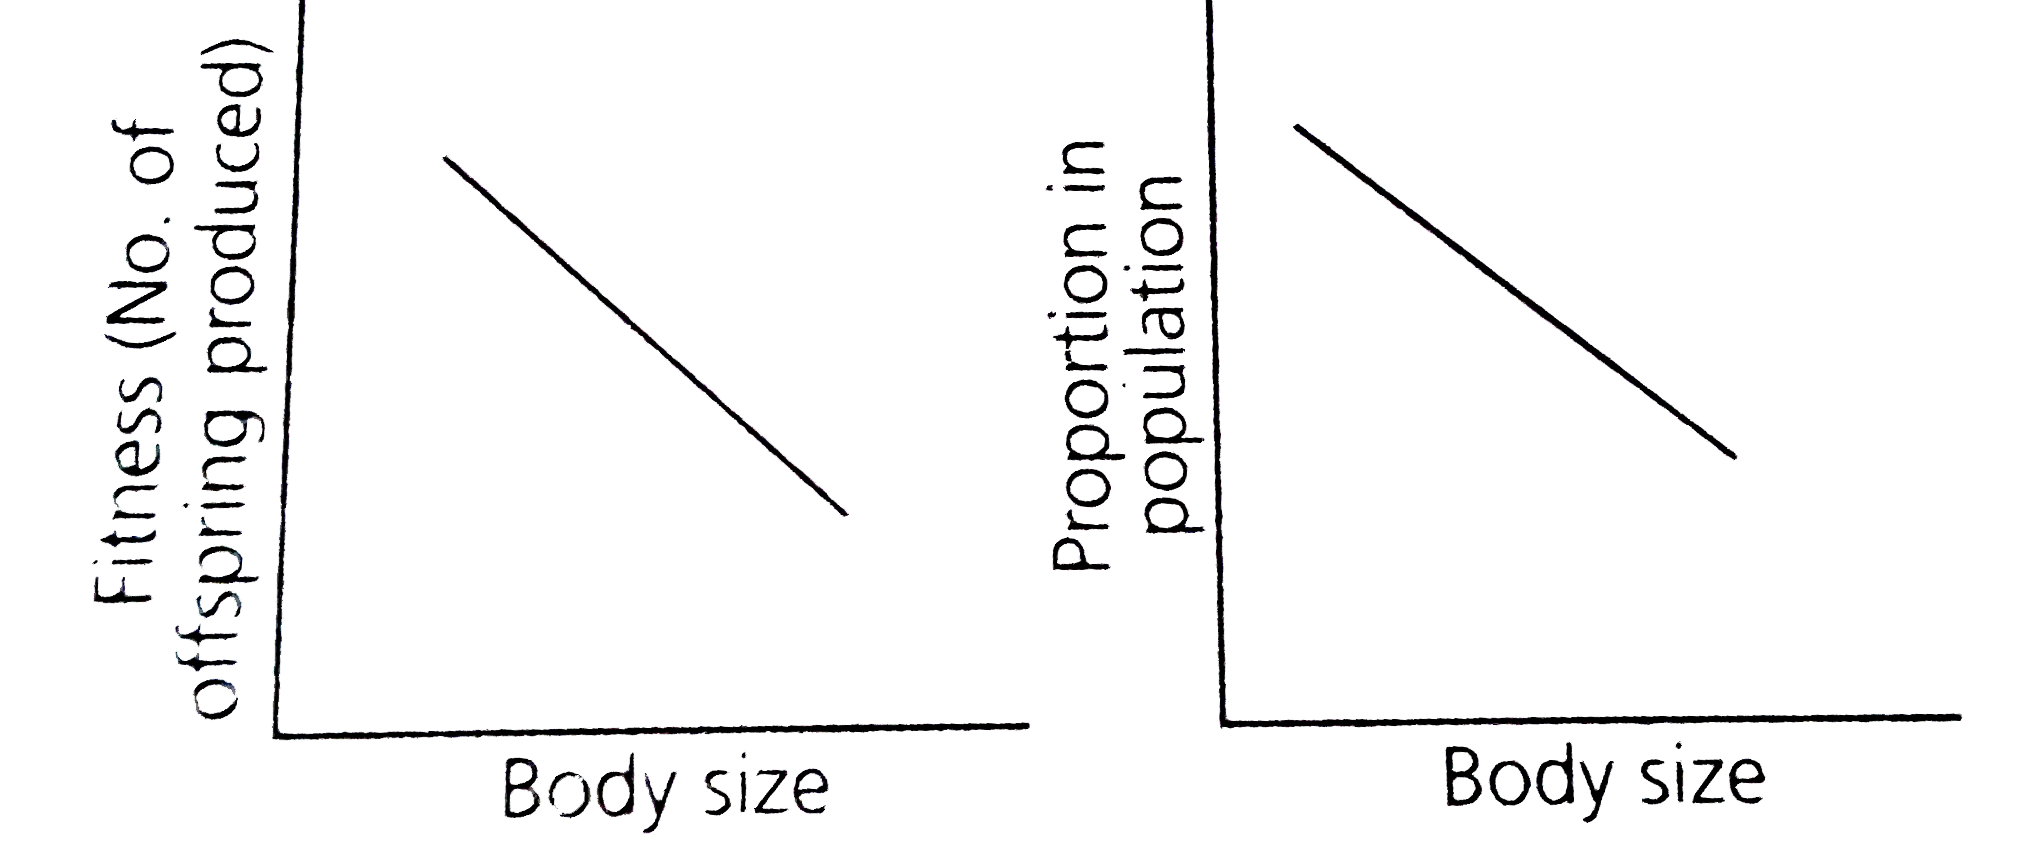
Mark the correct graph that represents the type of selection that this population is likely to undergo
 View Solution
Study the charactristics of a population represented in the graphs below.

Mark the correct graph that represents the type of selection that this population is likely to undergo
 View Solution
The graph that does represent the behaviour of an ideal gas is :
View SolutionWhich of the following pairs of graphs does not represent the motion of he same particle in the same interval (curves are parabollic):−
View Solution


