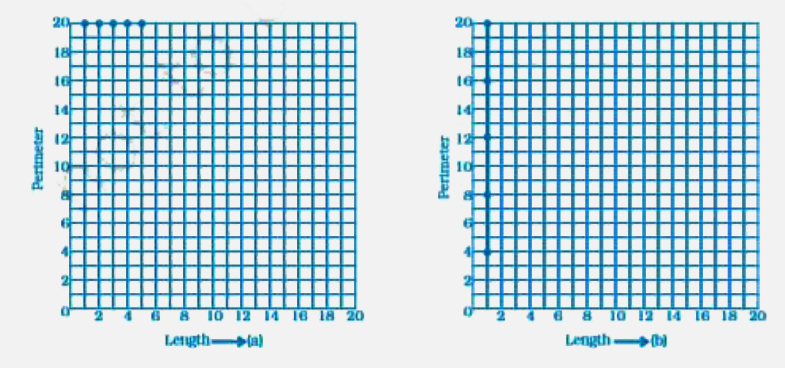
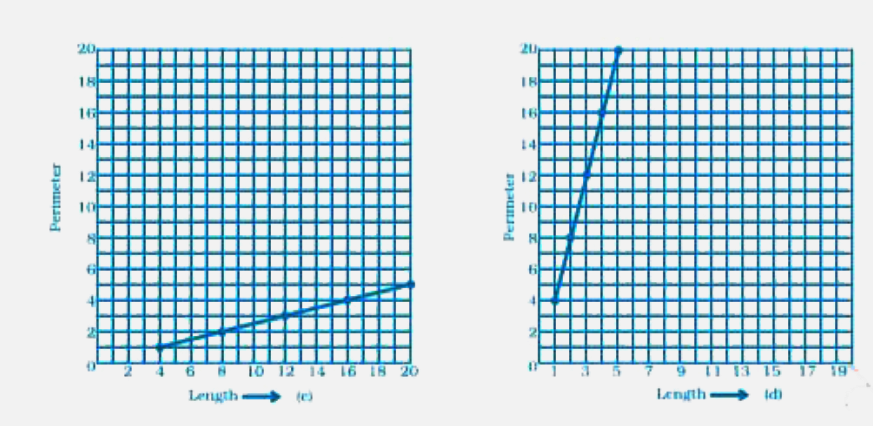
Which graphs of the following represent the table below?
Video Solution
|
Answer
Step by step video & image solution for Which graphs of the following represent the table below? by Maths experts to help you in doubts & scoring excellent marks in Class 8 exams.
Updated on:21/07/2023Topper's Solved these Questions
- INTRODUCTION TO GRAPHS Book:NCERT EXEMPLARChapter:INTRODUCTION TO GRAPHS Exercise:THINK AND DISCUSS
Explore 4 Videos
- EXPONENTS AND POWERSBook:NCERT EXEMPLARChapter:EXPONENTS AND POWERSExercise:EXERCISE
Explore 195 Videos
- LINEAR EQUATIONS IN ONE VARIABLEBook:NCERT EXEMPLARChapter:LINEAR EQUATIONS IN ONE VARIABLEExercise:THINK AND DISCUSS
Explore 3 Videos
Similar Questions
Knowledge Check
Which of the following graph represents e−x?
A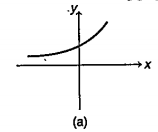 B
B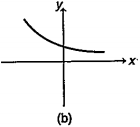 C
C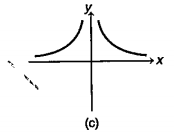 D
D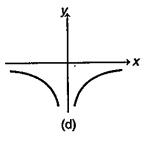
Which of the following graph represents 3s orbital
A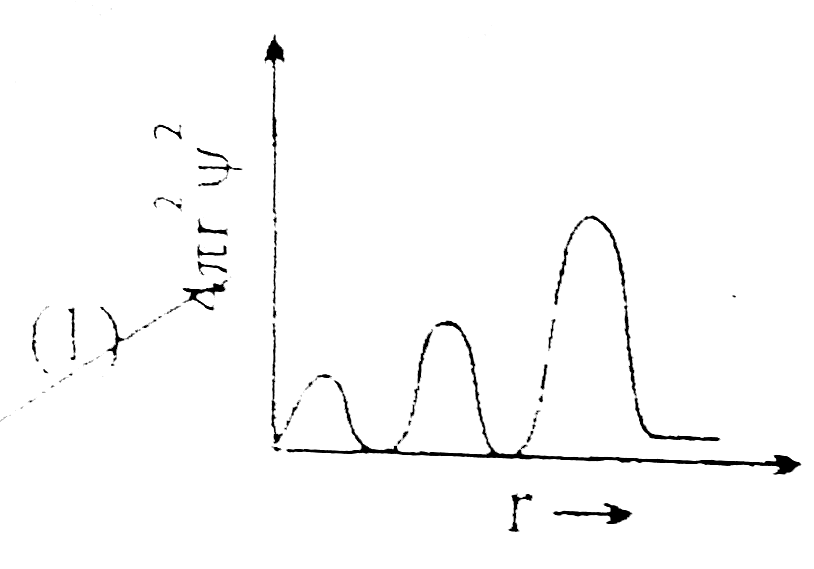 B
B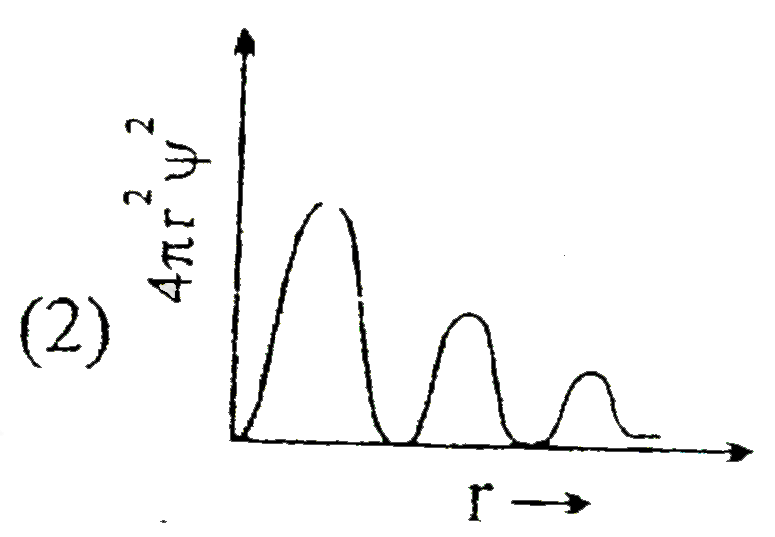 C
C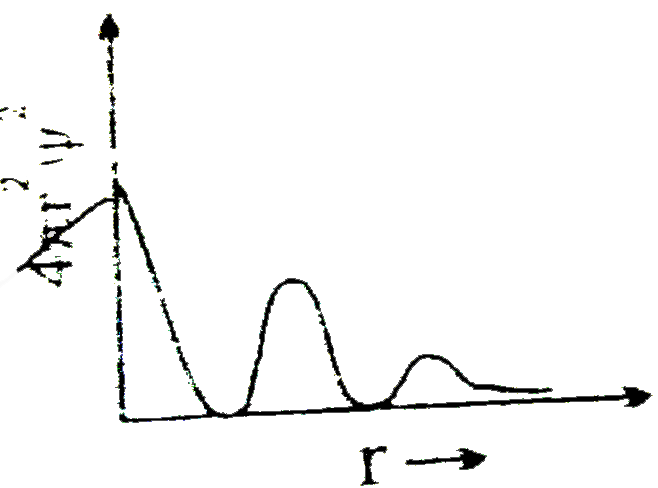 D
D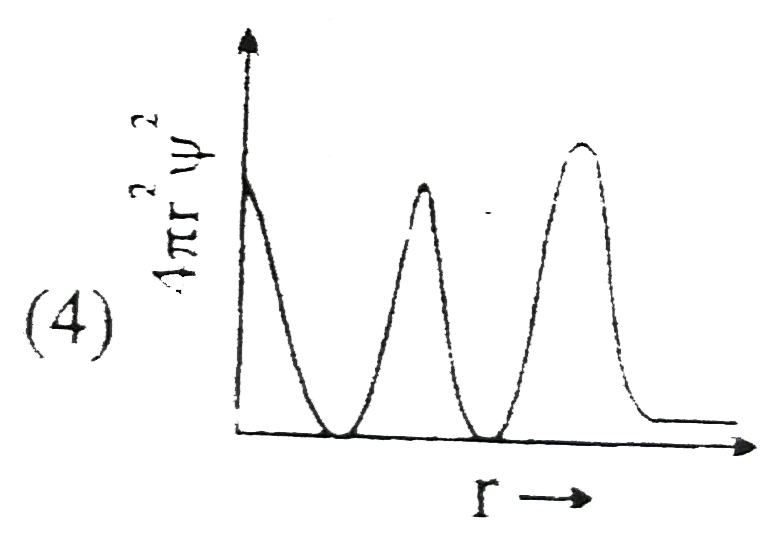
Which of the following graph represents e−x?
A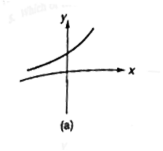 B
B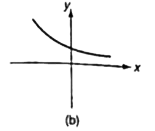 C
C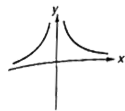 D
D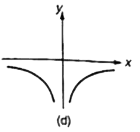
Which of the following graphs represent the behaviour of an ideal gas ?
View SolutionWhich of the following represents correctly the truth table of configuration of gates shown here
_E01_429_Q01.png)
View SolutionWhich of the following represents the graph of e−x2:
View SolutionWhich of the following graph represents Boyle's law ?
View SolutionWhich of the following graph represent Boyle's law ?
View Solution

