The pie-chart represents the profits earned by a certain company in seven consecutive years. Study the pie-chart carefully and answer the question.
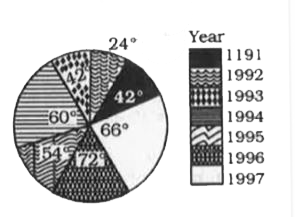
If x% of the total of profits earned in all the given years is same as the profits earned in the year 1994, then x is
1623
3313
1212
1123
The correct Answer is:A
Step by step video & image solution for The pie-chart represents the profits earned by a certain company in seven consecutive years. Study the pie-chart carefully and answer the question. If x% of the total of profits earned in all the given years is same as the profits earned in the year 1994, then x is by Maths experts to help you in doubts & scoring excellent marks in Class 14 exams.
Updated on:21/07/2023Similar Questions
The pie-chart represents the profits earned by a certain company in seven consecutive years. Study the pie-chart carefully and answer the question.
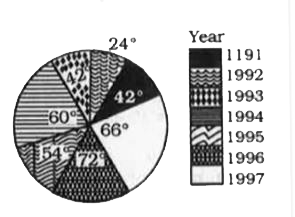
The year in which the profit is nearest to the average of the profits earned in all the given years is
View SolutionThe pie-chart represents the profits earned by a certain company in seven consecutive years. Study the pie-chart carefully and answer the question.
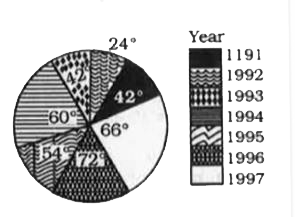
If the expenditure in the year 1993 was 30% more than the expenditure in the year 1991, then the income in the year 1993 exceeds the income in the year 1991 by 30% of
View Solution
Knowledge Check
Study the following graph carefully and answer the questions that follow
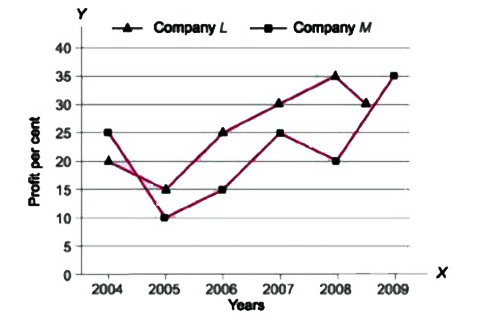
If the profit earned by company L in the year 2005 was ? 1.84 lak , what was the profit earned by the company in the year 2006 ?A? 2.12 lakhB? 2.3 lakhC? 2.04 lakhDCannot be determinedThe following graph represents the annual percentage profit earned by a company during the pe.riod 1996 - 2001. Study the graph carefully and answer the questions that follow .
The profit earned by the company is maximum in the year:A1999B2001C1996D2000Study the following graph carefully and answer the questions that follow
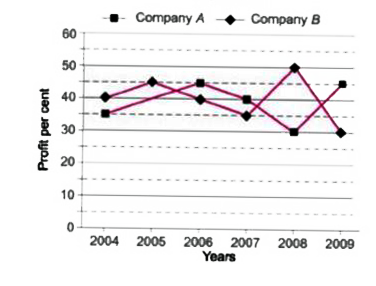
If the amount of profit earned by company A in the year 2007 was ? 1.5 lakh , what was its expenditure in that year ?A? 1.96 lakhBf 2.64 lakhC? 1.27 lakhD? 375lakh
The pie-chart represents the profits earned by a certain company in seven consecutive years. Study the pie-chart carefully and answer the question.
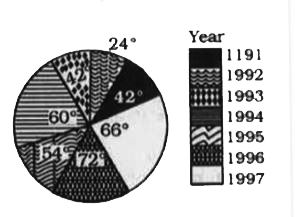
If the income in the year 1997 was 5 times the expenditure made in the same year, then the ratio of the profit earned in the year 1991 to the expenditure in the year 1997 was
View SolutionThe following graph given the annual percent profit earned by a comppany during the period 1996-2001. Study the graph carefully and answer the questions that follow.
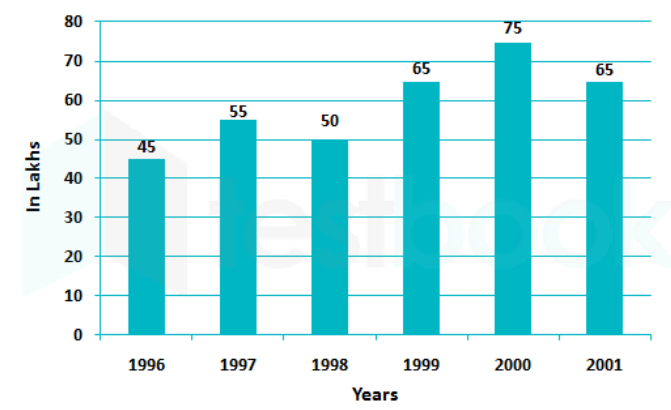
The perofit earned by the company is maximum is the year :
View SolutionStudy the following graph carefully and answer the questions that follow
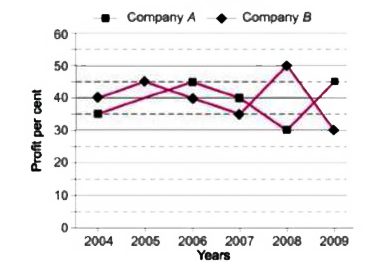
What is the respective ratio of the amount of profit earned by companies A and B in the year 2009 ?
View SolutionStudy the following graph carefully to answer the question that follow
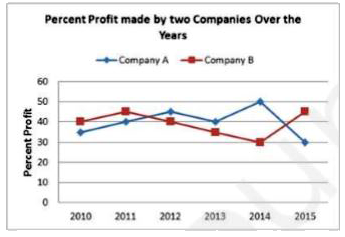
If the amount of profit earned by company A in the year 2013 was Rs. 2.5 lakh. What was its expenditure in that year ?
View SolutionThe pie chart given here shows the spendings of a country on various sports during a particular year. Study the chart carefully and answer the questions given below:
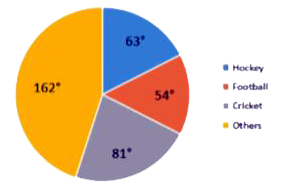
What percent of the total spendings is spent on others?
View Solution
