The pie-chart represents the profits earned by a certain company in seven consecutive years. Study the pie-chart carefully and answer the question.
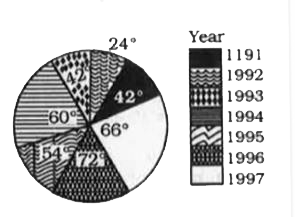
If the expenditure in the year 1993 was 30% more than the expenditure in the year 1991, then the income in the year 1993 exceeds the income in the year 1991 by 30% of
(1) the income in the year 1991
(2) the expenditure in the year 1993
(3) the income in the year 1993
(4) the expenditure in the year 1991
The correct Answer is:D
Step by step video & image solution for The pie-chart represents the profits earned by a certain company in seven consecutive years. Study the pie-chart carefully and answer the question. If the expenditure in the year 1993 was 30% more than the expenditure in the year 1991, then the income in the year 1993 exceeds the income in the year 1991 by 30% of by Maths experts to help you in doubts & scoring excellent marks in Class 14 exams.
Updated on:21/07/2023Similar Questions
The pie-chart represents the profits earned by a certain company in seven consecutive years. Study the pie-chart carefully and answer the question.
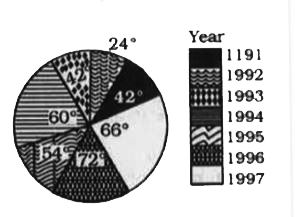
If the income in the year 1997 was 5 times the expenditure made in the same year, then the ratio of the profit earned in the year 1991 to the expenditure in the year 1997 was
View SolutionThe pie-chart represents the profits earned by a certain company in seven consecutive years. Study the pie-chart carefully and answer the question.
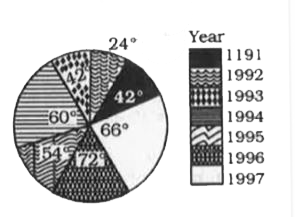
If x% of the total of profits earned in all the given years is same as the profits earned in the year 1994, then x is
View Solution
Knowledge Check
The pie chart shows the break up of expenditure of a trading company for the year 2017. Study the diagram and answer th following questions.
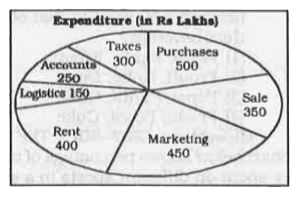
What is the total expenditure (in Rs. lakhs) ?A2200B2400C2100D2000The pie chart shows the breakup of expenditure of a manufacturing company for the year 2017. Study the diagram and answer the following questions.
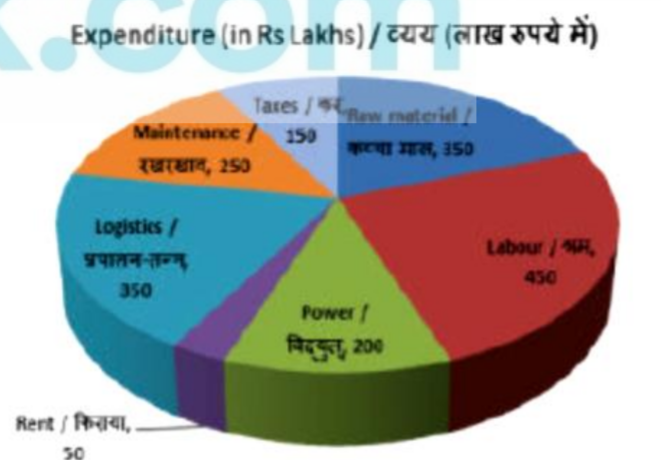
What is the total expenditure (in Rs lakhs)?A900B1800C2000D1000The pie chart shows the breakup of expenditure of a software company for the year 2017. Study the diagram and answer the following questions.
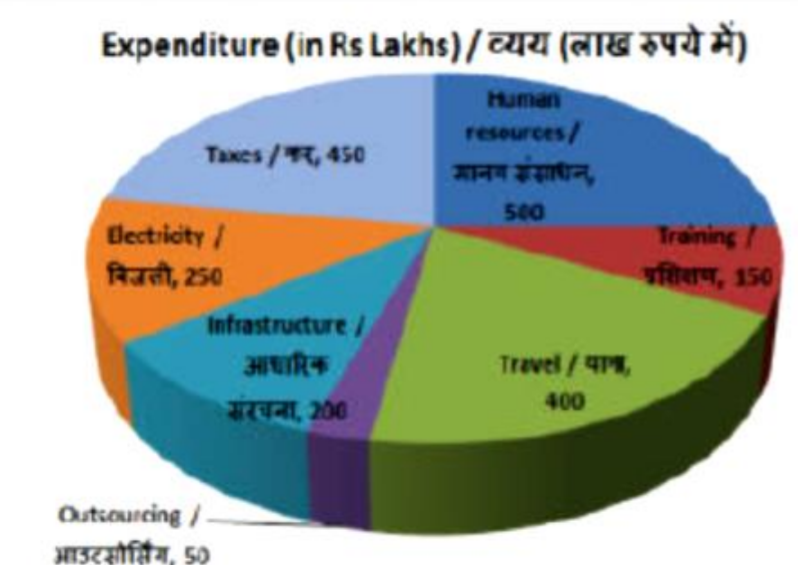
What is the total expenditure (in Rs lakhs)?A2000B1800C2250D2100
The pie-chart represents the profits earned by a certain company in seven consecutive years. Study the pie-chart carefully and answer the question.
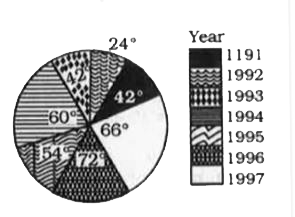
The year in which the profit is nearest to the average of the profits earned in all the given years is
View SolutionThe following graph given the annual percent profit earned by a company during the period 1996-2001. Study the graph carefully and answer the questions that follow.
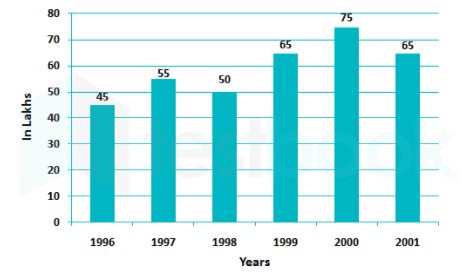
The expenditure of the company during the year 1996 was 30 crores. The income of the company in that year was (in crores ):
View SolutionThe pie chart shows the breakup of expenditure of a mining company for the year 2017. Study the diagram and answer the following questions.
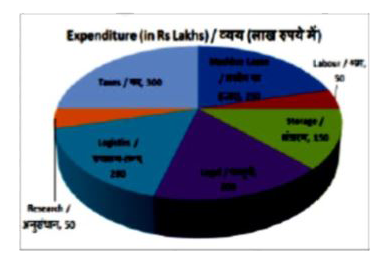
What is the total expenditure (in Rs lakhs)?
View SolutionThe pie chart shows the breakup of expendoture of a manufacturing company for the year 2017. Study the diagram and answer the following questions.
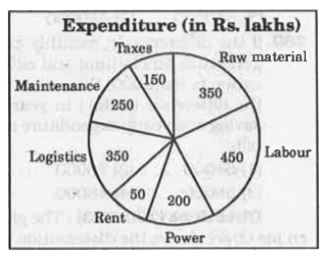
What is the total expenditure (in Rs. lakhs)?
View SolutionThe pie chart shows the breakup of expendoture of a software company for the year 2017. Study the diagram and answer the following questions.
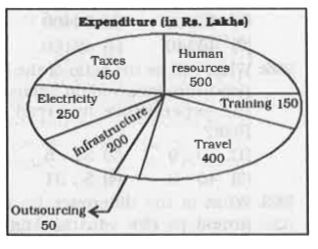
What is the total expenditure (in Rs. lakhs)?
View Solution
