A type of graph in which a circle is divided into sectors such that each sector represents a proption of the whole is a
Line graph
Stem and leaf chart
Bar graph
Pie chart
The correct Answer is:D
To solve the question, we need to identify the type of graph that is described. The question states:
"A type of graph in which a circle is divided into sectors such that each sector represents a portion of the whole is a..."
1. Understanding the Question: The question is asking for the name of a specific type of graph that uses a circle divided into sectors.
Hint: Think about graphs that represent parts of a whole.
2. Identifying the Characteristics: The key characteristics mentioned are:
- A circle is divided into sectors.
- Each sector represents a portion of the whole.
Hint: Consider how data can be visually represented in a circular format.
3. Recalling Graph Types: Common types of graphs include bar graphs, line graphs, and pie charts.
Hint: Focus on the circular representation of data.
4. Matching the Description: The description fits perfectly with a pie chart, as a pie chart is specifically designed to show proportions of a whole using sectors of a circle.
Hint: Recall that a pie chart is often used to display percentages or fractions of a total.
5. Selecting the Answer: Based on the identification, the answer to the question is "pie chart."
Hint: Look for the option that corresponds to "pie chart" in the provided choices.
Final Answer:
The type of graph in which a circle is divided into sectors such that each sector represents a portion of the whole is a pie chart.
Options:
- Option A: (Not applicable)
- Option B: (Not applicable)
- Option C: (Not applicable)
- Option D: Pie Chart (Correct Answer)
- A circle is divided into sectors.
- Each sector represents a portion of the whole.
The type of graph in which a circle is divided into sectors such that each sector represents a portion of the whole is a pie chart.
- Option A: (Not applicable)
- Option B: (Not applicable)
- Option C: (Not applicable)
- Option D: Pie Chart (Correct Answer)
Similar Questions
If the pair of lines ax2+2(a+b)xy+by2=0 lie along diameters of a circle and divide the circle into four sectors such that the area of one of the sectors is thrice the area of another sector then
View SolutionA circle is completely divided into to n sectors in such a way that the angles of the sectors are inAP. If the smallest of these angles is 8∘and the largest is 72∘, calculate n and the angle in the fifth sector.
View Solution
Knowledge Check
If the pair of lines ax2+2(a+b)xy+by2=0 lie along diameters of a circle and divide the circle into four section such that the area of one of the sector is thrice theara of another sector then
A3a2−10ab+3b2=0B3a2−2ab+3b2=0C3a2+10ab+3b2=0D3a2+2ab+3b2=0Which sector is not the sector of economy?
APrimaryBSecondaryCTertiaryDFourthA circle with 7cm is segmented into six equal triangular areas as shown in figure. What will the area of the portion be?
Aa. 3a2(π+√3)Bb. 3√3a2Cc. 3(a2√3+π)Dd. 3√3πa22
Draw any circle and mark
a sector
View SolutionPie-diagram or a pie-chart is a poctirial representation of the numerical data by non-intersecting adjacent sectors of the circle such that area of sector is proportional to the magnitude of the data represented by the sector.
View SolutionA circle of radius 'a' is divided into 6 equal sectors. An equilateral triangle is drawn on the chord of each sector to lie outside the circle. Area of the resulting figure is :
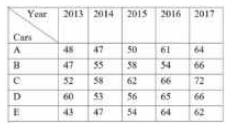
View SolutionThe table shows the production of different types of cars (in thousands).
यह तालिका एक कंपनी द्वारा 5 वर्षों में अलग-अलग कारों के उत्पादन (हज़ार में ) को दर्शाती है | If the data related to the production of type D cars is represented by a pie chart, then the central angle of the sector representing the production of
cars in 2013 will be:
यदि D प्रकार की कारों के उत्पादन से संबंधित आंकड़ों को एक पाई-चार्ट में प्रस्तुत किया जाए, तो 2013 में कारों के उत्पादन को दर्शाने वाले खंड का केंद्रीय कोण होगा :
View SolutionThe table shows the production of different types of cars (in thousands).

If the data related to the production of type D cars is represented by a pie chart, then the central angle of the sector representing the production of cars in 2016 will be:
View Solution