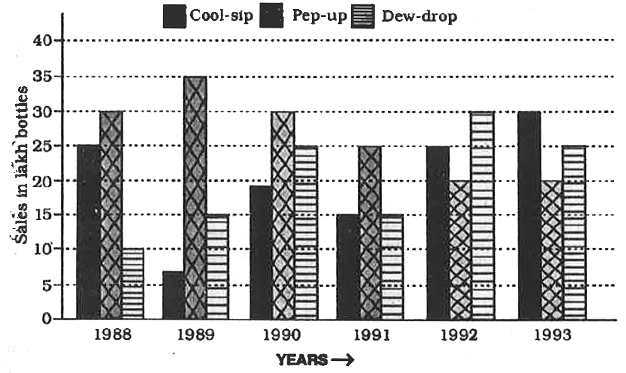
Study the graph and answer the questions.
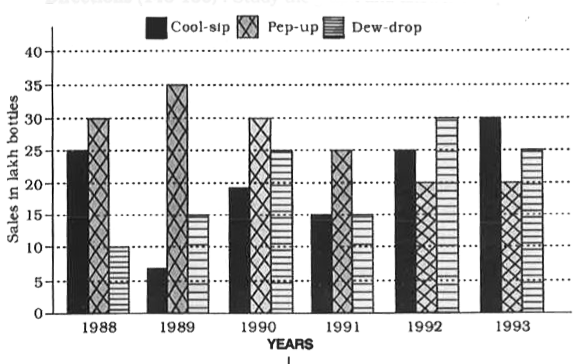
In case of which soft drink was the average annual sale minimum during the period 1988- 1993 ?
Pre-up only
Cool-sip only
Dew-drop only
Dew-drop and Cood-sip
The correct Answer is:D
Step by step video & image solution for Study the graph and answer the questions. In case of which soft drink was the average annual sale minimum during the period 1988- 1993 ? by Maths experts to help you in doubts & scoring excellent marks in Class 14 exams.
Updated on:21/07/2023Similar Questions
Study the graph and answer the questions.
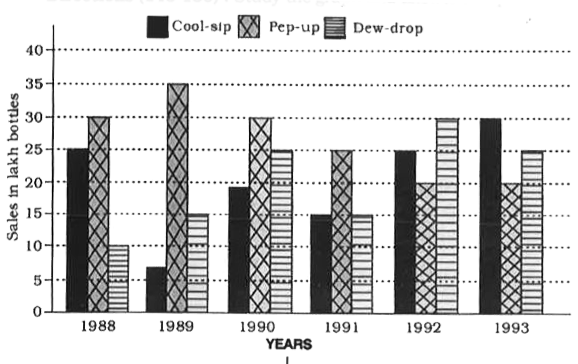
In case of which soft drink was the average annual sale maximum during the period 1988 - 1993 ?
View SolutionStudy the graph and answer the questions.
ग्राफ का अध्ययन कीजिए और दिये गये प्रश्नों के उत्तर दीजिए:
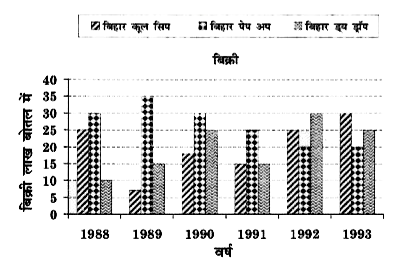
In case of which soft drink was the average annual sale minimum during the period 1988-1993 ?
किस सॉफ्ट ड्रिंक के मामले में 1988-1993 की अवधि में औसत वार्षिक बिक्री सबसे कम रही?
View Solution
Knowledge Check
Study the graph and answer the questions.
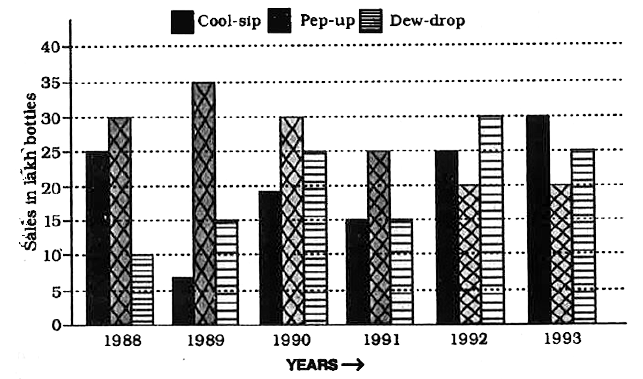
In case of which soft drink was the average annual sale maximum during the period 1988-1993 ?APep-up onlyBPep-up and Dew dropCCool-sip onlyDCool-sip and Pep-upStudy the graph and answer the questions.
In which year sale of Drew-drop is maximum ?A1998B1992C1989D1993Study the graph and answer the questions.
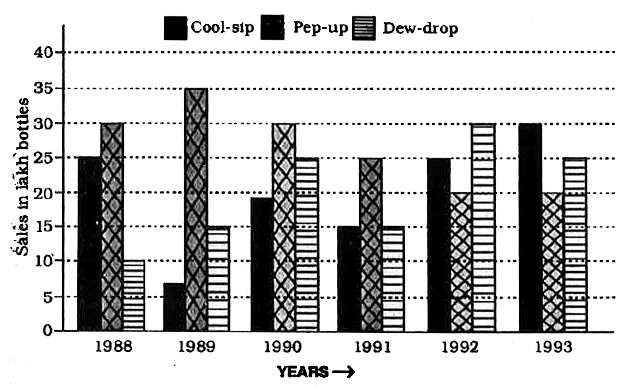
In which year the sale of cool-sip is minimum ?A1990B1992C1993DNone of the above
Study the graph and answer the questions.
ग्राफ का अध्ययन कीजिए और दिये गये प्रश्नों के उत्तर दीजिए:
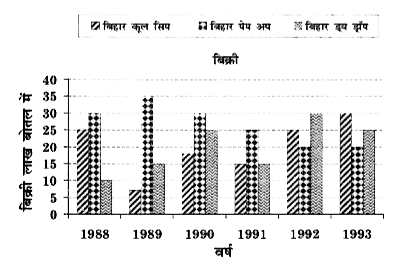
In case of which soft drink was the average annual sale maximum during the period 1988-1993 ?
किस सॉफ्ट ड्रिंक के मामले में, 1988-1993 की अवधि में औसत वार्षिक बिक्री अधिकतम थी?
View SolutionStudy the graph and answer the questions.
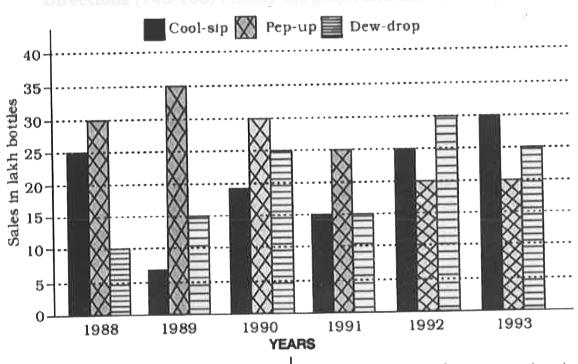
In which year sale of Dew -drop is maximum ?
View SolutionStudy the graph and answer the questions.
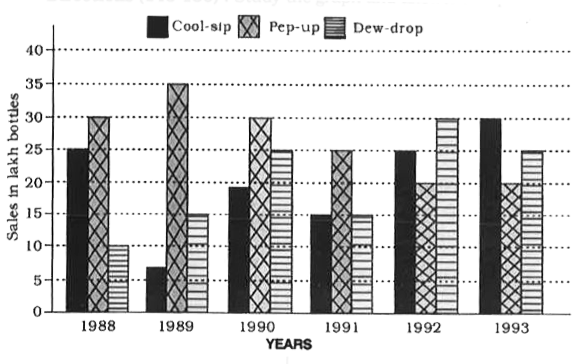
In which year the sale of coolsip is minimum?
View SolutionStudy the following graph and answer the question.
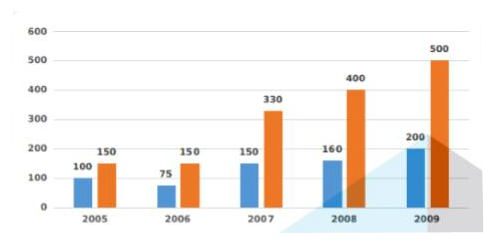
In which year was the value per tonne the minimum?
View SolutionDirections (Questions 24-28): Study the following graphs and answer the questions given below which are based on these graphs (FIGURE) Average annual exports during the given period for Company Y is approximately what percent of the average annual exports for Company Z ? (a) 87.12% (b) 89.64% (c) 91.21% (d) 93.33% (e) 95.15%
View Solution
