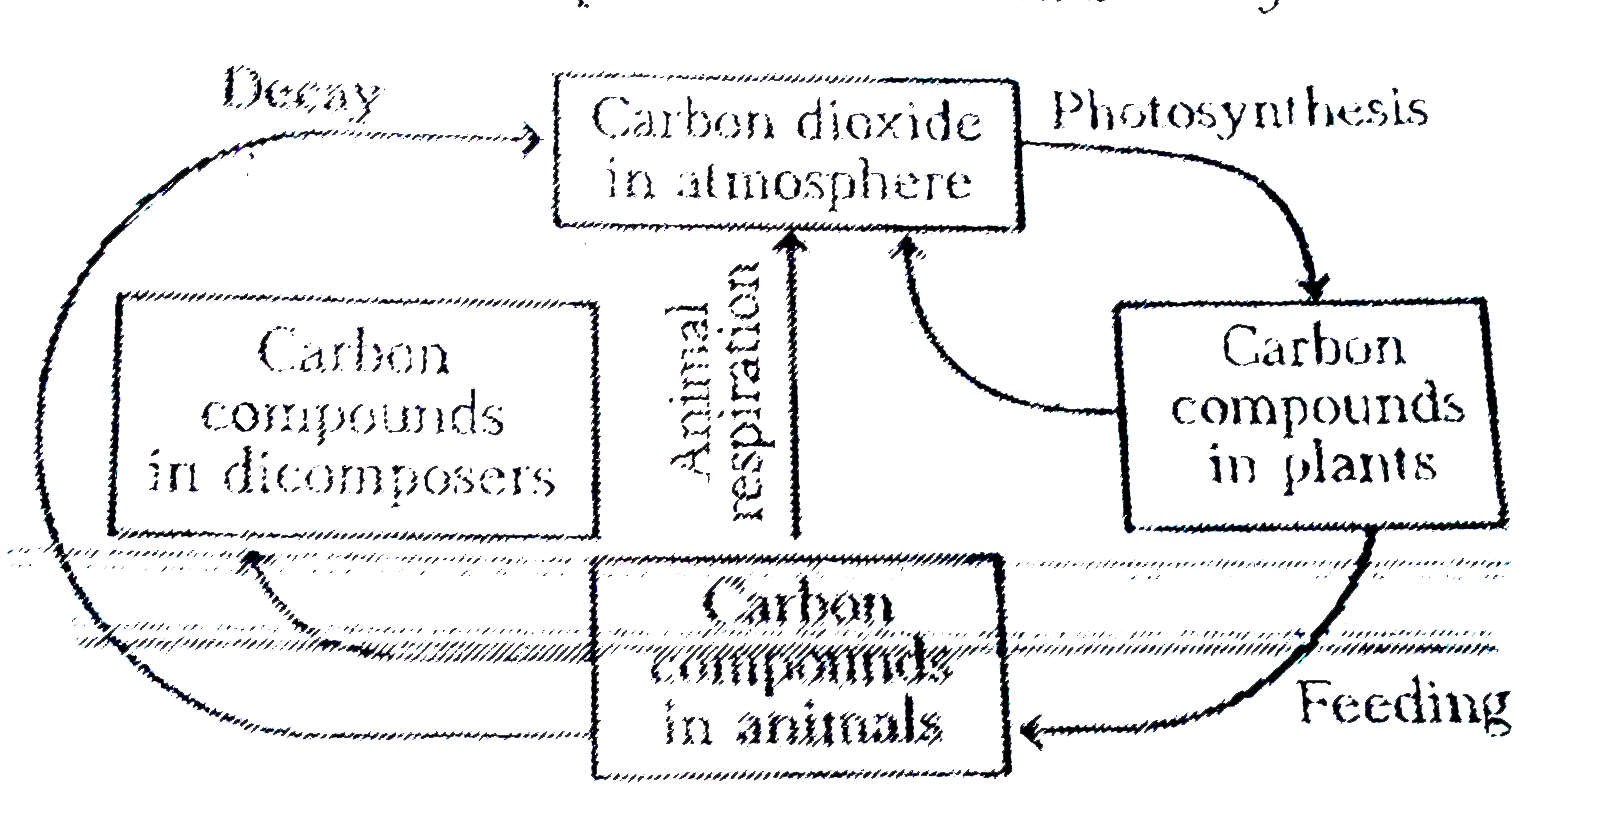
Show diagram for carbon cycle .
Text Solution
|
Topper's Solved these Questions
- LIFE ON THE EARTHBOOK - FULL MARKSCHAPTER - LIFE ON THE EARTHEXERCISE - TEST ASSIGNMENT
10 Videos
- LIFE ON THE EARTHBOOK - FULL MARKSCHAPTER - LIFE ON THE EARTHEXERCISE - ADDITIONAL QUESTIONS WITH ANSWERS (HOTS QUESTOINS)
4 Videos
- LATITUDE, LONGITUDE AND TIMEBOOK - FULL MARKSCHAPTER - LATITUDE, LONGITUDE AND TIMEEXERCISE - ADDITIONAL QUESTIONS WITH ANSWERS (VIVA QUESTIONS)
7 Videos
- MAP PROJECTIONSBOOK - FULL MARKSCHAPTER - MAP PROJECTIONSEXERCISE - ADDITIONAL QUESTIONS WITH ANSWERS (V. Viva Questions)
7 Videos
Similar Questions
Knowledge Check
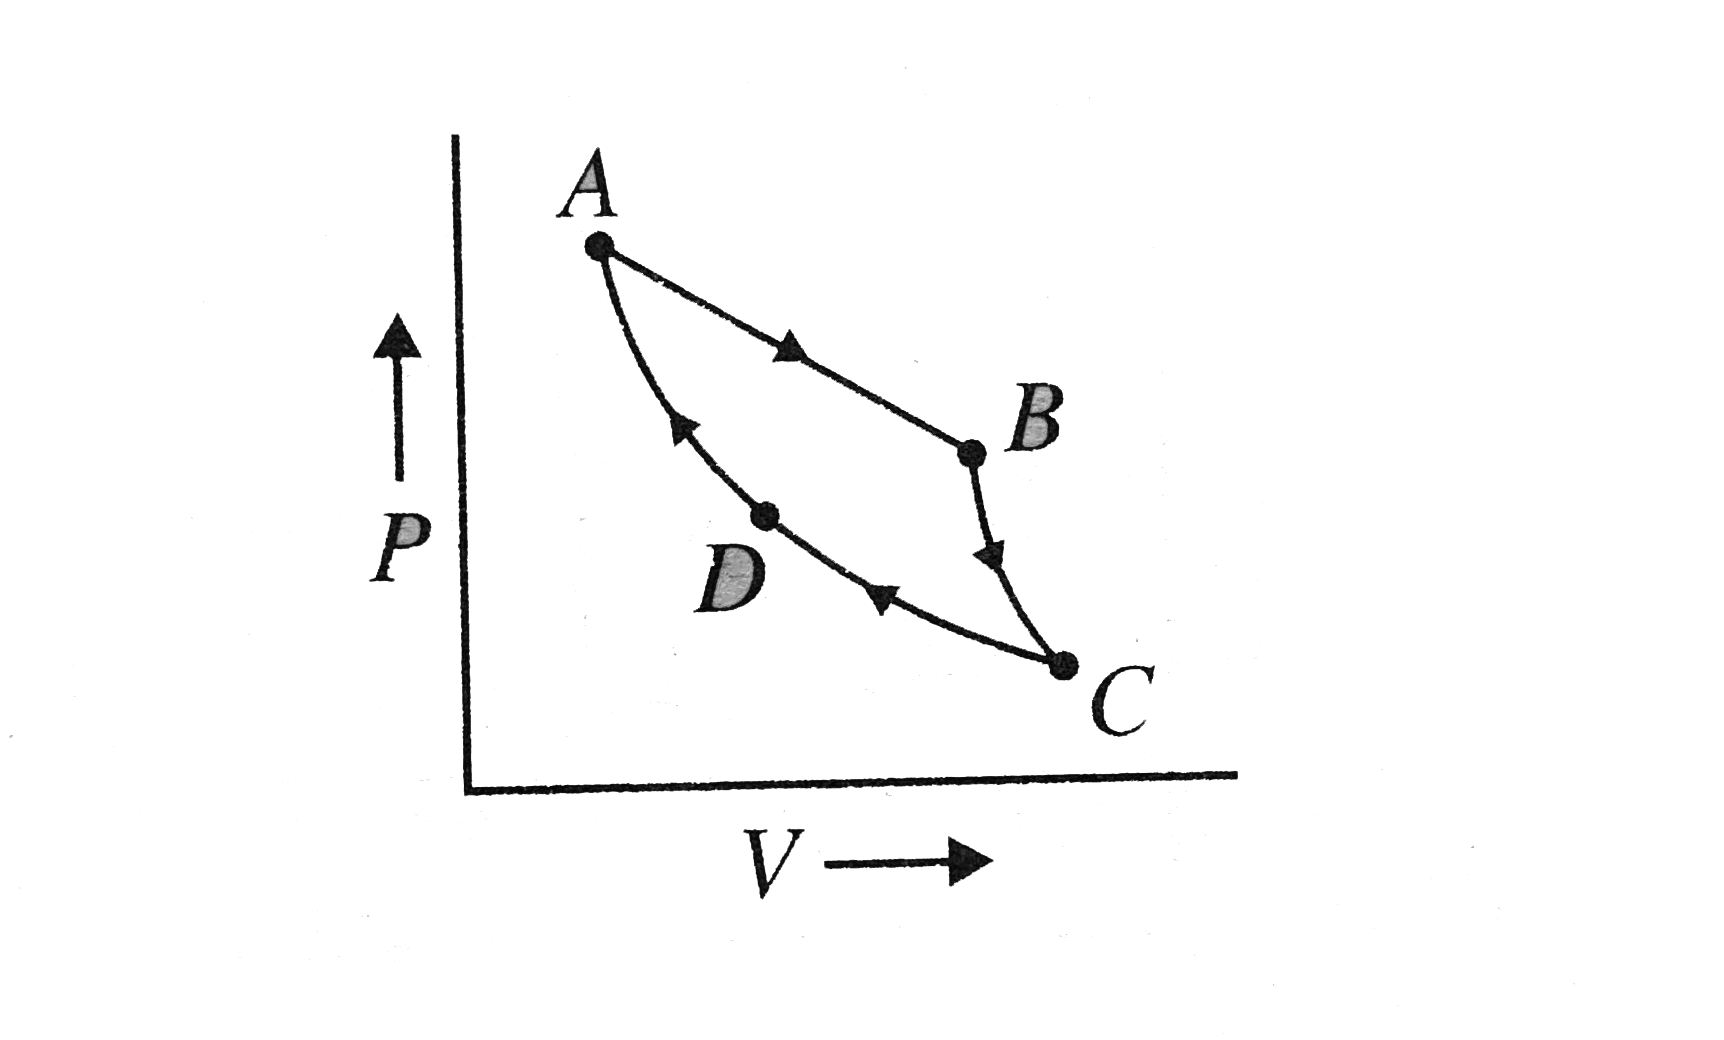
Figure. Shows the P−V diagram for a Carnot cycle. In this diagram
 Acurve AB represents isothemal process and BC adiabatic processBcurve AB represents adiabatic process and BC isothermal processCcurve CD represents isothermal process and DA adaibatic processDcurve CD represent adiabatic process and DA isothermal process
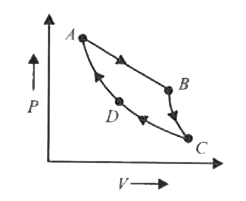
The given figure shows the P−Vdiagram for a Camot cycle. In this diagram,
 Acurve AB represents isothermal process and BC adiabatic processBcurve AB represents adiabatic process and BC isothermal processCcurve CD represents isothermal process and DA adiabatic processDcurve CD represents adiabatic process and DA isothermal process.


