Draw the graph of following function
Sin3x
To draw the graph of the function sin(3x), we can follow these steps:
Step 1: Understand the Function
The function sin(3x) is a sine function with an increased frequency due to the coefficient 3 in front of x. This means that the function will complete its cycles more quickly than the standard sine function.
Step 2: Determine the Period
The period of the sine function sin(kx) is given by the formula:
Period=2πk
For sin(3x), k=3:
Period=2π3
Step 3: Create a Table of Values
We will calculate the values of sin(3x) for key angles. We can choose values of x that are multiples of π6 to make calculations easier. Here are some values:
| x | 3x | sin(3x) |
|----------------|-----------------|------------------|
| 0 | 0 | 0 |
| π6 | π2 | 1 |
| π3 | π | 0 |
| π2 | 3π2 | −1 |
| 2π3 | 2π | 0 |
| 5π6 | 5π2 | 1 |
| π | 3π | 0 |
Step 4: Plot the Points
Using the table of values, we can plot the points on a Cartesian plane:
- (0,0)
- (π6,1)
- (π3,0)
- (π2,−1)
- (2π3,0)
- (5π6,1)
- (π,0)
Step 5: Draw the Graph
1. Start at the origin (0,0).
2. Move to (π6,1), which is the maximum point.
3. Then go down to (π3,0).
4. Continue down to (π2,−1), which is the minimum point.
5. Move back up to (2π3,0).
6. Go up to (5π6,1).
7. Finally, return to (π,0).
Repeat this pattern for the negative side of the x-axis to complete the graph.
Step 6: Label the Axes
Make sure to label the x-axis with the angles and the y-axis with the corresponding sine values, ensuring to mark the maximum and minimum points.
Final Graph
The graph of sin(3x) will oscillate between -1 and 1, completing one full cycle every 2π3 units along the x-axis.
---
The function sin(3x) is a sine function with an increased frequency due to the coefficient 3 in front of x. This means that the function will complete its cycles more quickly than the standard sine function.
The period of the sine function sin(kx) is given by the formula:
Period=2πk
For sin(3x), k=3:
Period=2π3
We will calculate the values of sin(3x) for key angles. We can choose values of x that are multiples of π6 to make calculations easier. Here are some values:
|----------------|-----------------|------------------|
| 0 | 0 | 0 |
| π6 | π2 | 1 |
| π3 | π | 0 |
| π2 | 3π2 | −1 |
| 2π3 | 2π | 0 |
| 5π6 | 5π2 | 1 |
| π | 3π | 0 |
Using the table of values, we can plot the points on a Cartesian plane:
- (0,0)
- (π6,1)
- (π3,0)
- (π2,−1)
- (2π3,0)
- (5π6,1)
- (π,0)
1. Start at the origin (0,0).
2. Move to (π6,1), which is the maximum point.
3. Then go down to (π3,0).
4. Continue down to (π2,−1), which is the minimum point.
5. Move back up to (2π3,0).
6. Go up to (5π6,1).
7. Finally, return to (π,0).
Make sure to label the x-axis with the angles and the y-axis with the corresponding sine values, ensuring to mark the maximum and minimum points.
The graph of sin(3x) will oscillate between -1 and 1, completing one full cycle every 2π3 units along the x-axis.
Topper's Solved these Questions
Similar Questions
Consider the following function f whose graph is given below.
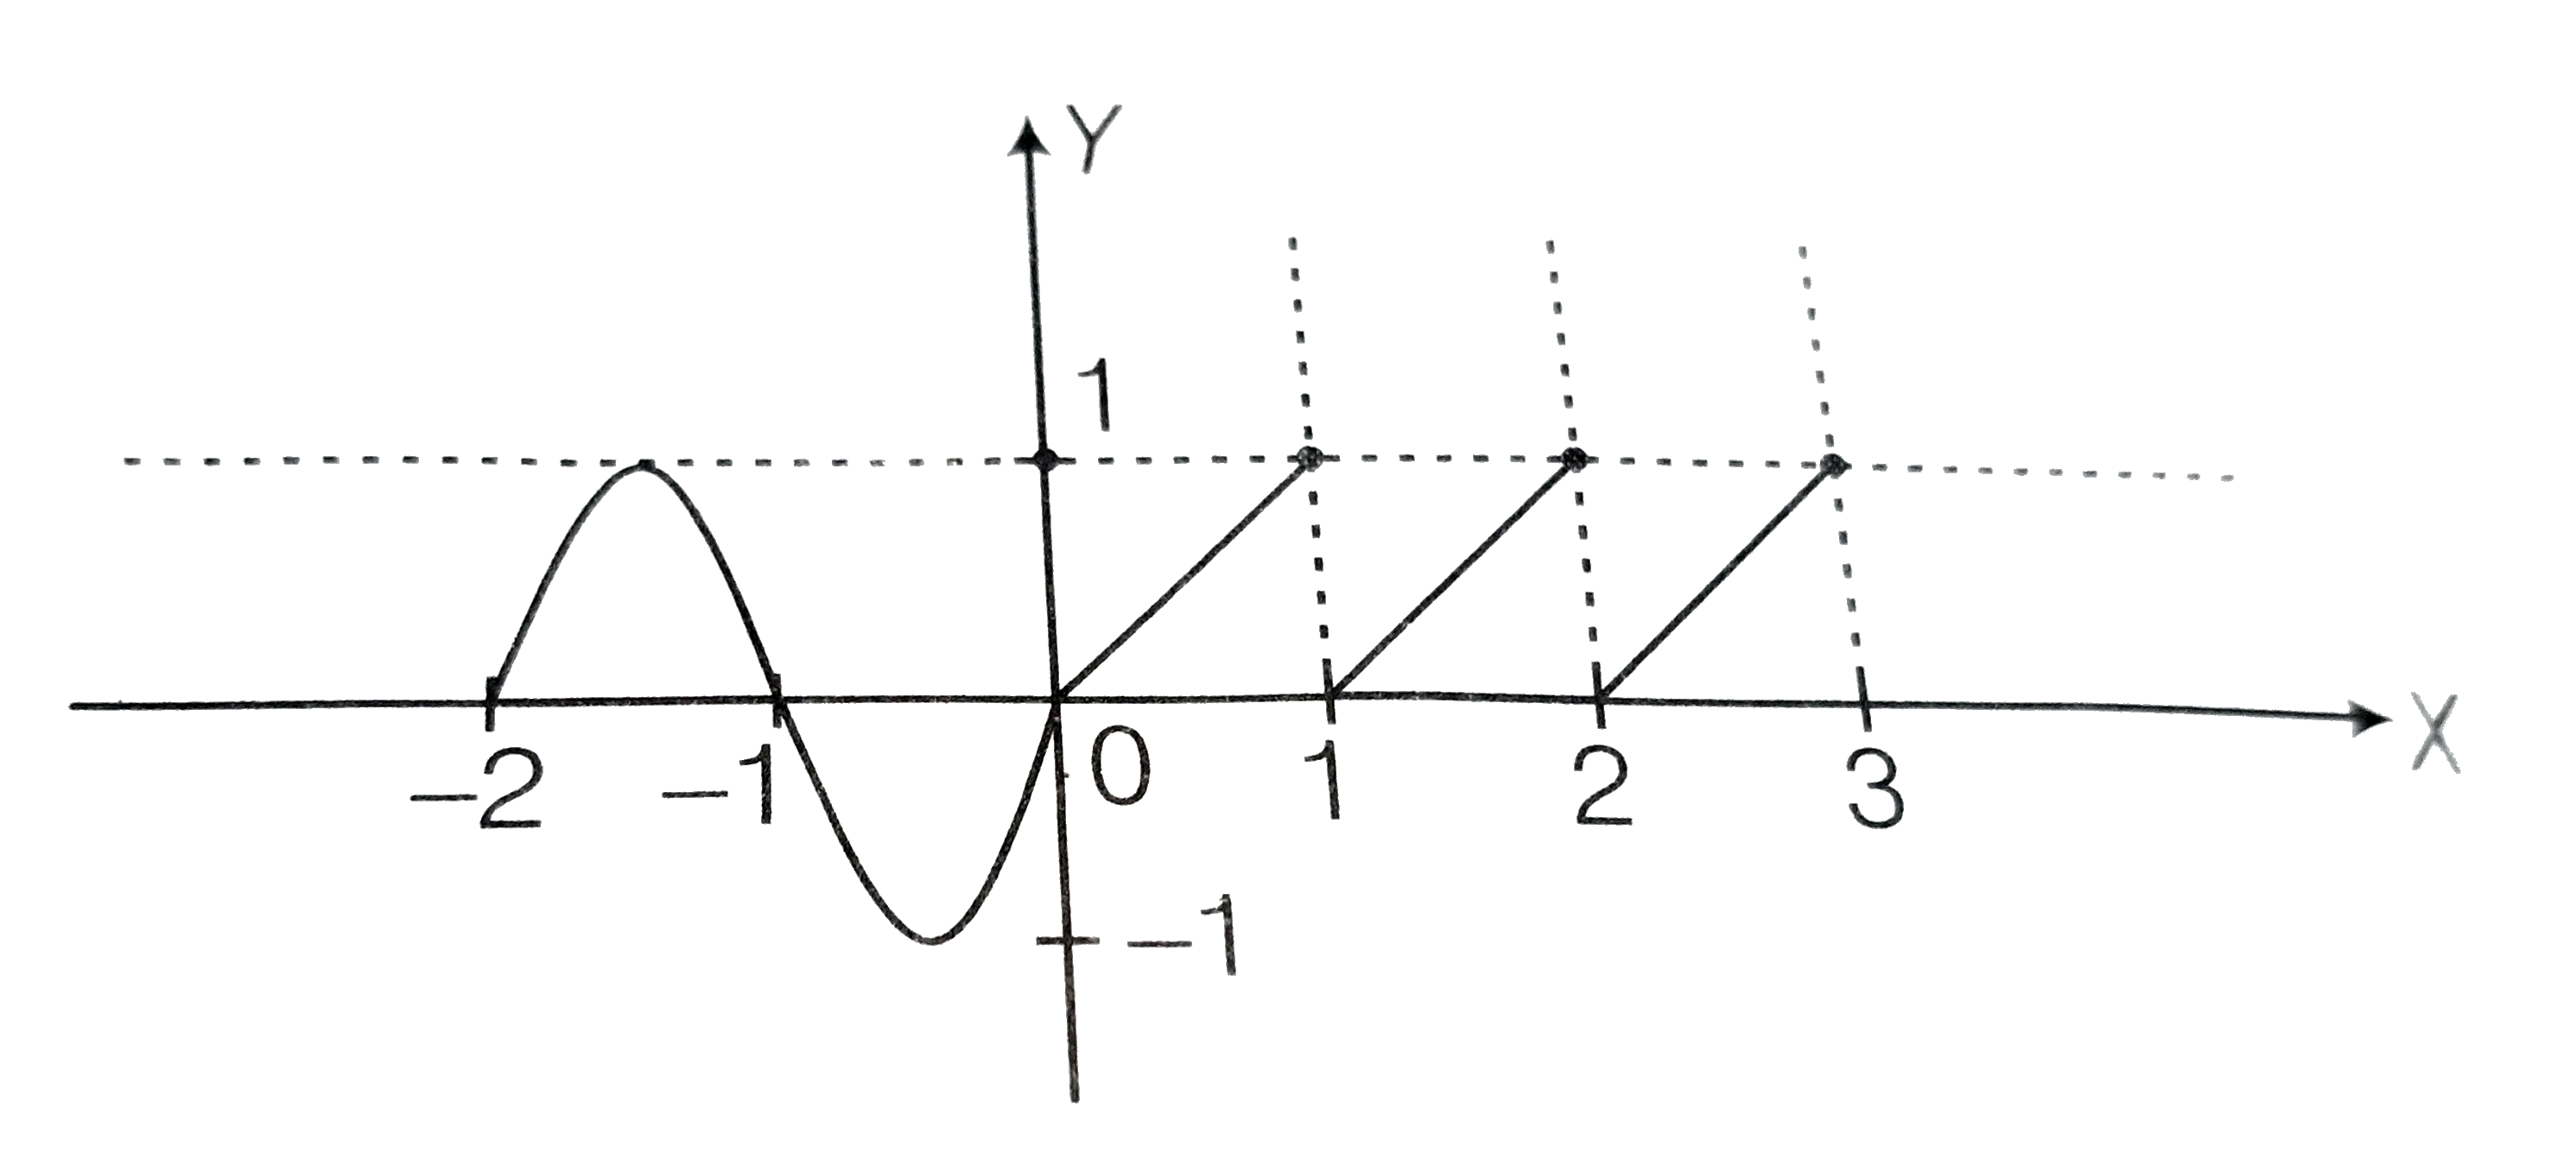
Draw the graph of following functions.
(i) [f(x)]
View SolutionDraw the graph of following function and find range (Rf) of f(x)=|x−2|+|2−x|∀−3≤x≤3
View SolutionDraw the graph of the following function: f(x)=sin−1(x+2)
View SolutionDraw the graph of the following function: h(x)=∣∣tan−1(3x)∣∣
View SolutionConsider the following function f whose graph is given below.
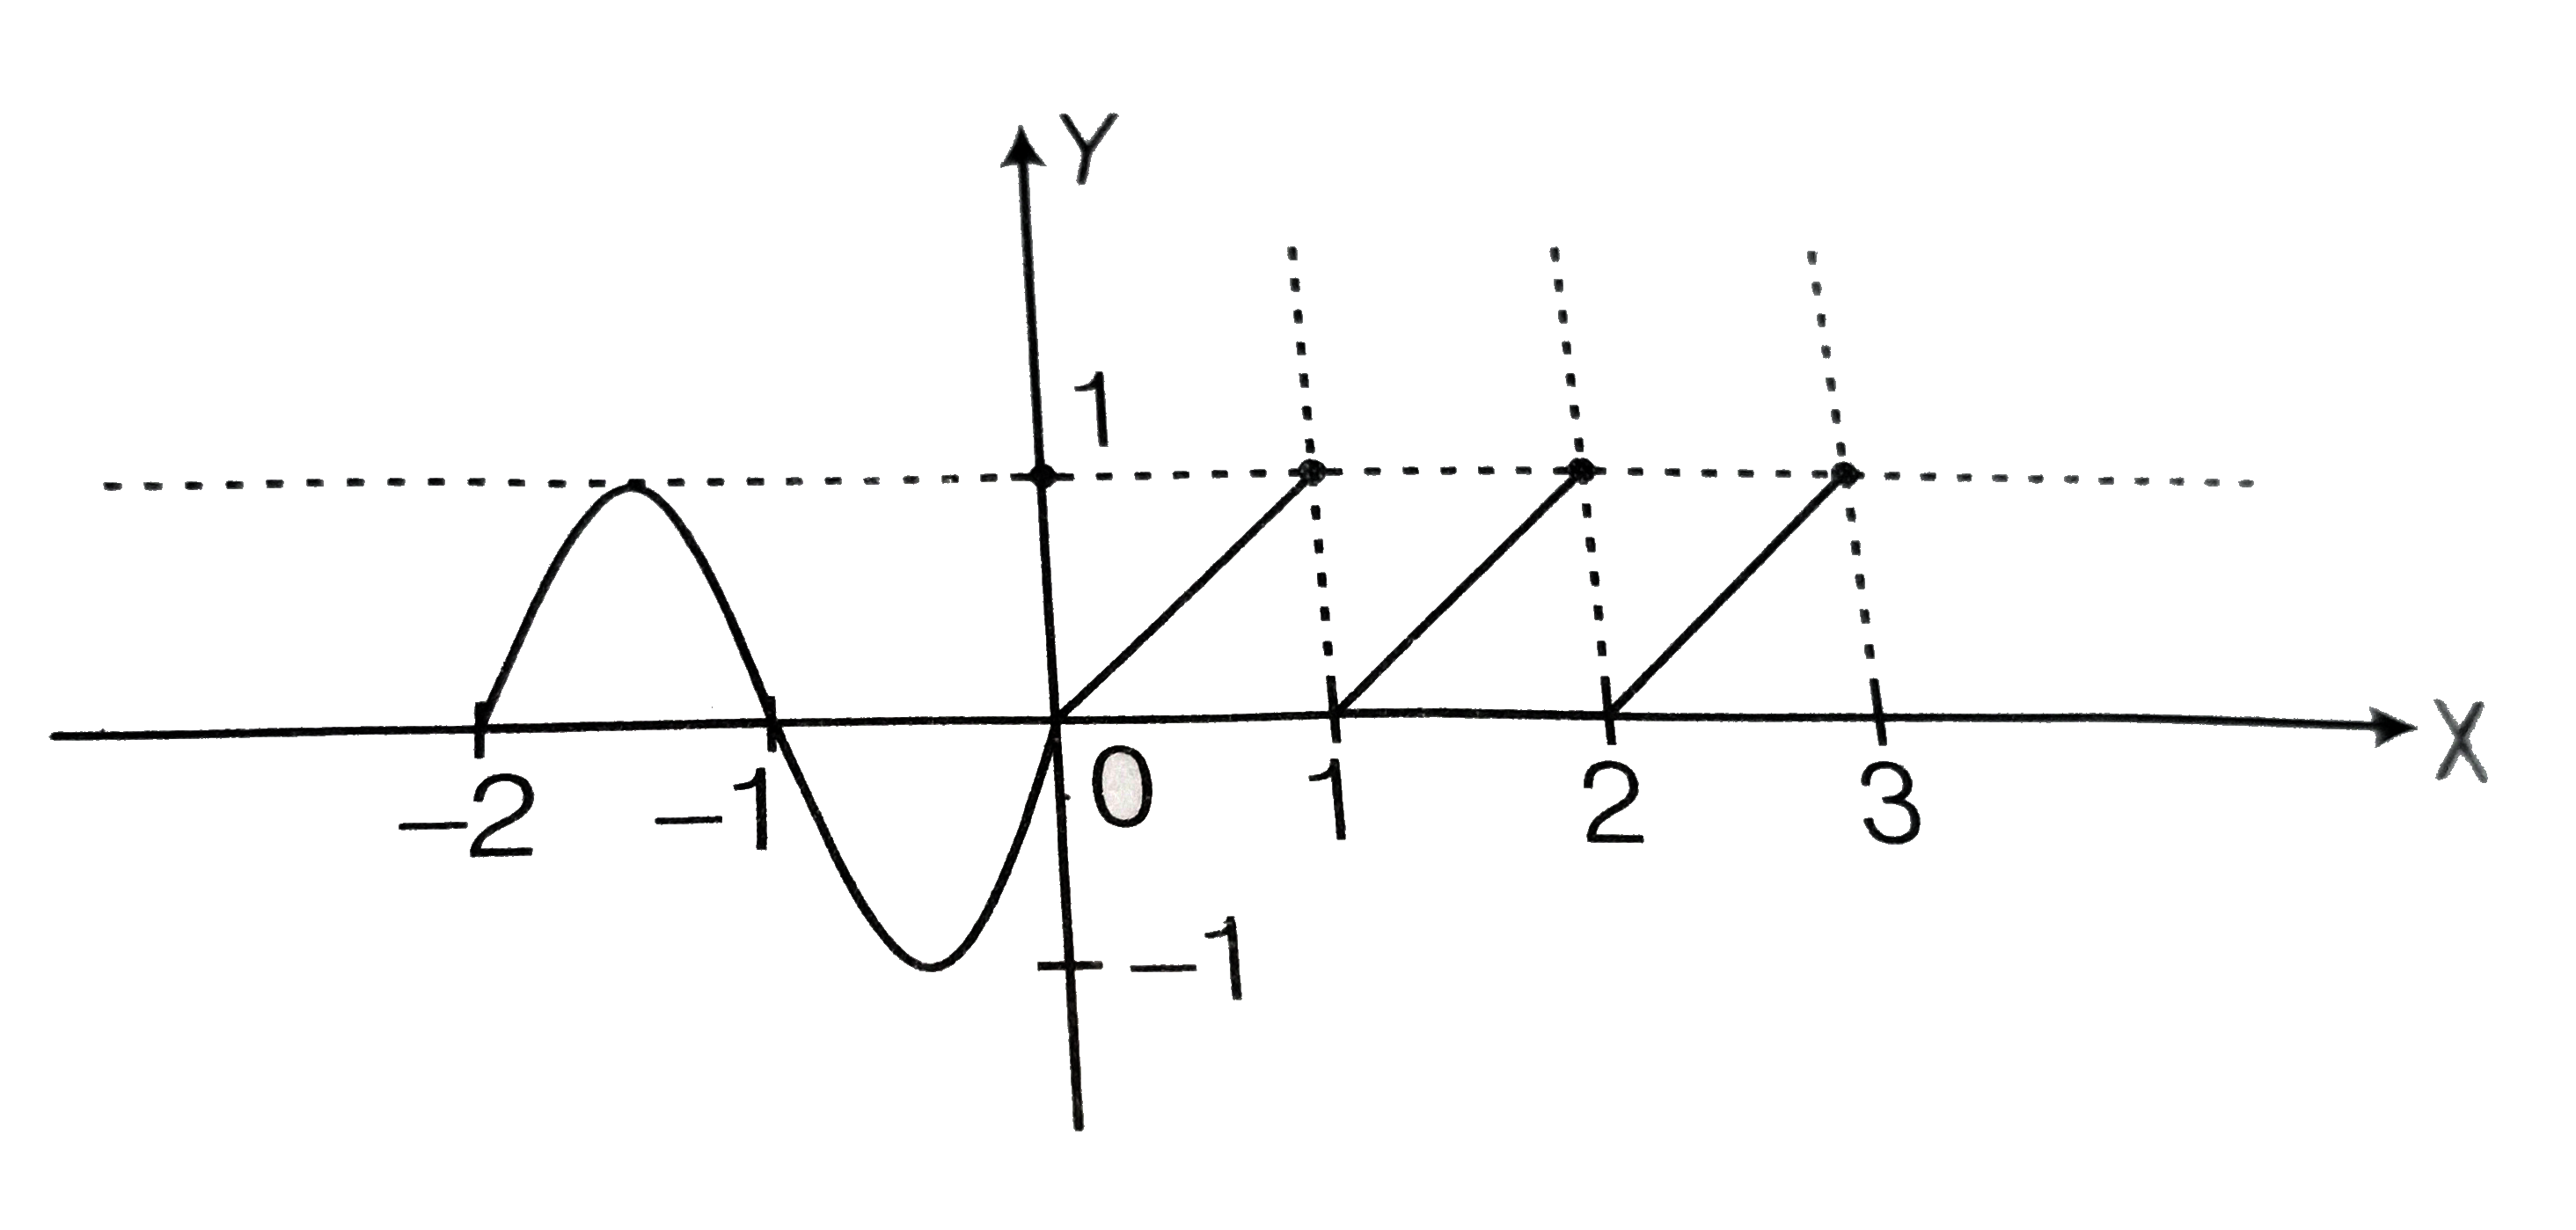
Draw the graph of following functions.
(g) f(x−[x])
View SolutionConsider the following function f whose graph is given below.
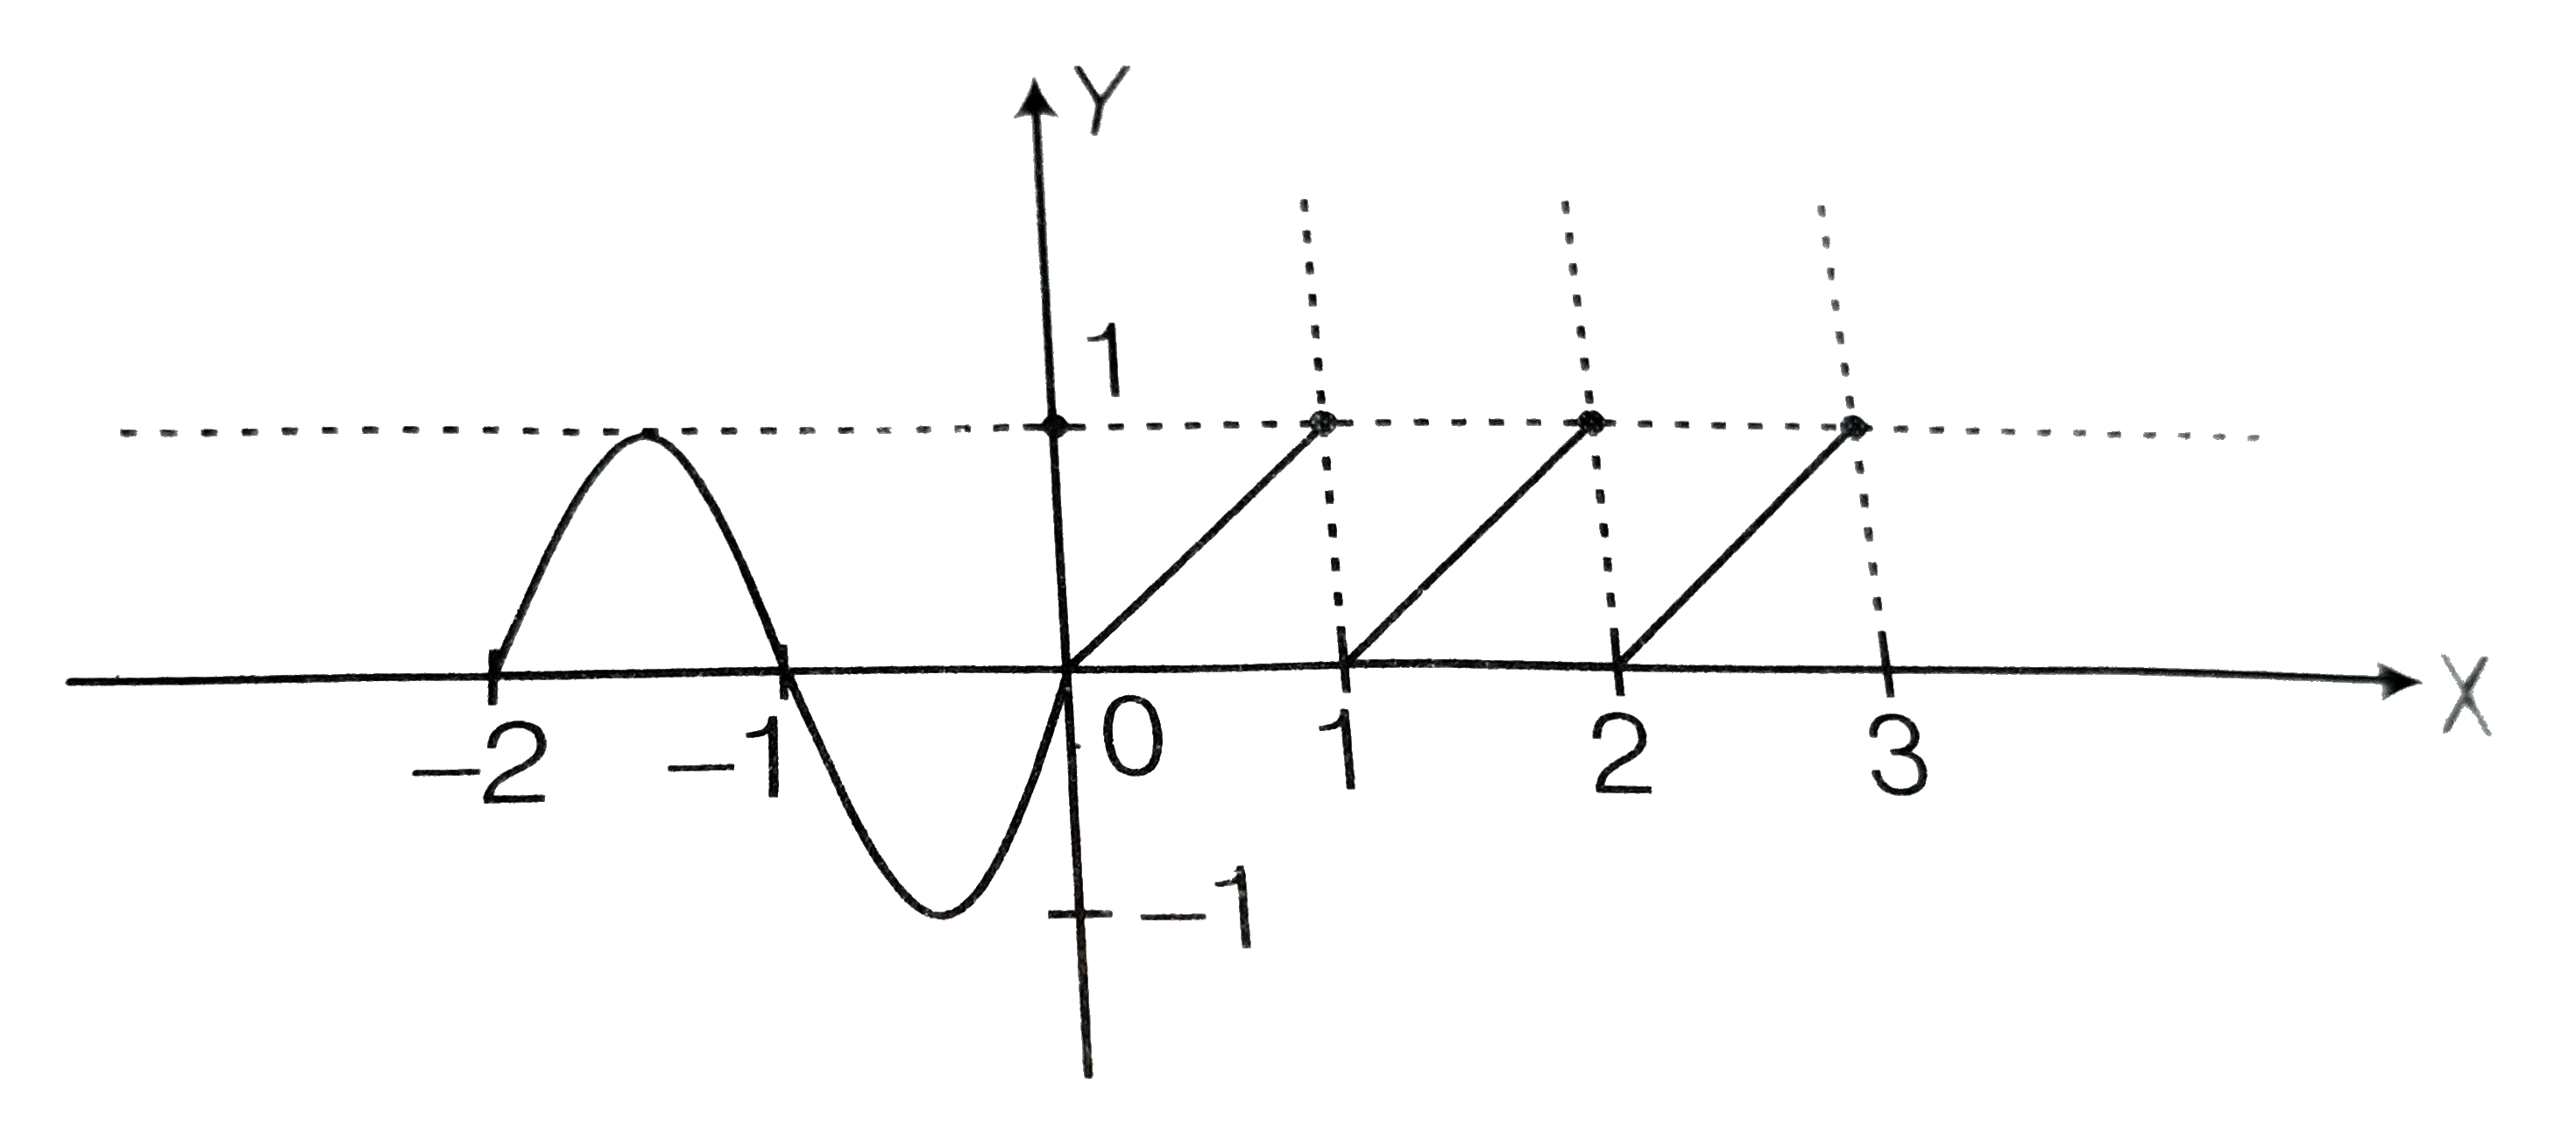
Draw the graph of following functions.
(a) f(x)+1
View SolutionConsider the following function f whose graph is given below.
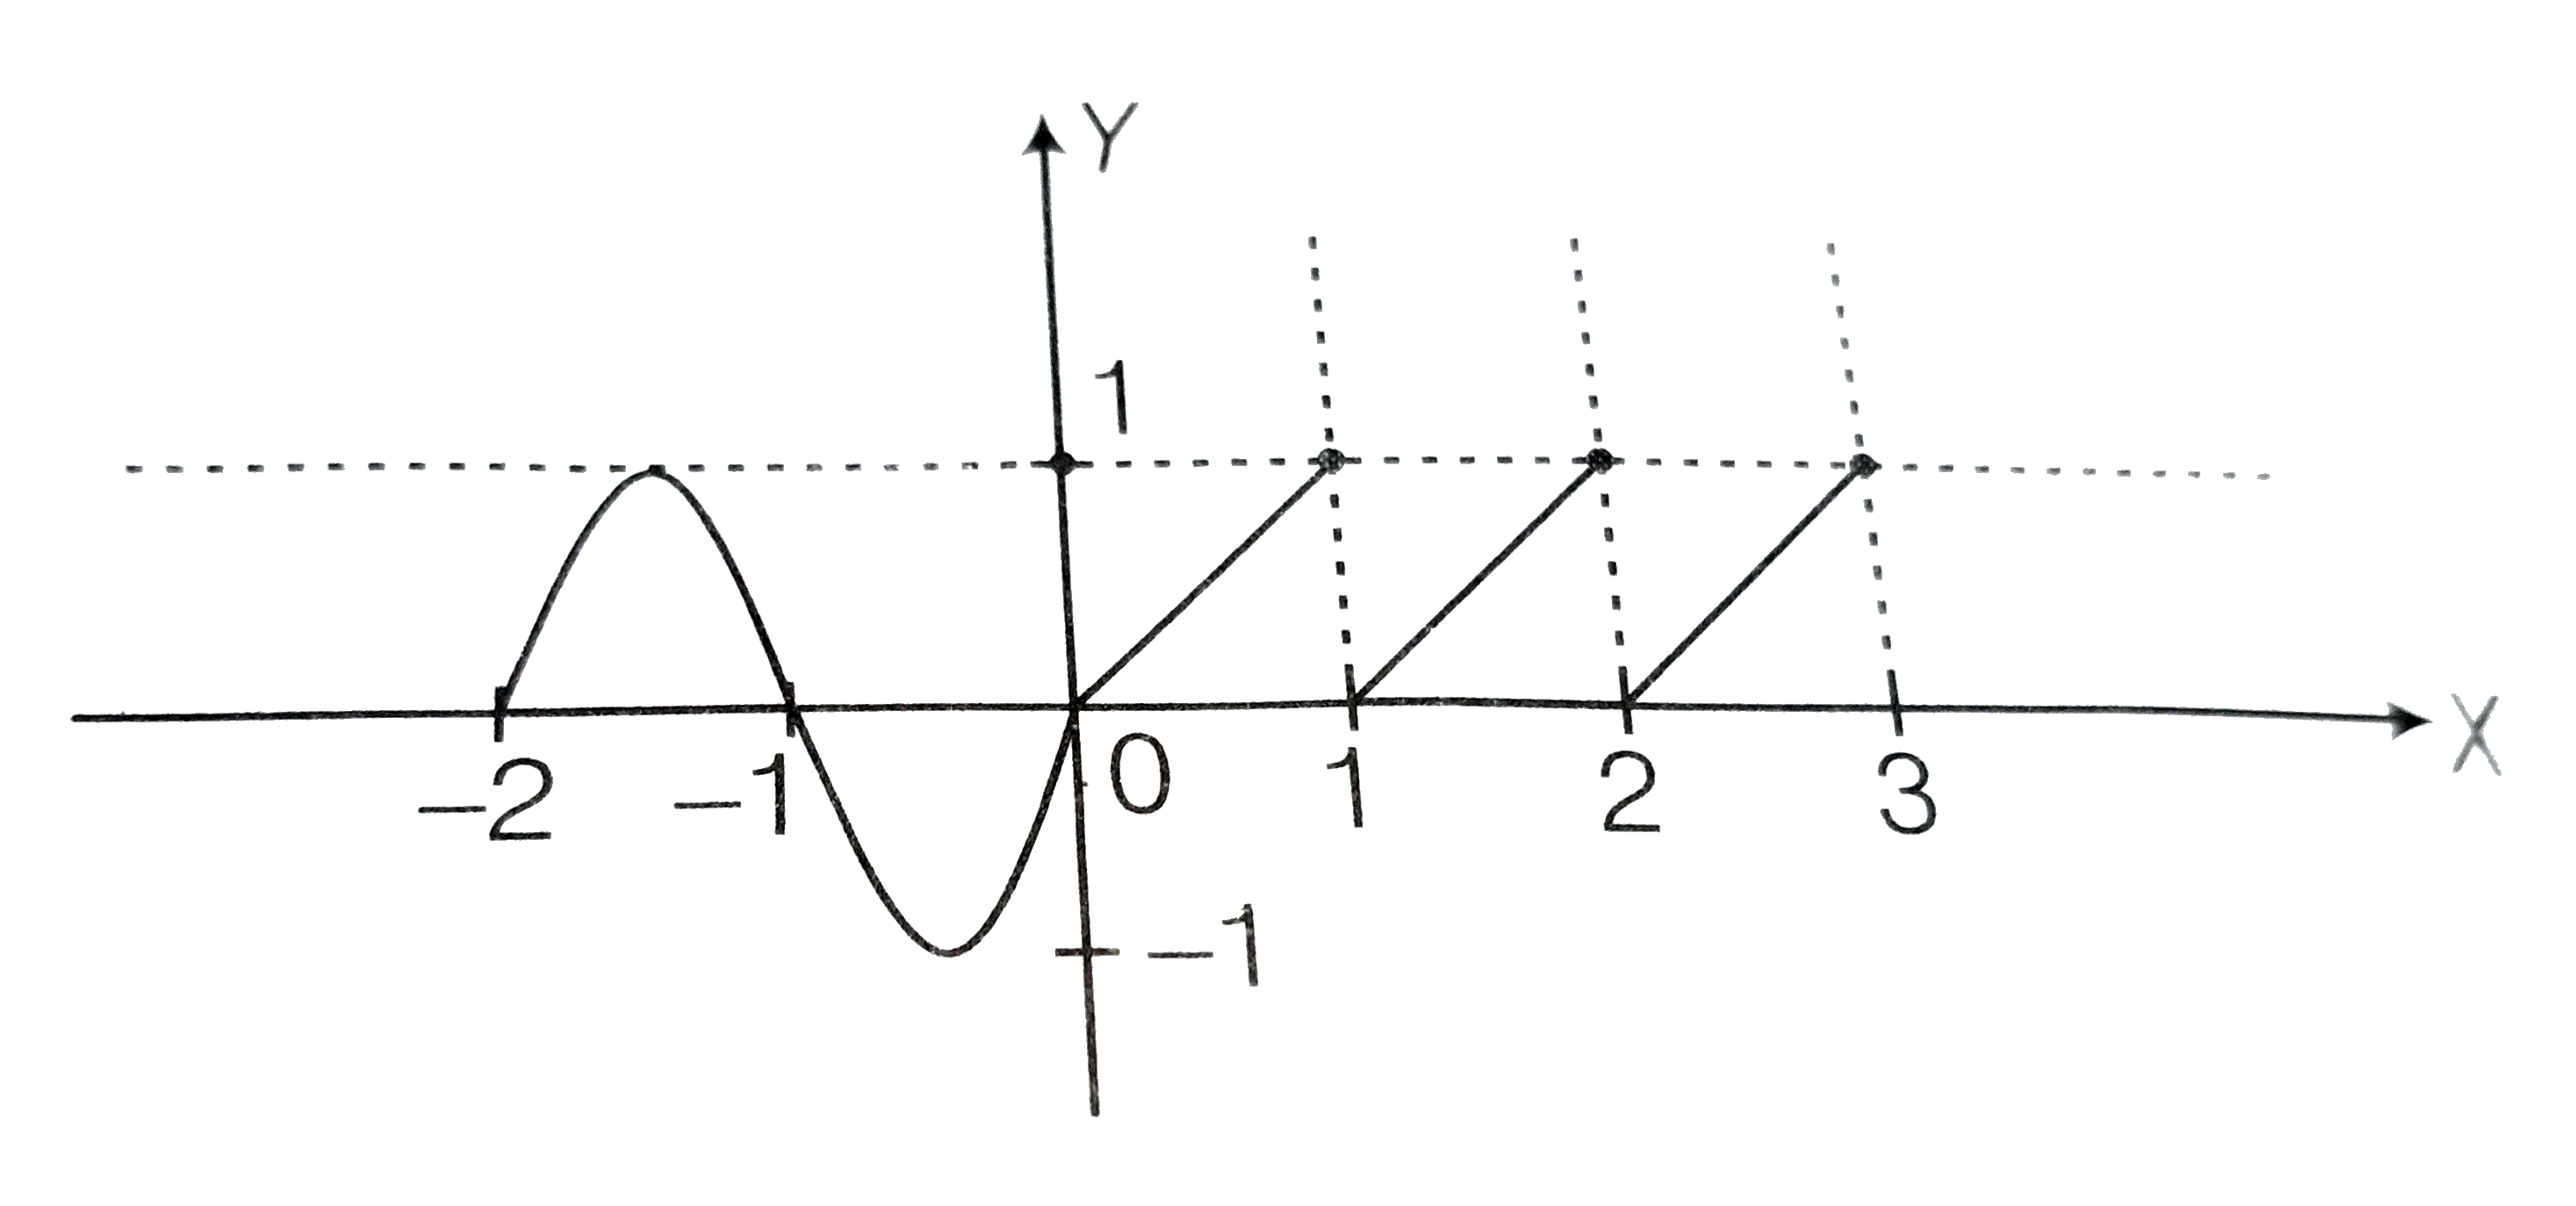
Draw the graph of following functions.
(b) f(x)−1
View SolutionConsider the following function f whose graph is given below.
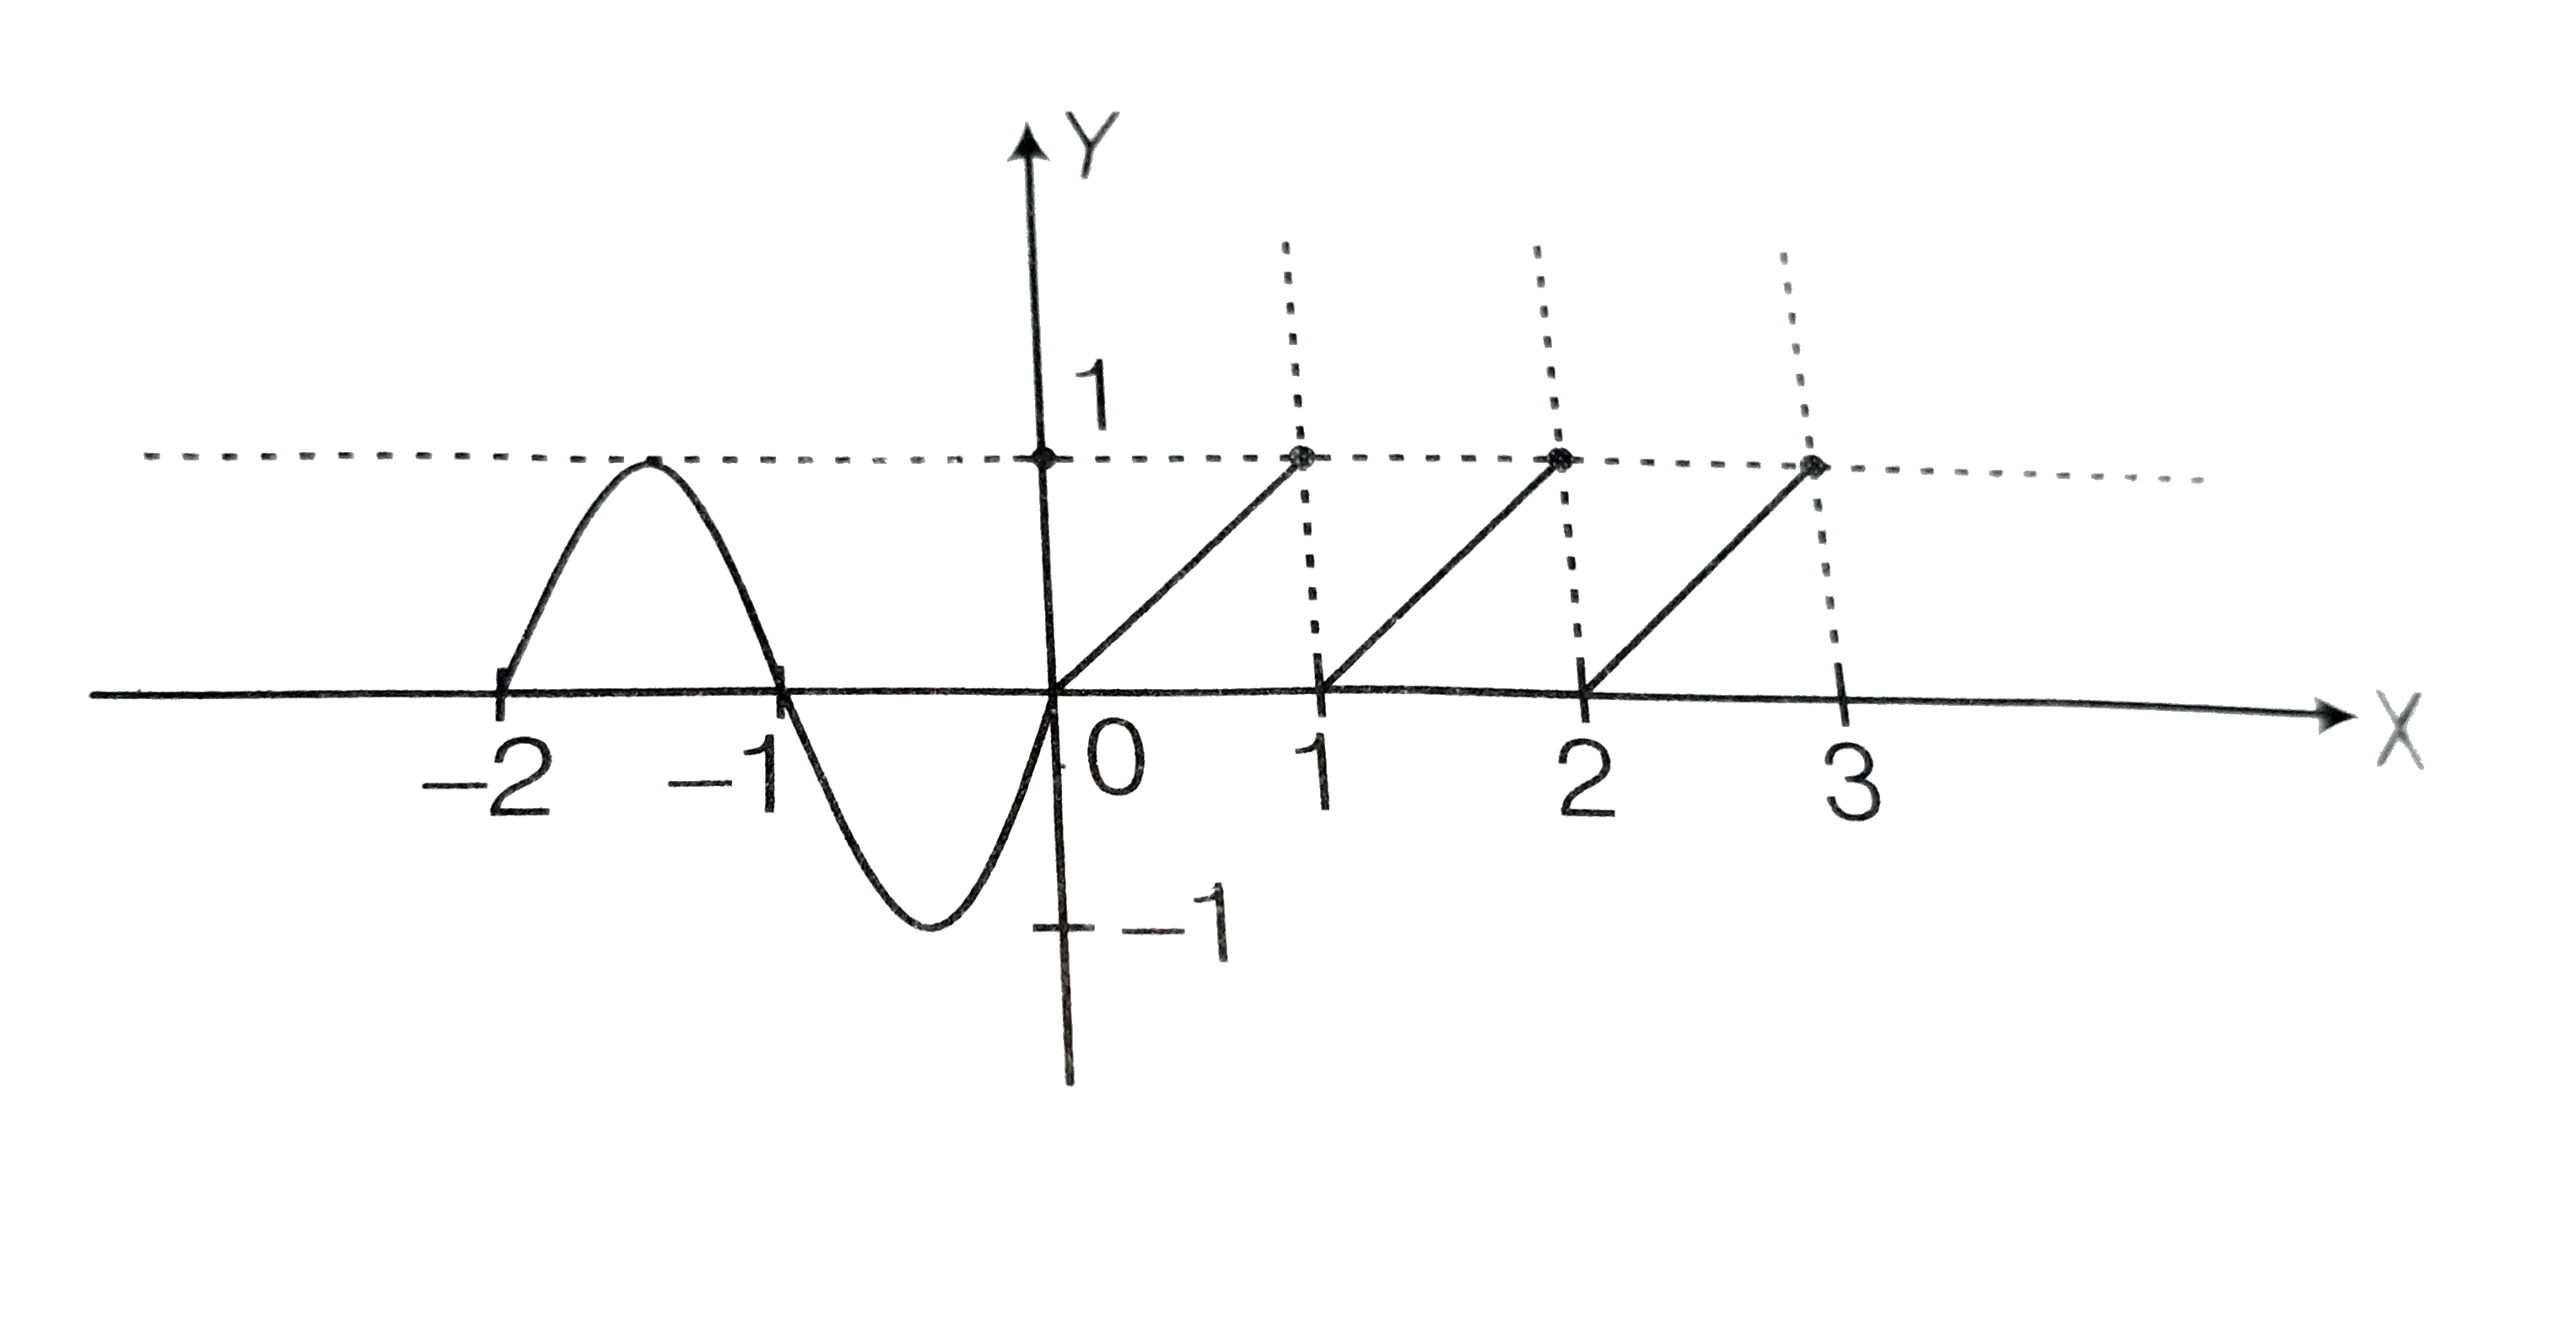
Draw the graph of following functions.
(c) −f(x)
View SolutionConsider the following function f whose graph is given below.
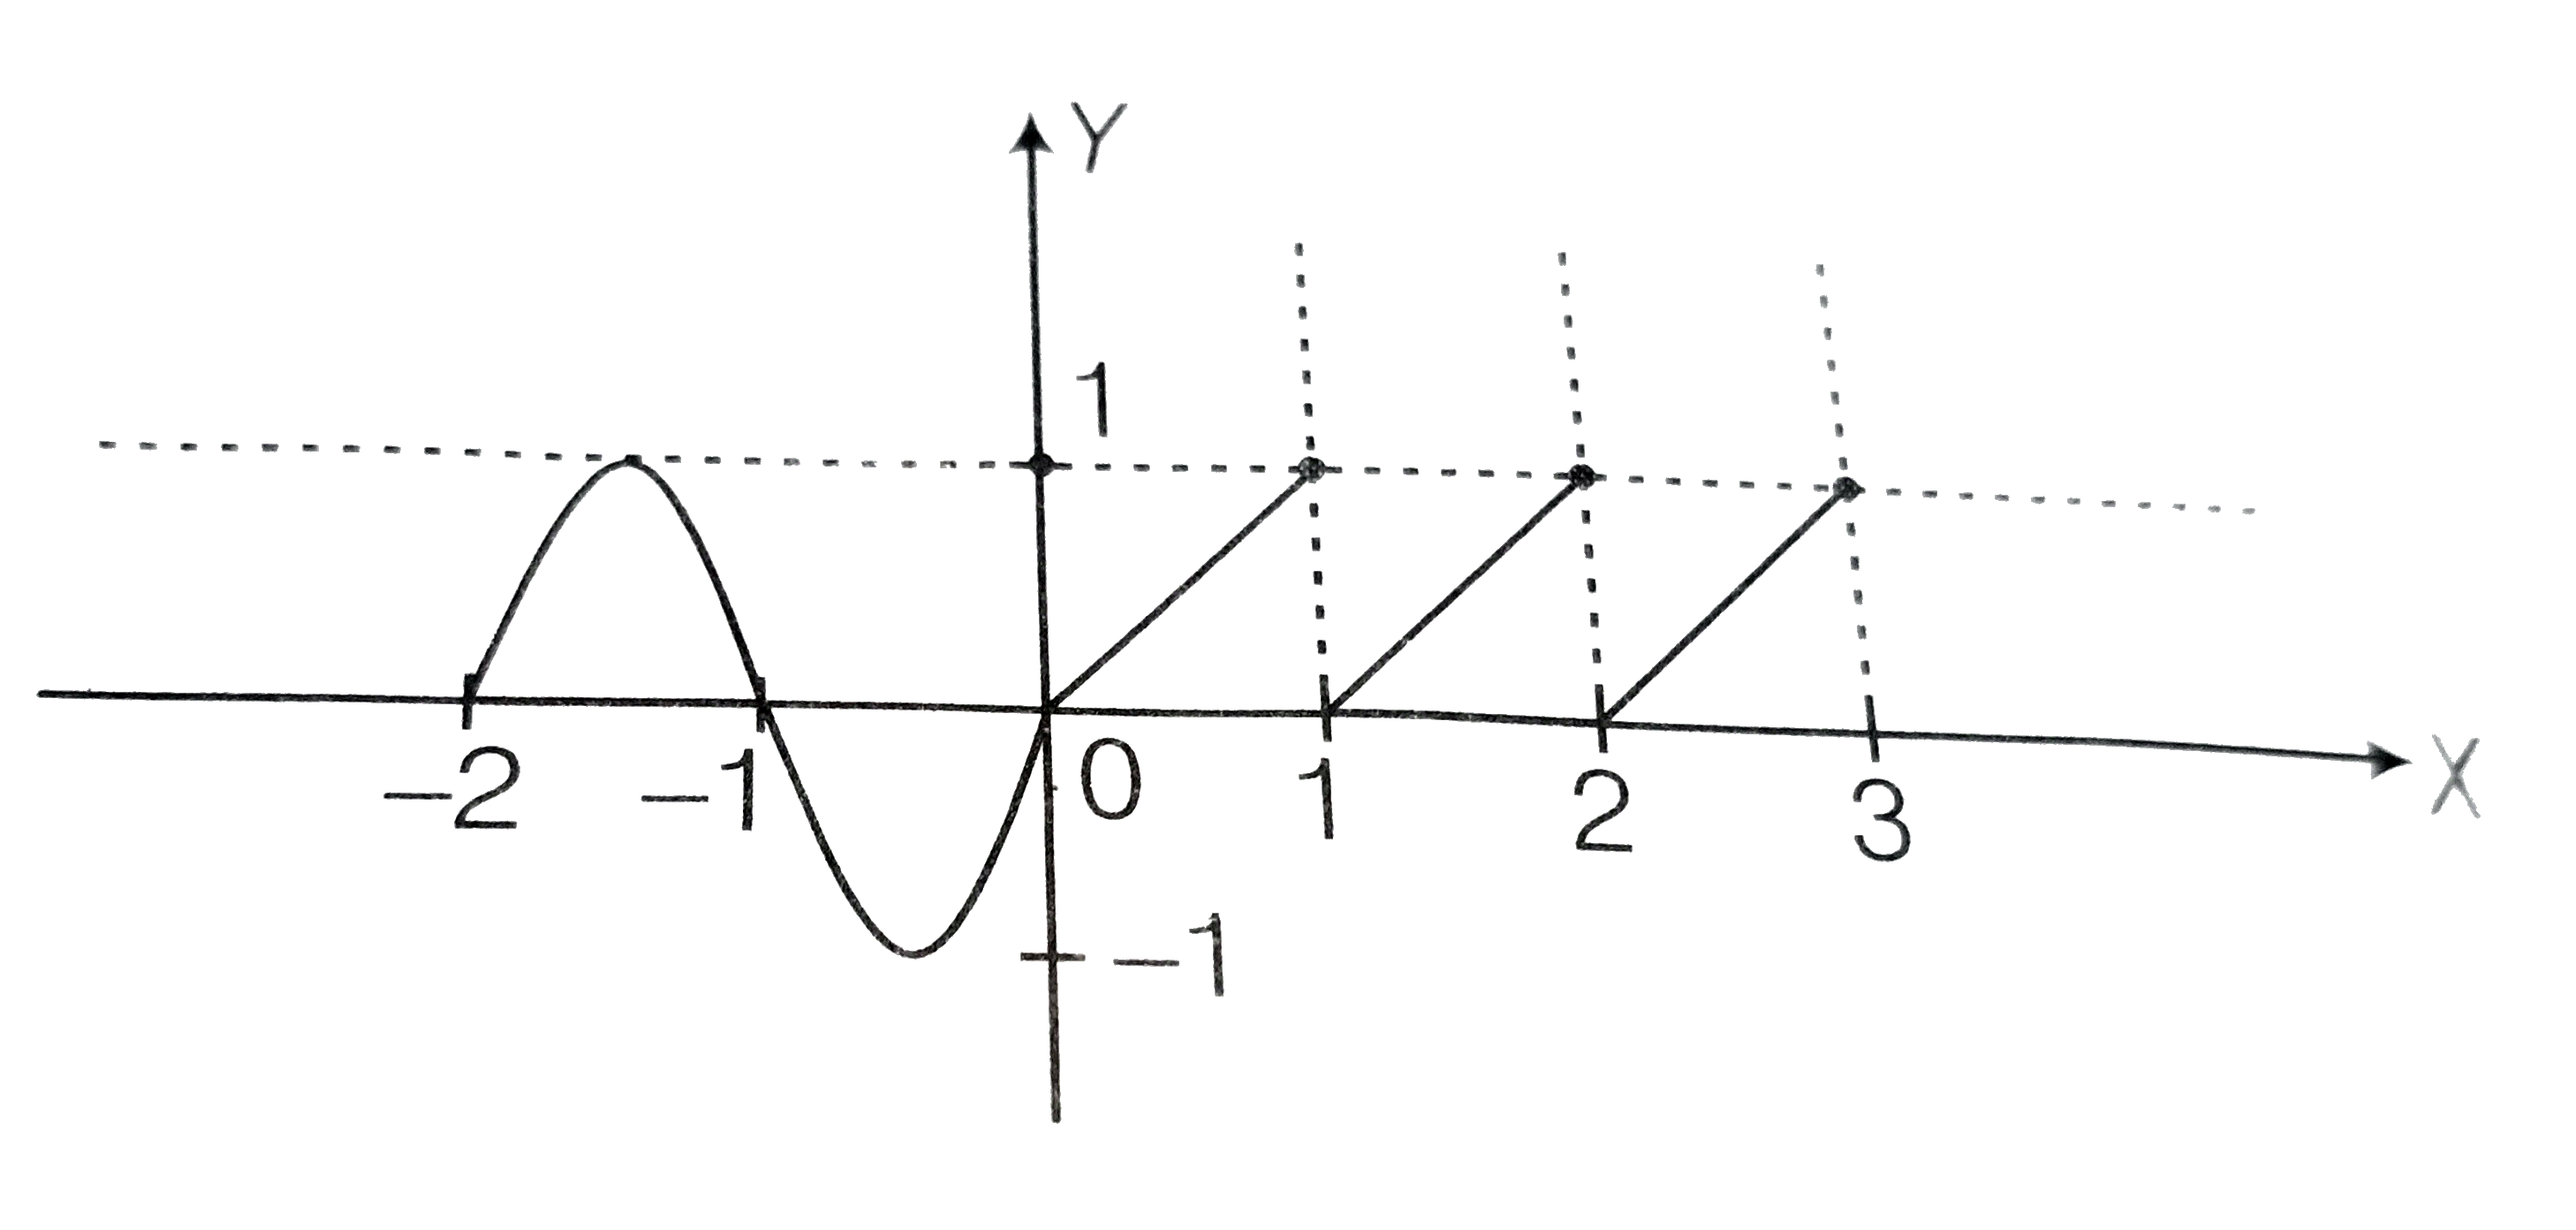
Draw the graph of following functions.
(d) |f(x)|
View SolutionConsider the following function f whose graph is given below.
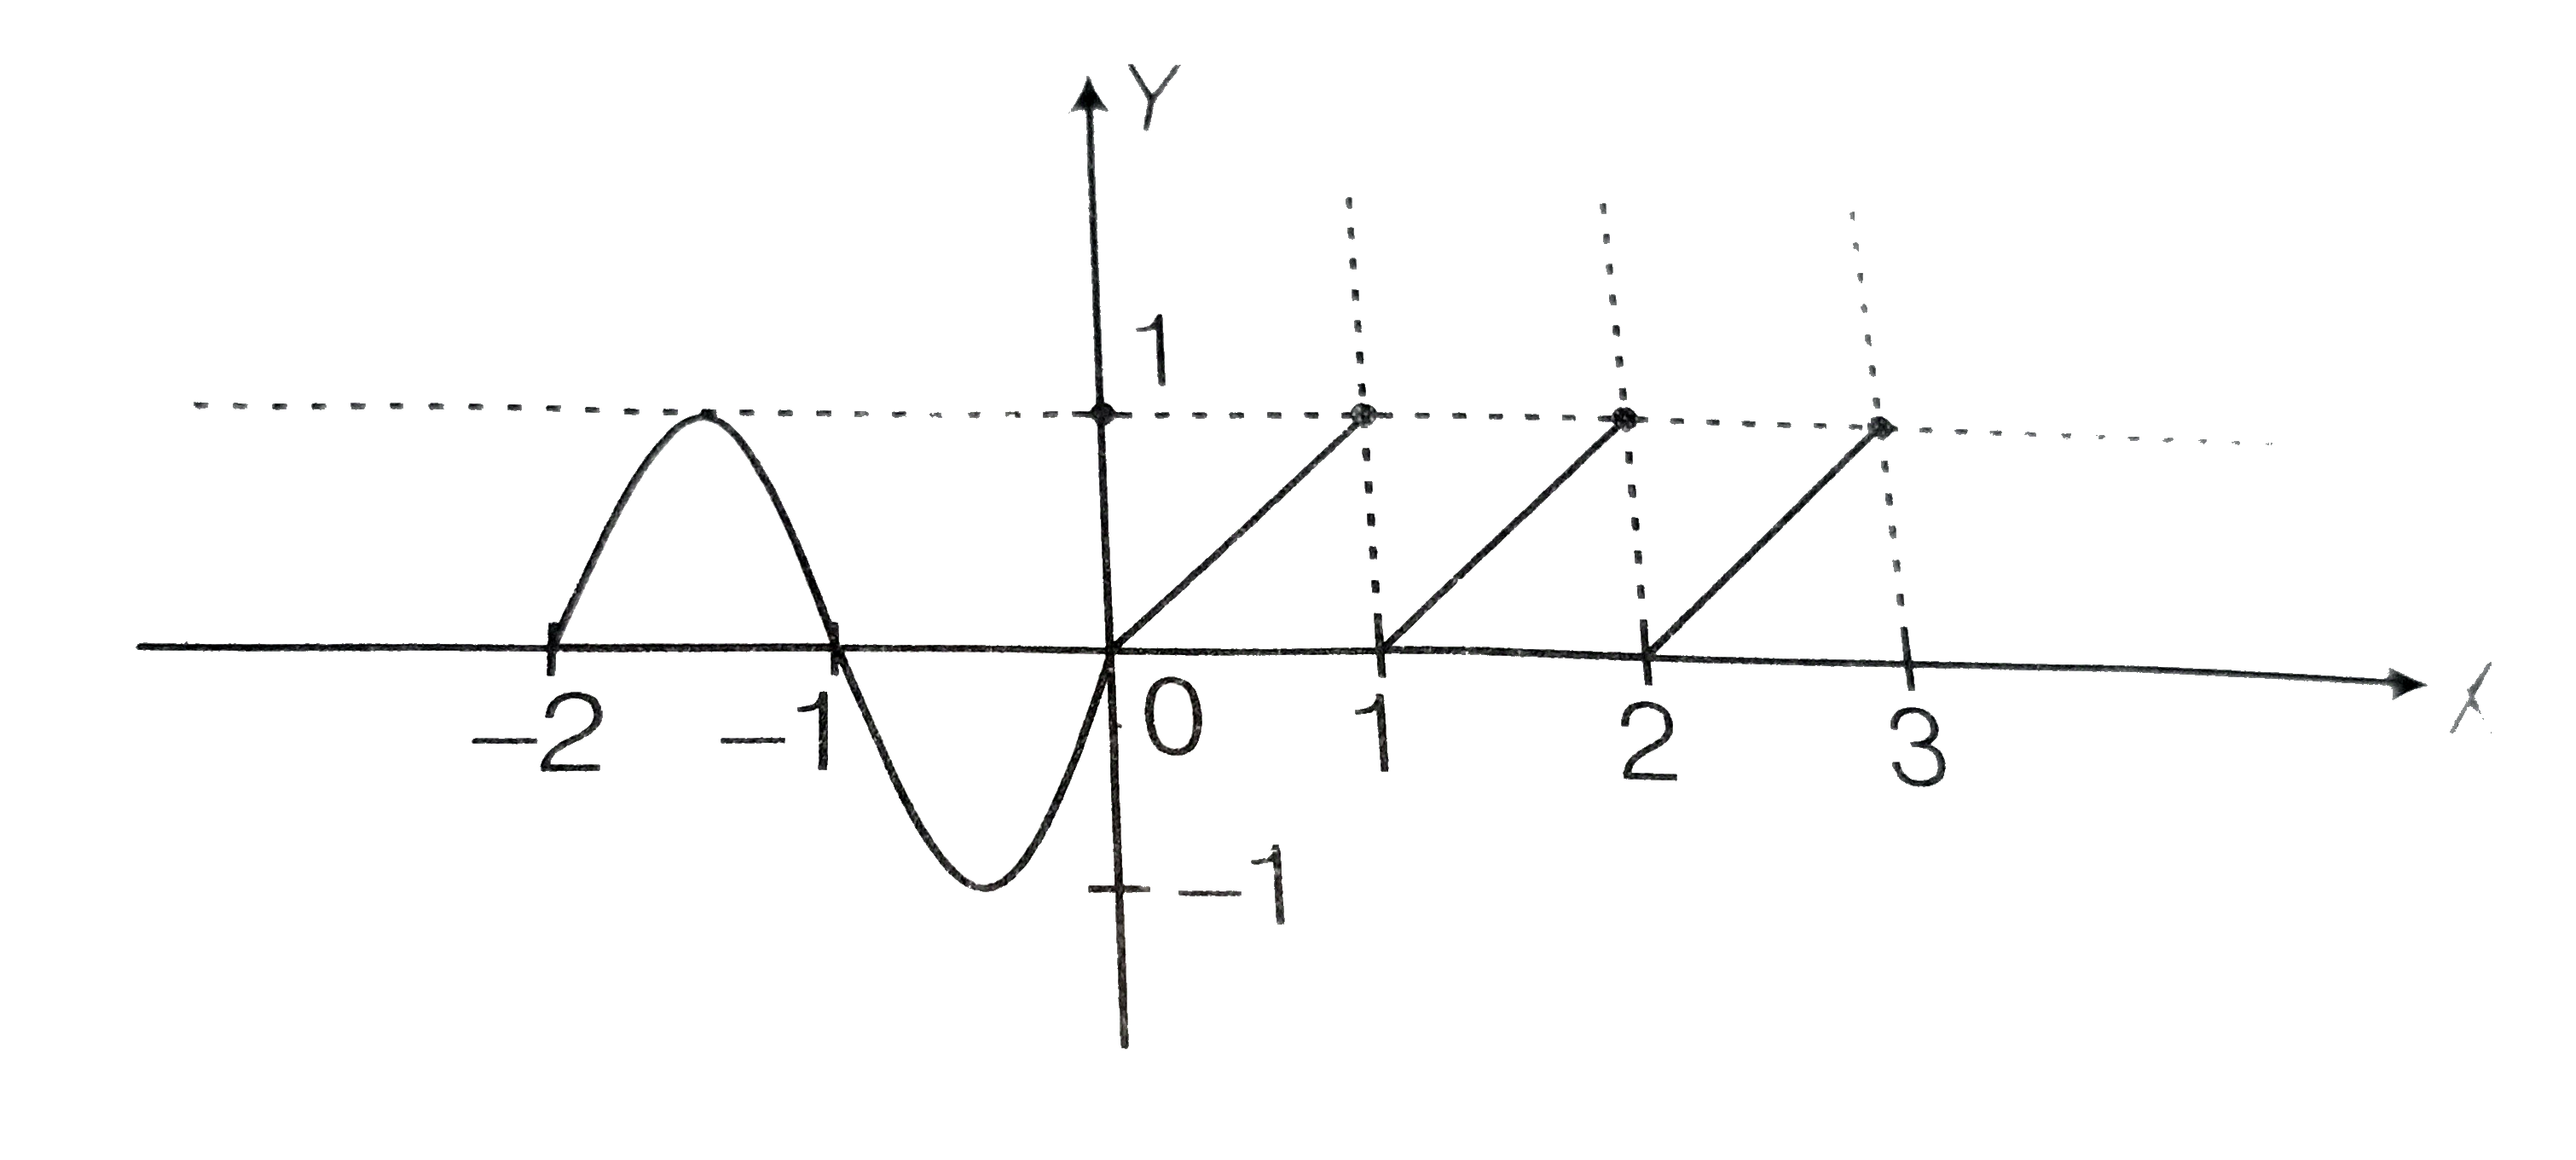
Draw the graph of following functions.
(e) f(−x)
View Solution
