Draw the graph of following function
Sin(x2)
To draw the graph of the function sin(x2), we will follow these steps:
Step 1: Identify Key Angles
We will start by identifying some standard angles for x that will help us calculate the values of sin(x2). The angles we will use are:
- 0
- π6
- π3
- π2
- 3π2
- 2π
Step 2: Calculate Values of sin(x2)
Now we will calculate the corresponding values of sin(x2) for each of these angles.
1. For x=0:
sin(02)=sin(0)=0
2. For x=π6:
sin(π62)=sin(π12)≈0.2588
3. For x=π3:
sin(π32)=sin(π6)=12=0.5
4. For x=π2:
sin(π22)=sin(π4)=√22≈0.7071
5. For x=3π2:
sin⎛⎝3π22⎞⎠=sin(3π4)=√22≈0.7071
6. For x=2π:
sin(2π2)=sin(π)=0
Step 3: Plot the Points
Now we will plot the points on a graph with x on the horizontal axis and sin(x2) on the vertical axis. The points we have calculated are:
- (0,0)
- (π6,0.2588)
- (π3,0.5)
- (π2,0.7071)
- (3π2,0.7071)
- (2π,0)
Step 4: Draw the Graph
Using the points plotted, we can now draw the graph of sin(x2). The graph will start at the origin (0,0), rise to its maximum at π2, then return to 0 at 2π. The graph will be periodic, repeating every 4π since the period of sin(kx) is 2πk and here k=12.
Step 5: Label the Axes
Finally, label the x-axis with the angles in radians and the y-axis with the corresponding sine values.
We will start by identifying some standard angles for x that will help us calculate the values of sin(x2). The angles we will use are:
- 0
- π6
- π3
- π2
- 3π2
- 2π
Now we will calculate the corresponding values of sin(x2) for each of these angles.
sin(02)=sin(0)=0
sin(π62)=sin(π12)≈0.2588
sin(π32)=sin(π6)=12=0.5
sin(π22)=sin(π4)=√22≈0.7071
sin⎛⎝3π22⎞⎠=sin(3π4)=√22≈0.7071
sin(2π2)=sin(π)=0
Now we will plot the points on a graph with x on the horizontal axis and sin(x2) on the vertical axis. The points we have calculated are:
- (0,0)
- (π6,0.2588)
- (π3,0.5)
- (π2,0.7071)
- (3π2,0.7071)
- (2π,0)
Using the points plotted, we can now draw the graph of sin(x2). The graph will start at the origin (0,0), rise to its maximum at π2, then return to 0 at 2π. The graph will be periodic, repeating every 4π since the period of sin(kx) is 2πk and here k=12.
Finally, label the x-axis with the angles in radians and the y-axis with the corresponding sine values.
Topper's Solved these Questions
- BOOK - RS AGGARWALCHAPTER - GRAPHS OF TRIGONOMETRIC FUNCTIONSEXERCISE - EXERCISE 196videos
GRAPHS OF TRIGONOMETRIC FUNCTIONS
- BOOK - RS AGGARWALCHAPTER - GEOMETRICAL PROGRESSIONEXERCISE - EXERCISE 12H (Very Short Answer Type Questions)13videos
GEOMETRICAL PROGRESSION
- BOOK - RS AGGARWALCHAPTER - HYPERBOLAEXERCISE - EXERCISE 2423videos
HYPERBOLA
Similar Questions
Consider the following function f whose graph is given below.
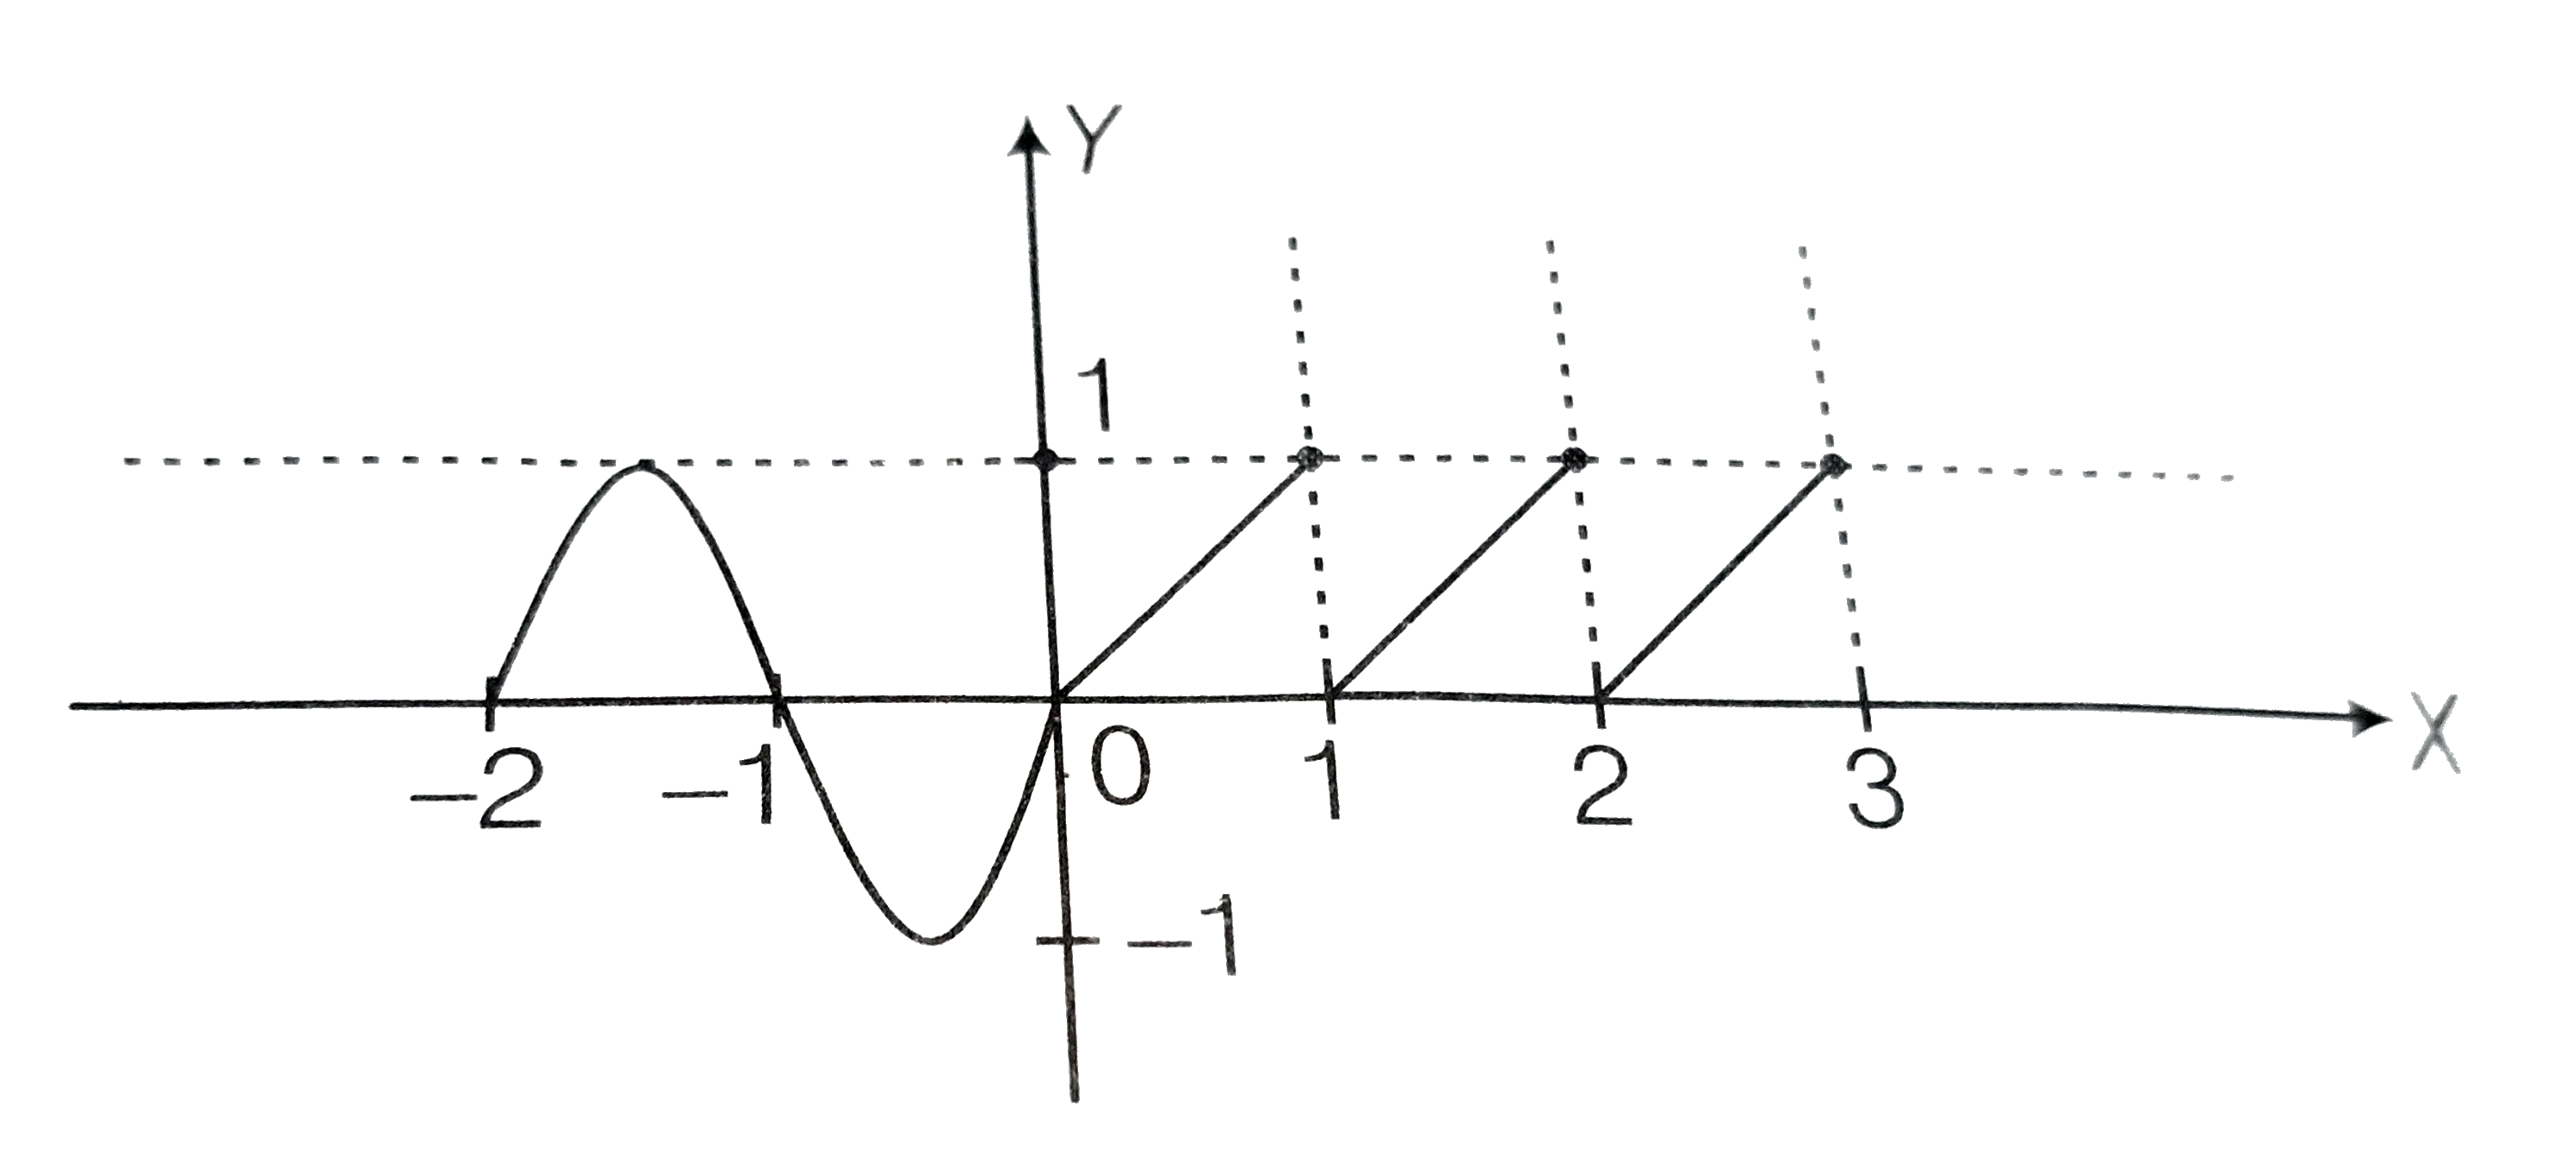
Draw the graph of following functions.
(i) [f(x)]View SolutionDraw the graph of the following function.
2f(x)View SolutionDraw the graph of the following function.
f(2x)View SolutionConsider the following function f whose graph is given below.
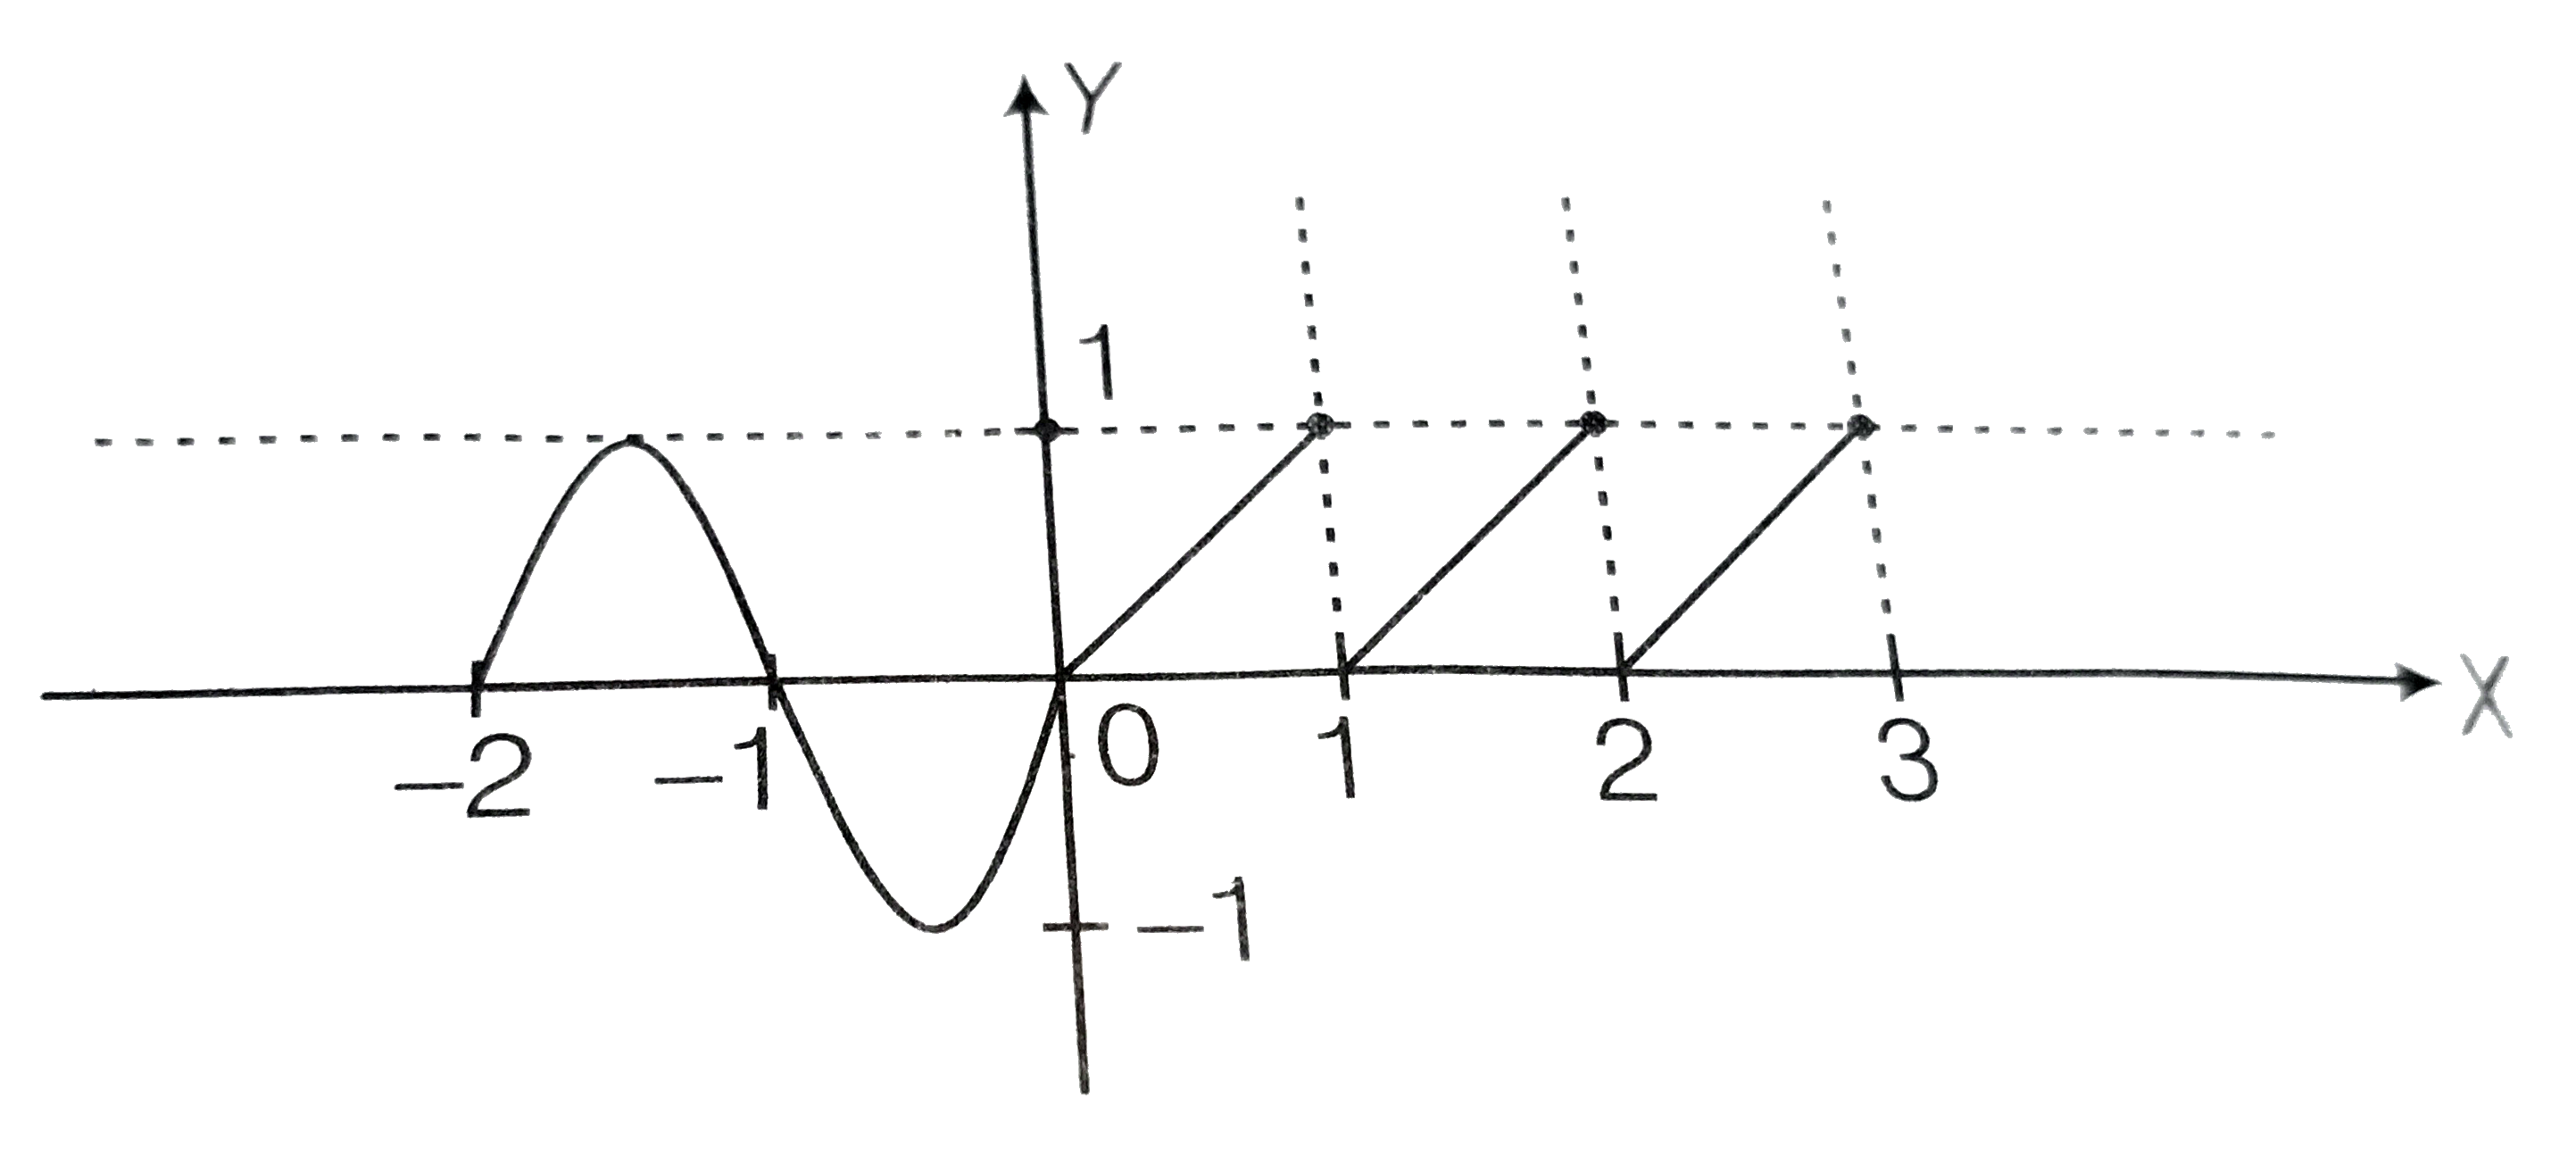
Draw the graph of following functions.
(g) 2f(x)View SolutionConsider the following function f whose graph is given below.
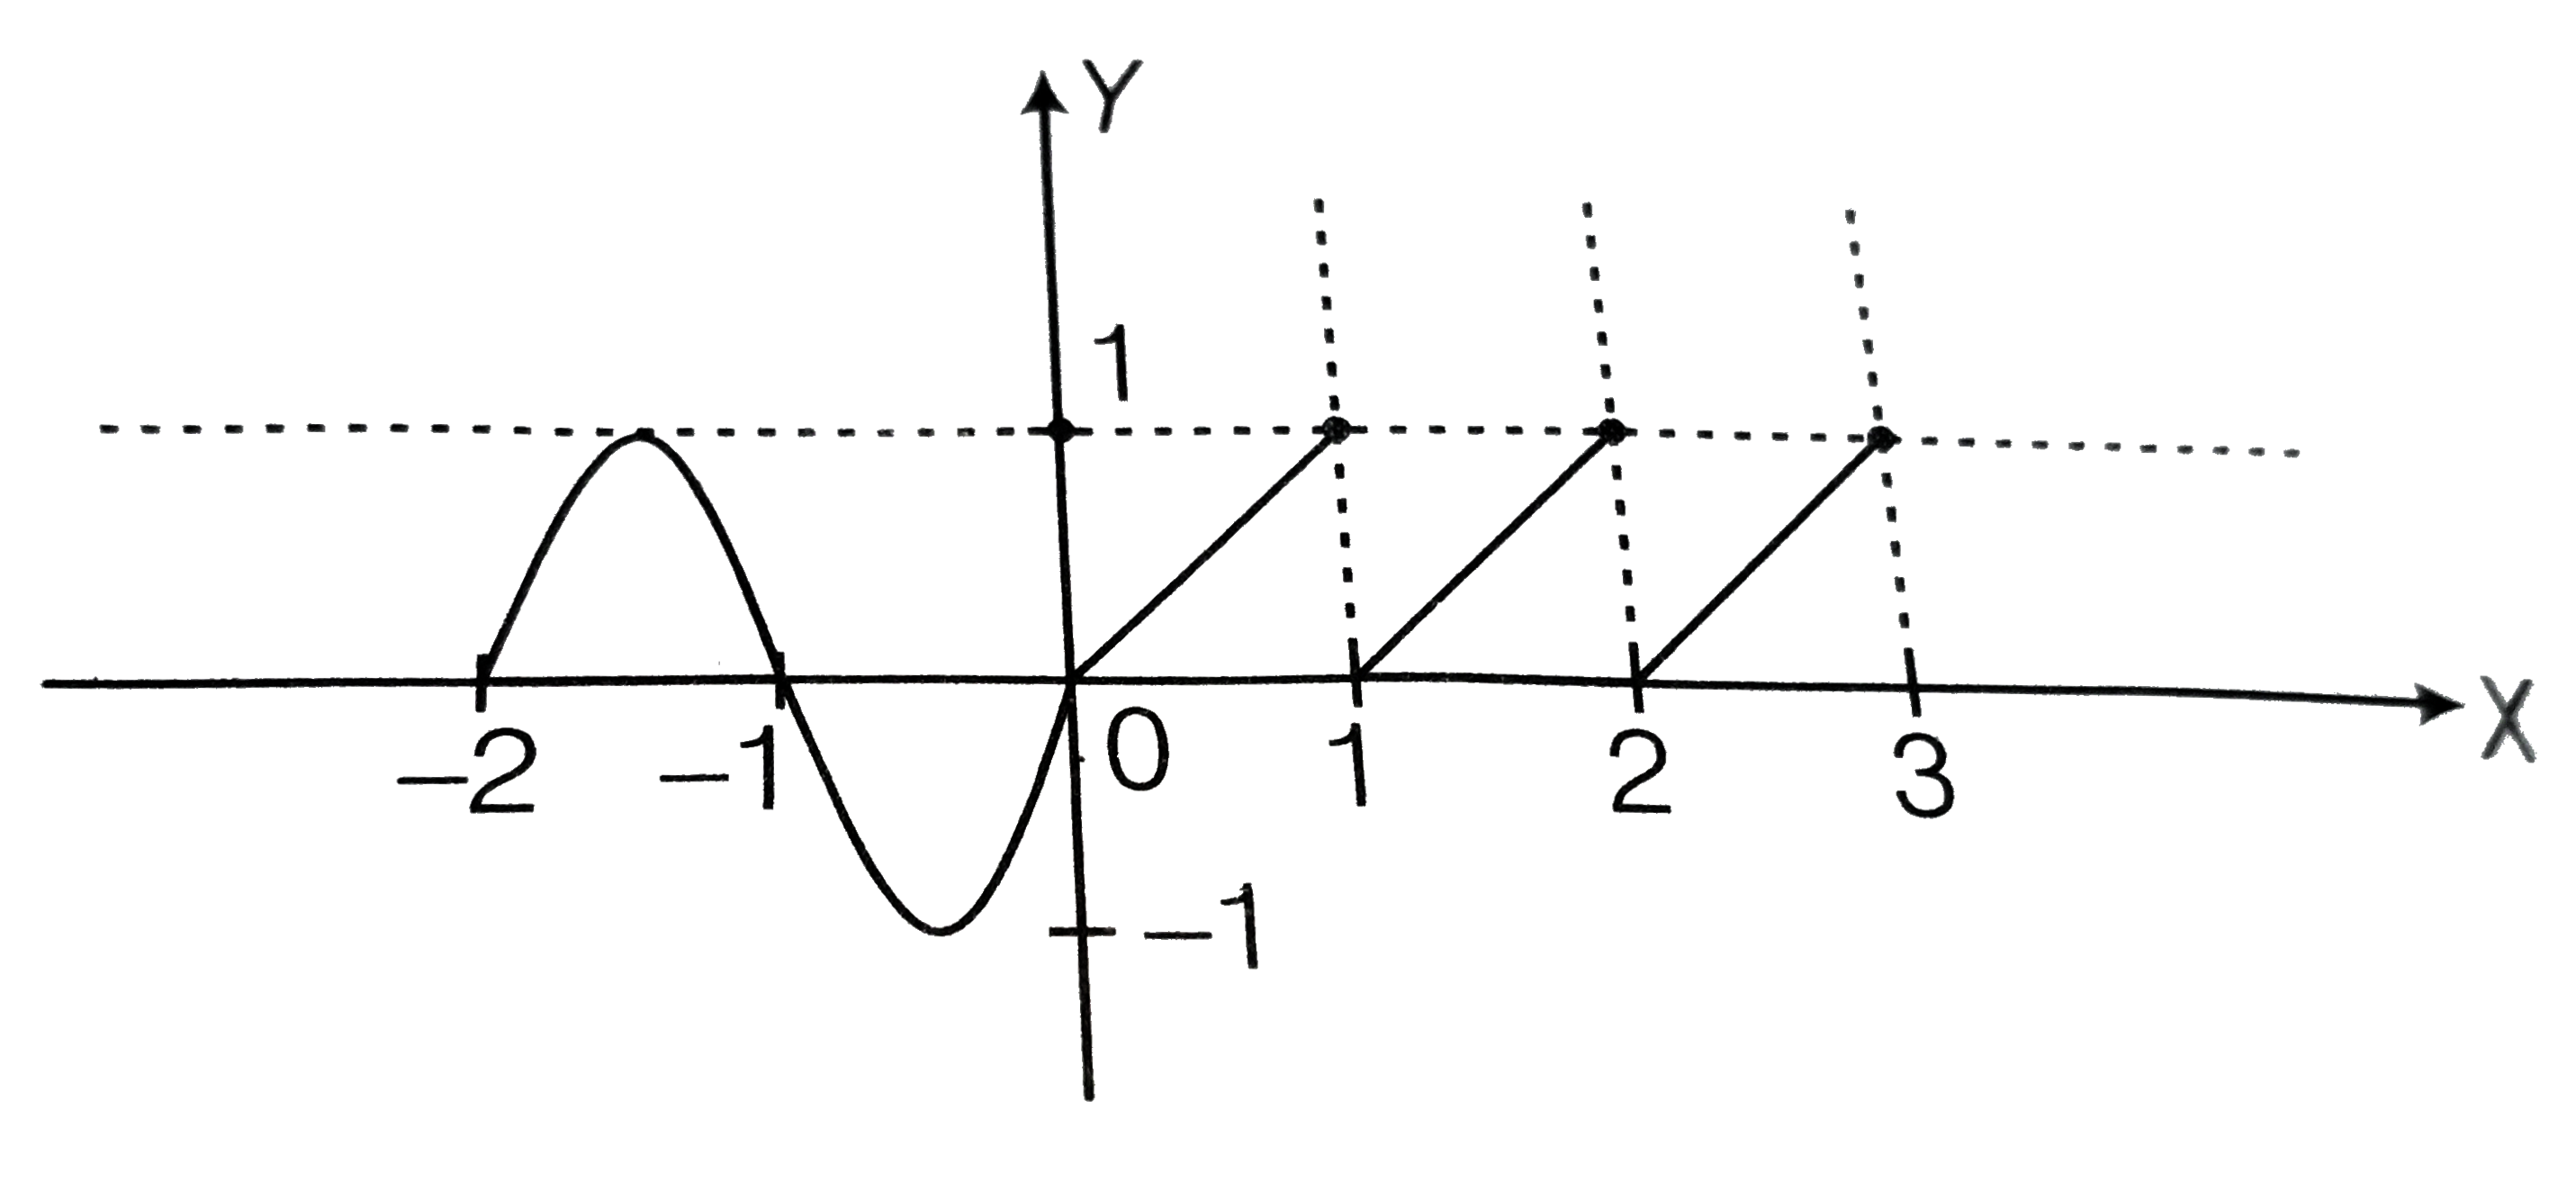
Draw the graph of following functions.
(h) f(2x)View SolutionDraw the graph of the following function.
f(−x)View SolutionConsider the following function f whose graph is given below.
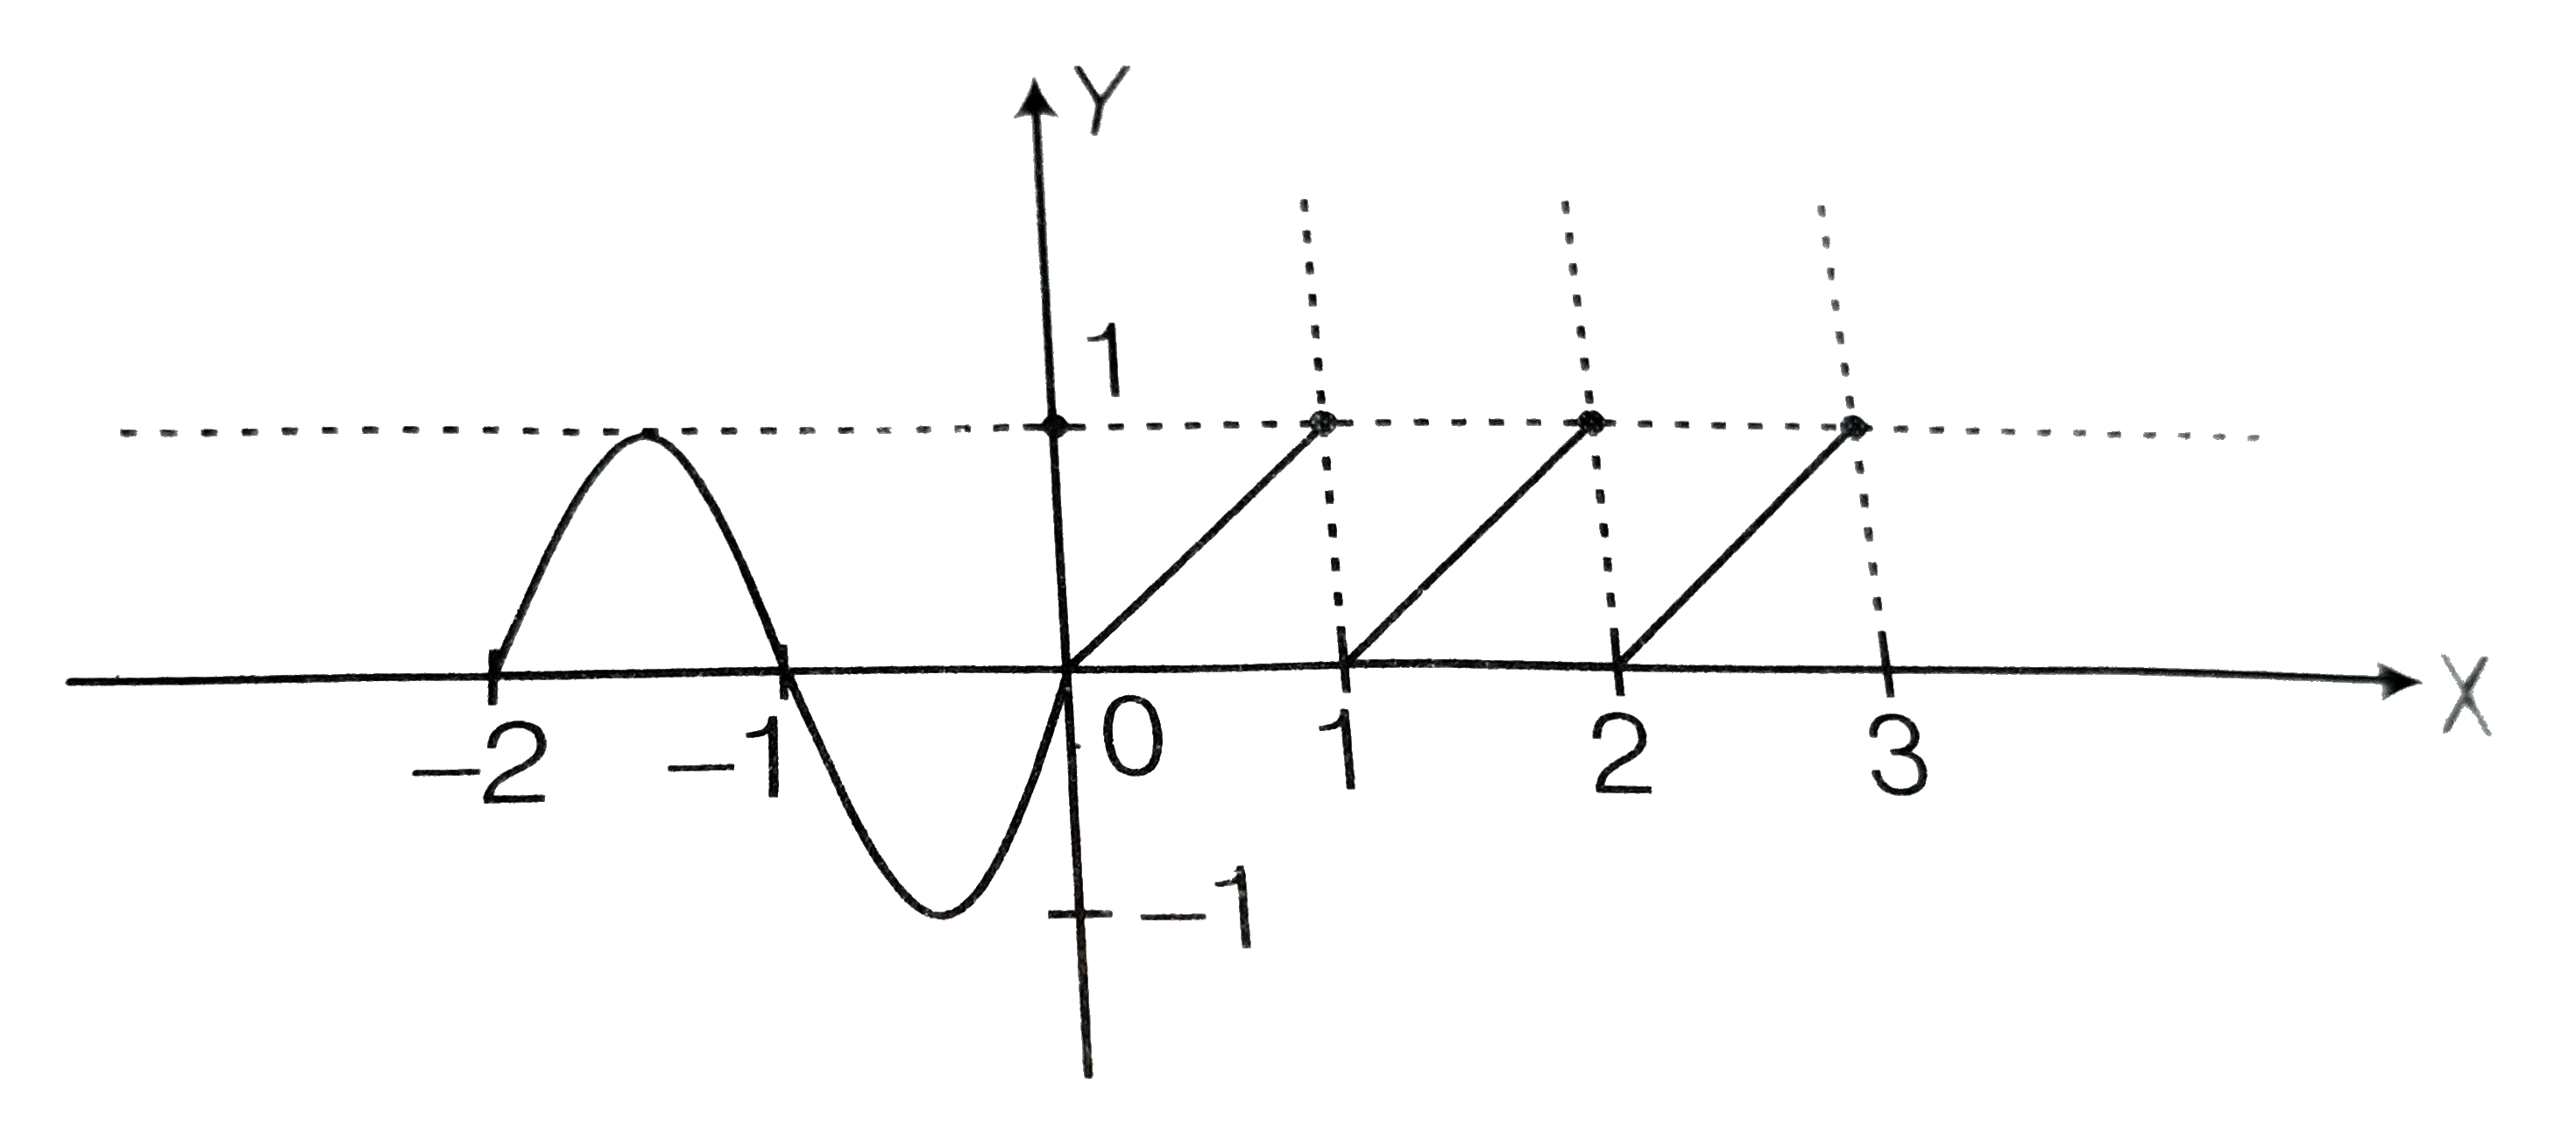
Draw the graph of following functions.
(a) f(x)+1View SolutionConsider the following function f whose graph is given below.
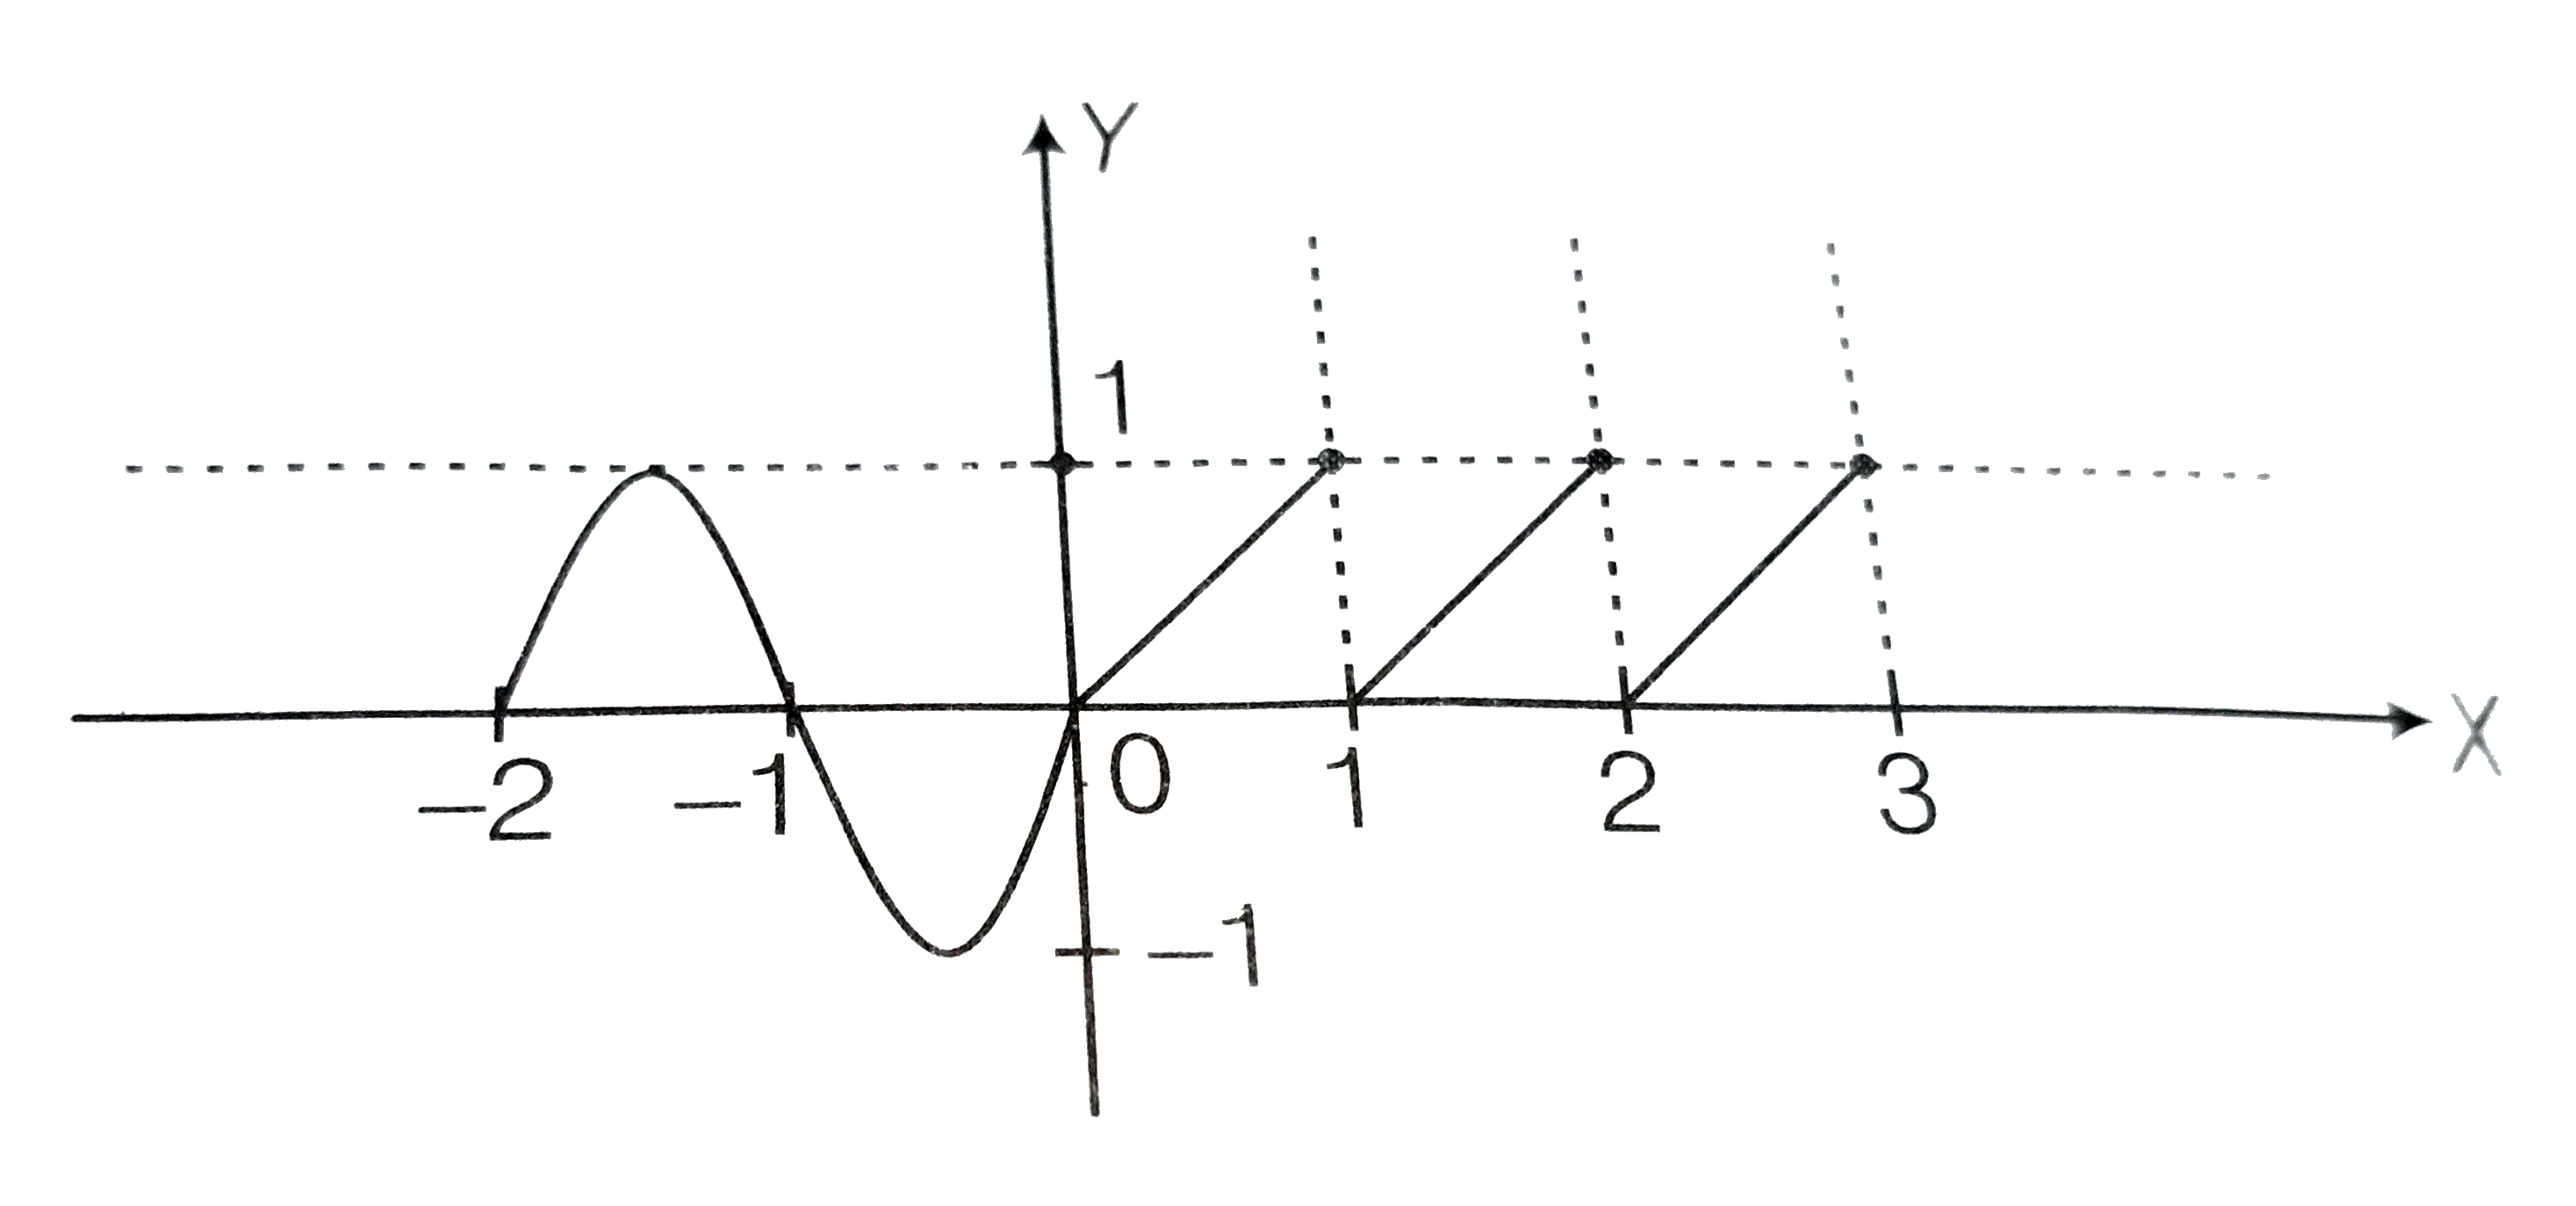
Draw the graph of following functions.
(b) f(x)−1View SolutionConsider the following function f whose graph is given below.
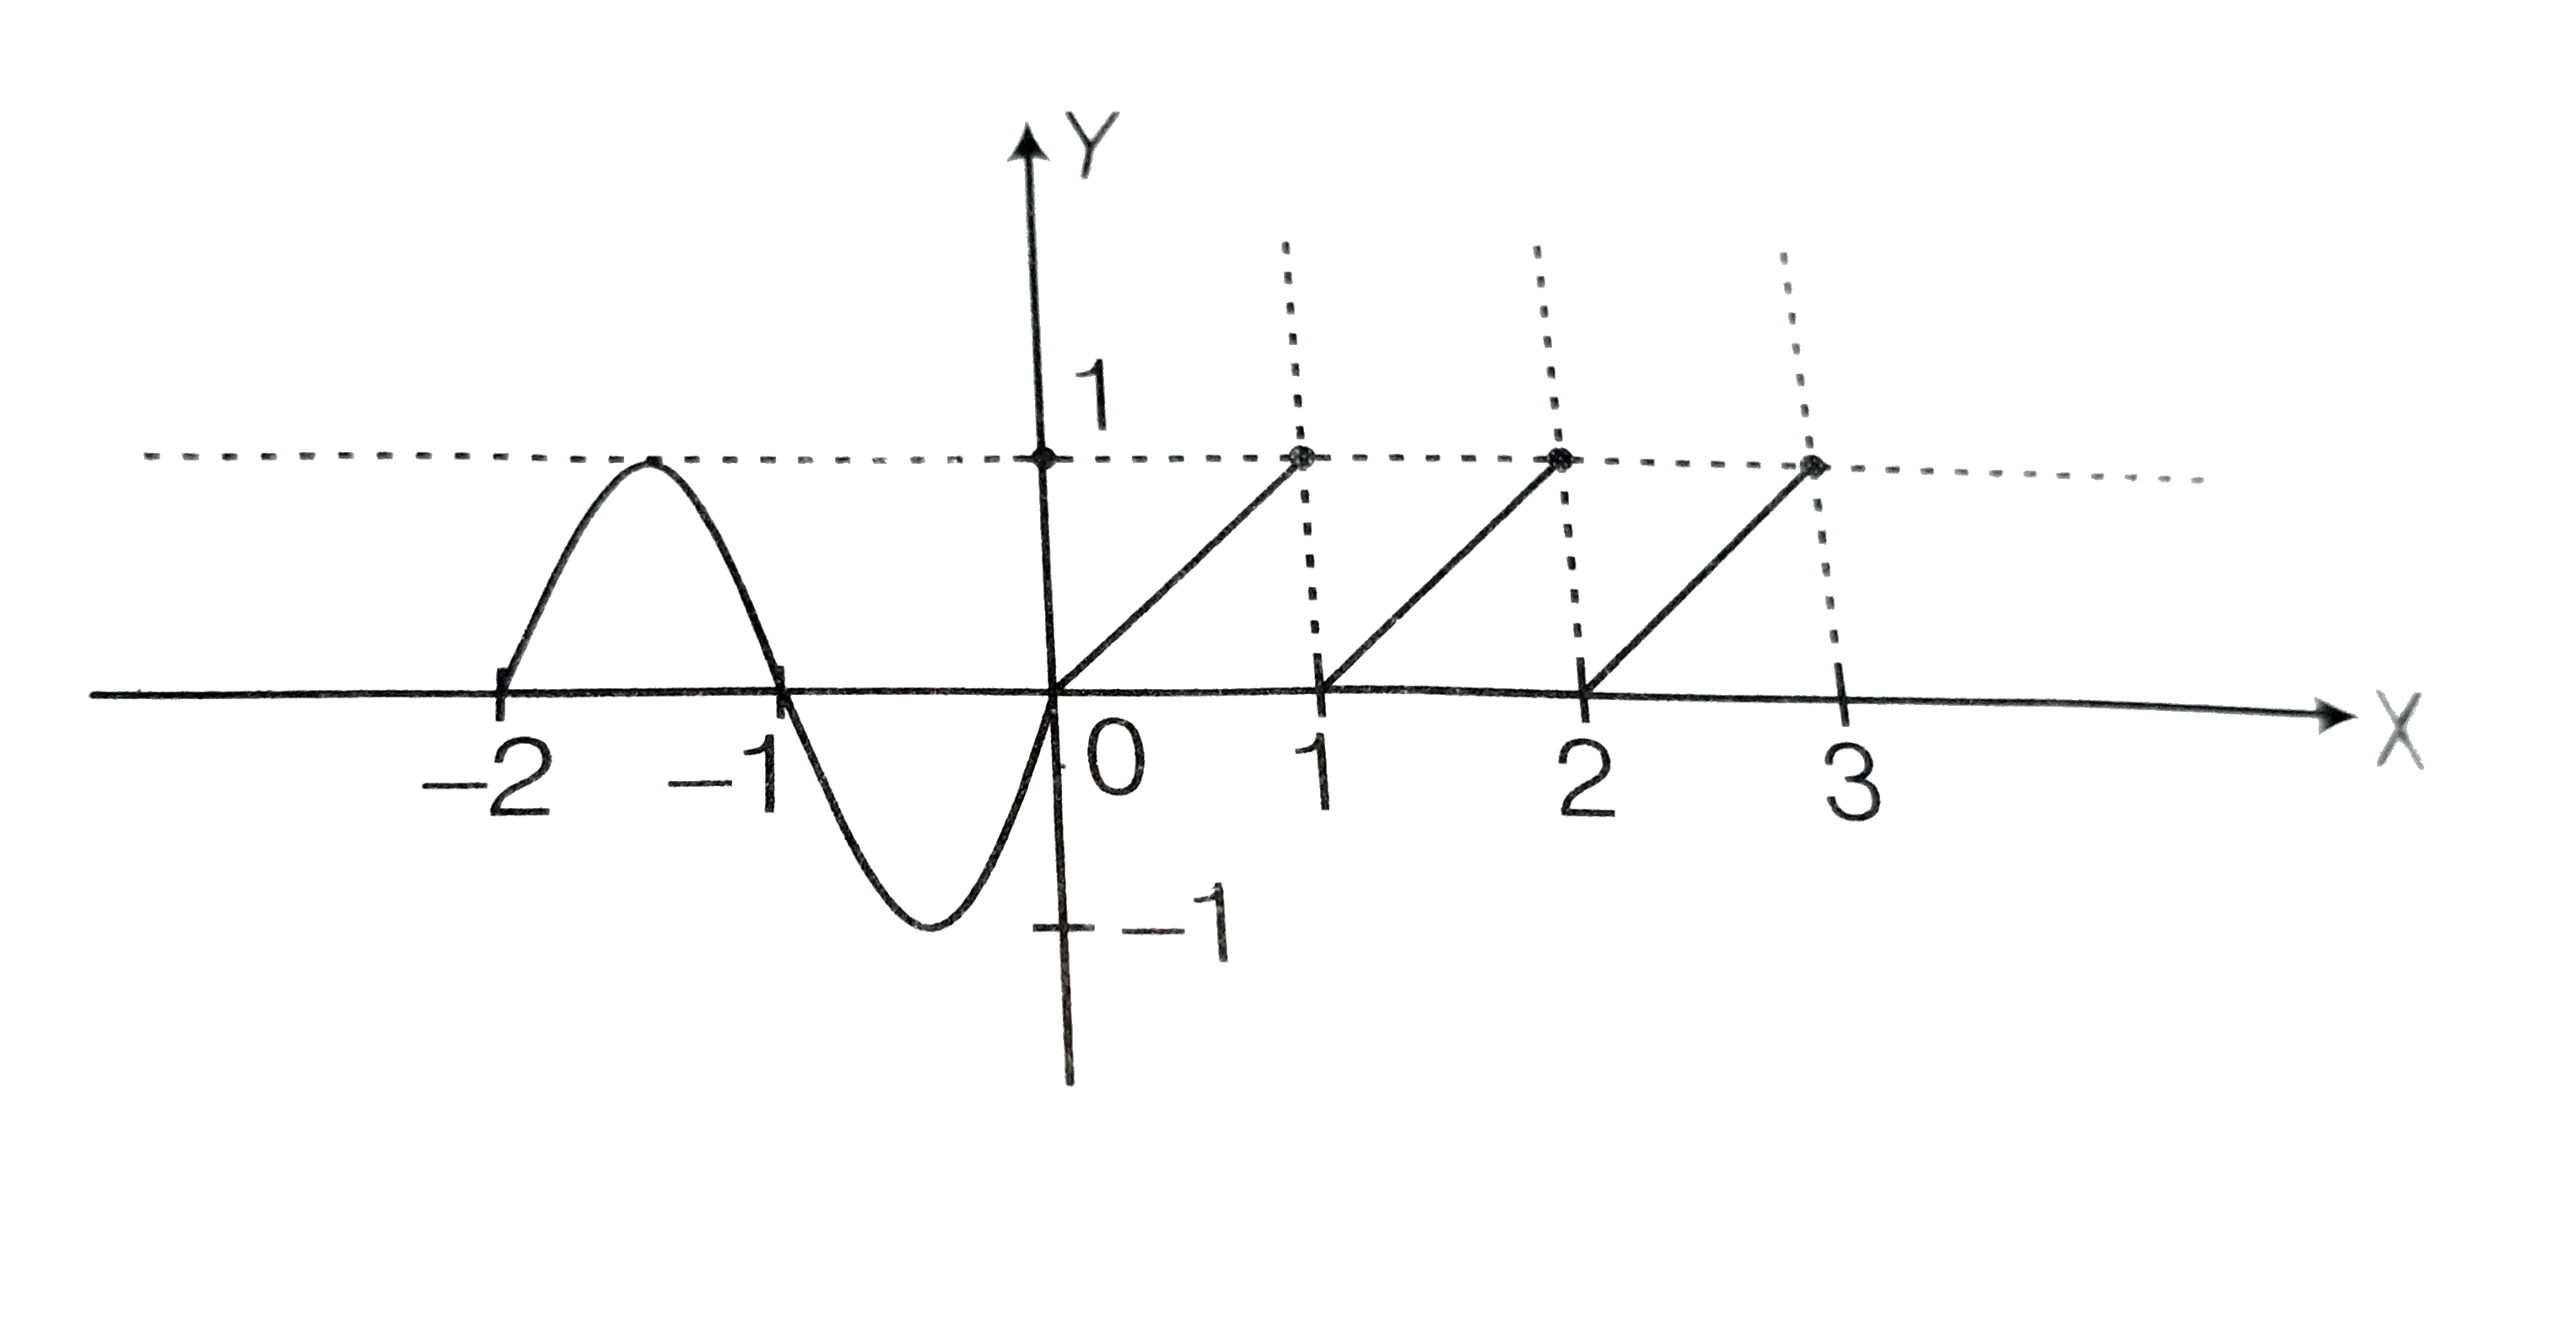
Draw the graph of following functions.
(c) −f(x)View SolutionConsider the following function f whose graph is given below.
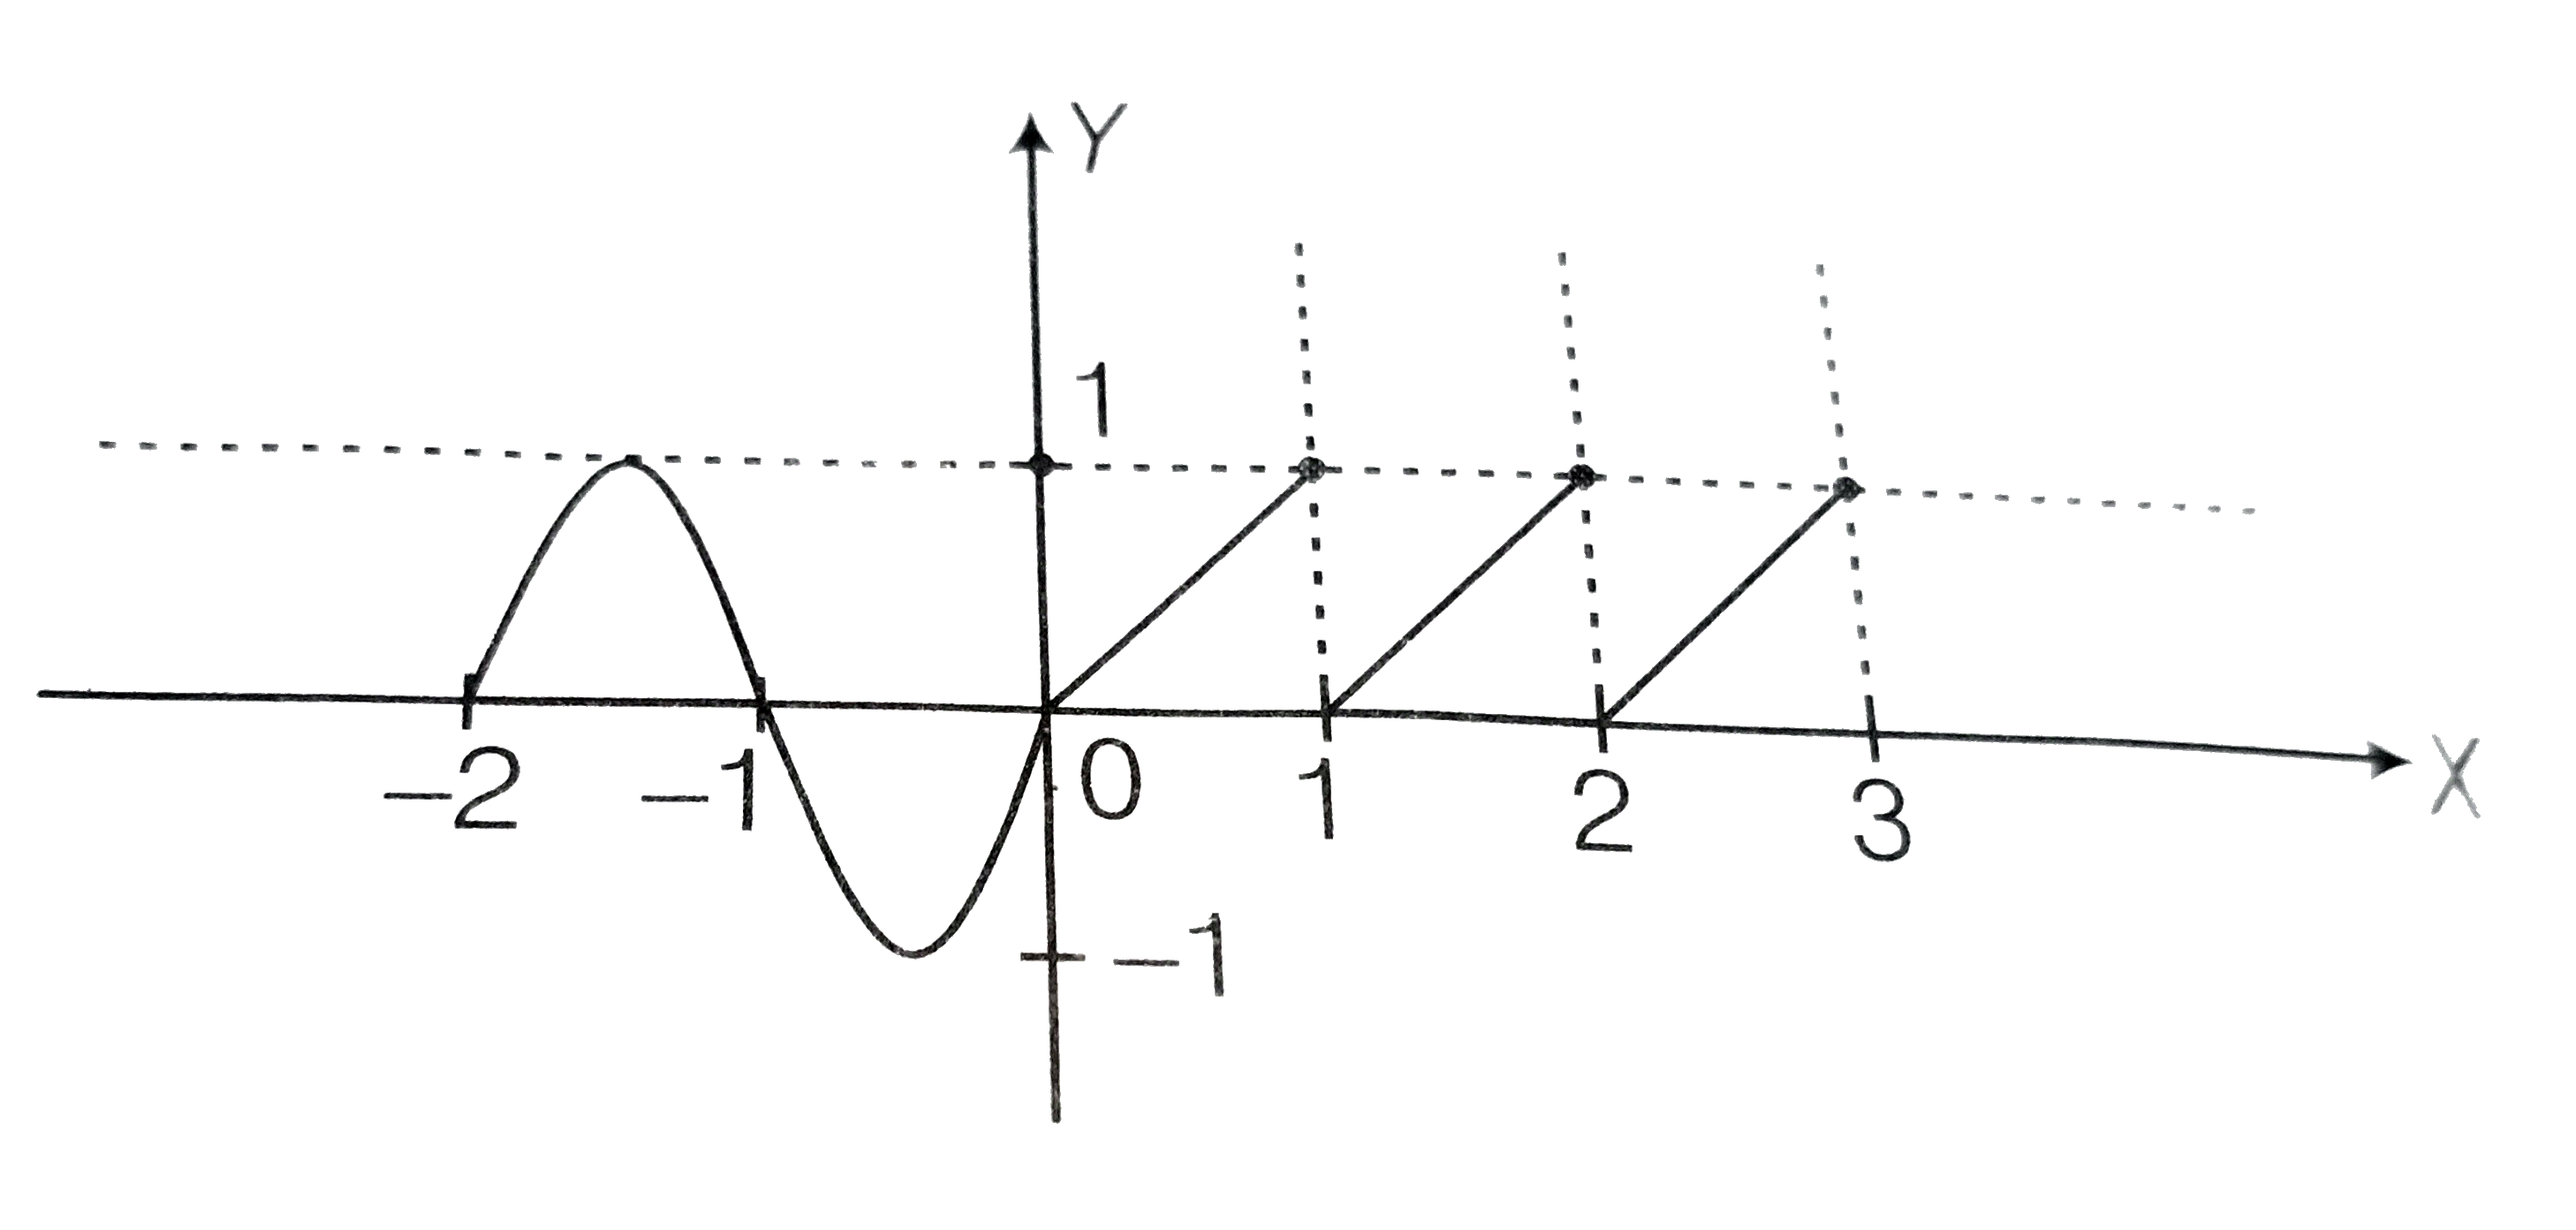
Draw the graph of following functions.
(d) |f(x)|View Solution

