Using short cut method, find the mean, variance and standard deviation for the data :

The correct Answer is:Mean = 49.67, Variance = 135.44 and SD = 11.64
Step by step video & image solution for Using short cut method, find the mean, variance and standard deviation for the data : by Maths experts to help you in doubts & scoring excellent marks in Class 11 exams.
Updated on:21/07/2023Topper's Solved these Questions
- STATISTICSBOOK - RS AGGARWALCHAPTER - STATISTICSEXERCISE - EXERCISE 30C
8 Videos
- STATISTICSBOOK - RS AGGARWALCHAPTER - STATISTICSEXERCISE - EXERCISE 30D
5 Videos
- STATISTICSBOOK - RS AGGARWALCHAPTER - STATISTICSEXERCISE - EXERCISE 30A
18 Videos
- SOME SPECIAL SERIESBOOK - RS AGGARWALCHAPTER - SOME SPECIAL SERIESEXERCISE - EXERCISE 13B (Very short Answer Questions)
9 Videos
- STRAIGHT LINES BOOK - RS AGGARWALCHAPTER - STRAIGHT LINES EXERCISE - EXERCISE 20K
10 Videos
Similar Questions
If the standard deviation of the numbers 2, 3, a and 11 is 3.5, then which of the following is true ? (1) 3a2−26a+55=0 (2) 3a2−32a+84=0 (3) 3a2−34a+91=0 (4) 3a2−23a+44=0
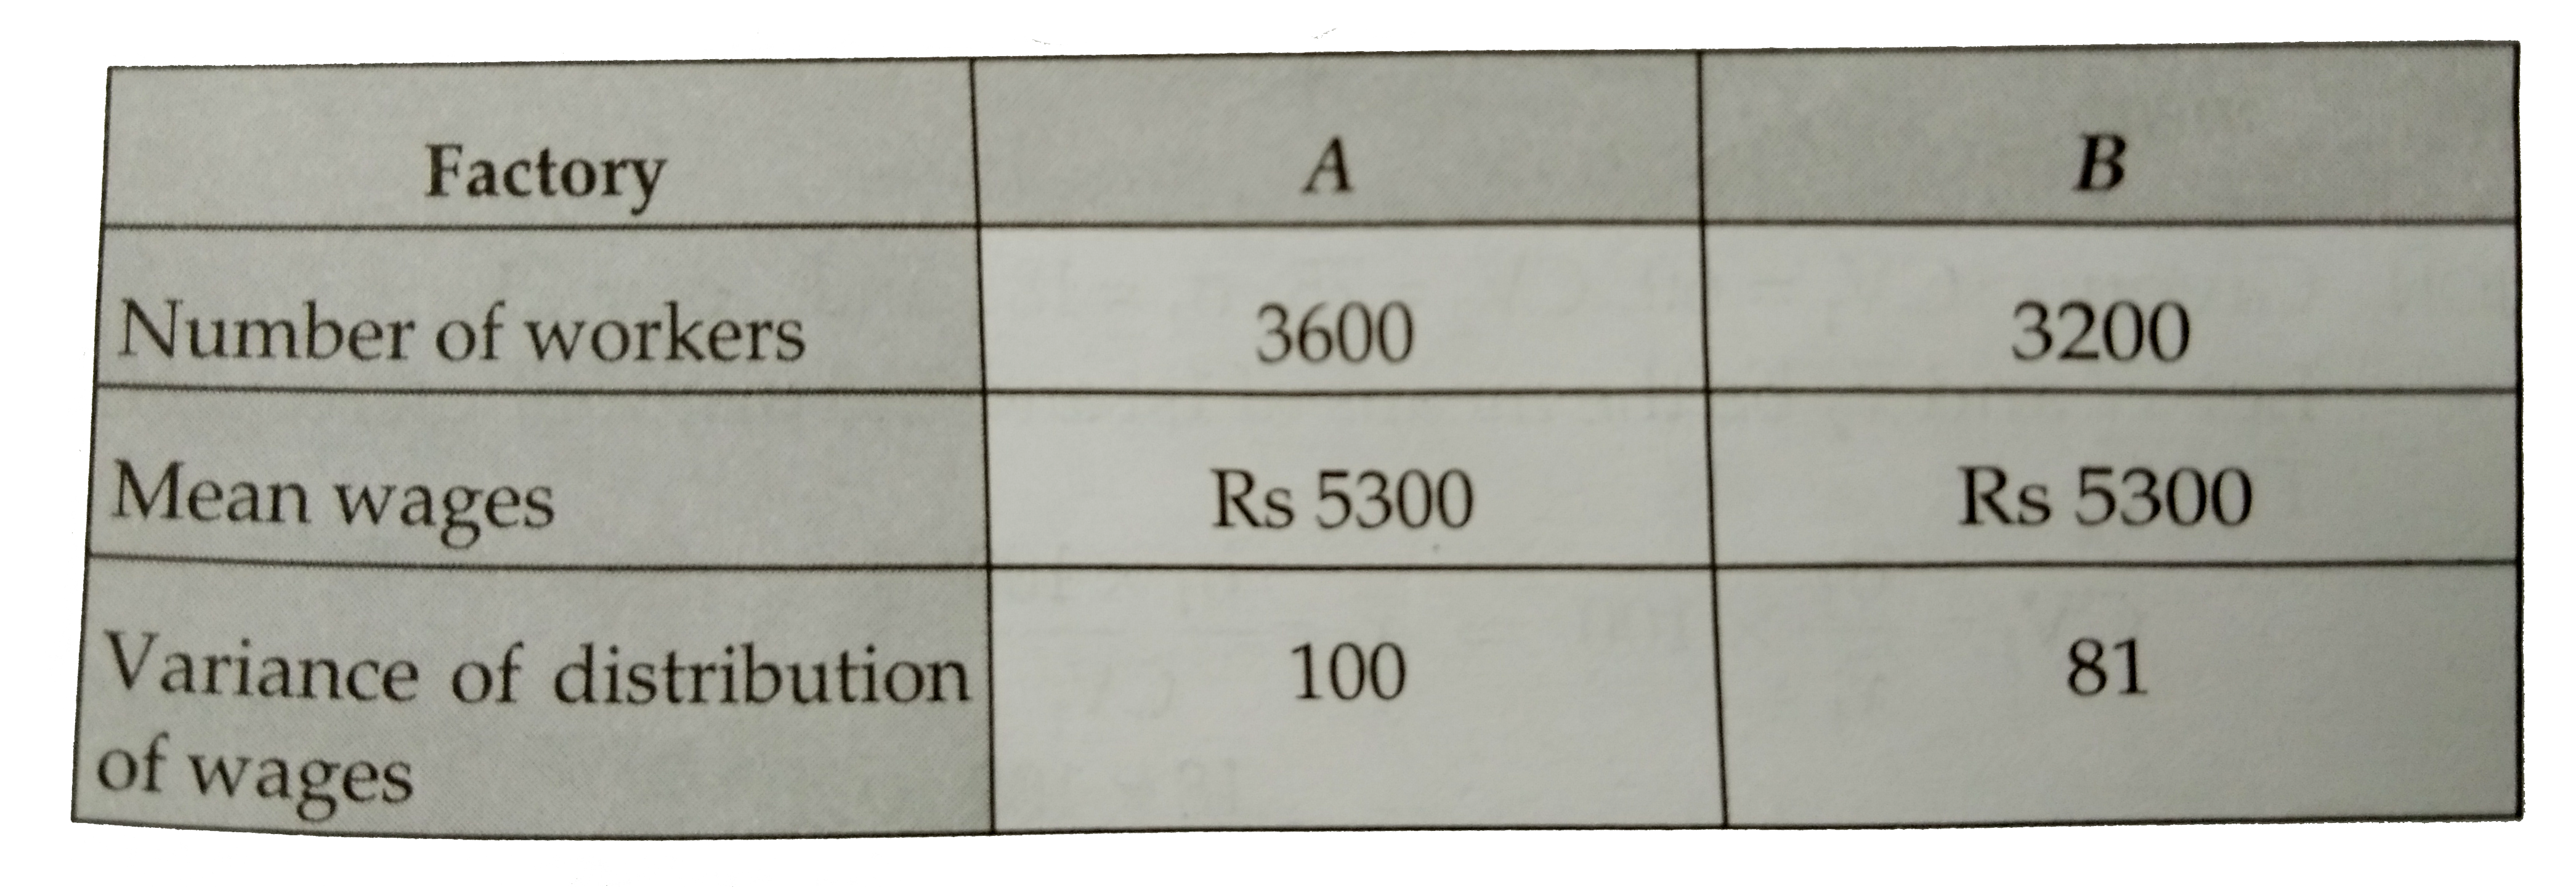
View SolutionThe following results show the number of workers and the wages paid to them in two factories F1andF2.

Which factory has more variation in wages?
View SolutionFind the mean deviation about the mean for the following data :
Find the mean deviation about the mean for the following data :
7,8,4,13,9,5,16,18
View SolutionFind the sum (2+4+6+8+…+100).
View SolutionFind the equation of the line drawn through the point of intersection of the lines x−2y+3=0and2x−3y+4=0 and passing through the point (4,-5).
View SolutionWhich of the following are correct chain isomers of butane ? (i)
View SolutionDetermine the point of symmetry of a regular hexagon.
View SolutionDtermine the images of the following figure about the given line :
View SolutionMatch the following Column A to Column B

View SolutionMatch the following Column A to Column B

View SolutionMatch the following Column A to Column B

View SolutionFind the area of figure given below.

View SolutionFind the perimeter of the figure given below.

View SolutionFind the area of the figure given below.

View SolutionThe inequation represented by the graph given below is :
View SolutionThe inequation that best describes the graph given below is _________
View Solution
