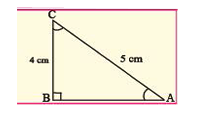
Check and discuss the above relations in the case of angle between 0∘and90∘ whether they hold for these angles or not?
 Solution in Bengali
Step by step video & image solution for Check and discuss the above relations in the case of angle between 0^(@) and 90 ^(@) whether they hold for these angles or not? by Maths experts to help you in doubts & scoring excellent marks in Class 10 exams.
Updated on:21/07/2023Topper's Solved these Questions
- TRIGONOMETRY BOOK - NCERT BANGLISHCHAPTER - TRIGONOMETRY EXERCISE - Exercise -11.1
8 Videos
- TRIGONOMETRY BOOK - NCERT BANGLISHCHAPTER - TRIGONOMETRY EXERCISE - Exercise -11.2
13 Videos
- TRIGONOMETRY BOOK - NCERT BANGLISHCHAPTER - TRIGONOMETRY EXERCISE - TRY THIS
8 Videos
- TANGENTS AND SECANTS TO A CIRCLEBOOK - NCERT BANGLISHCHAPTER - TANGENTS AND SECANTS TO A CIRCLEEXERCISE - Try this
5 Videos
Similar Questions
In right angle triangle ABC, 8cm ,15 cm and 17 cm are the length of AB,BC and CA respectively , Then find sinA,cosAandtanA.
View SolutionEvaluate the following
sin45∘+cos45∘
View SolutionWrite length of "Hypotenuse ","Opposite side "and "Adjacent side "for the given angles in the given triangles.
1. Foa angle C
. For angle A

View SolutionDraw a circle with radius 3.5cm and draw a tangent at any point on the circle.
View SolutionHow many lines of symmetry does the above figure have ?
View SolutionWhich of the following are correct chain isomers of butane ? (i)
View SolutionDetermine the point of symmetry of a regular hexagon.
View SolutionDtermine the images of the following figure about the given line :
View SolutionIn the figure above (not to scale), ¯¯¯¯¯¯AB⊥¯¯¯¯¯¯CDandAD is the bisector of ∠BAE.AB=3cm and AC=5cm. Find CD.
View SolutionMatch the following Column A to Column B

View SolutionMatch the following Column A to Column B

View SolutionMatch the following Column A to Column B

View SolutionThe inequation represented by the graph given below is :
View SolutionThe inequation that best describes the graph given below is _________
View SolutionThe inequation that best describes the following graph is _________
View SolutionWhich inequations represent the shaded region in the given figure
View Solution
