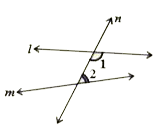
In the adjacent figure, a line n falls on lines 1 and m such that the sum of the interior angles 1 and 2 is less than 180°, then what can you say about lines 1 and m.
 Solution in Tamil
The correct Answer is:Lines intersect on the side of the angle less than 180∘
Step by step video, text & image solution for In the adjacent figure, a line n falls on lines 1 and m such that the sum of the interior angles 1 and 2 is less than 180°, then what can you say about lines 1 and m. by Maths experts to help you in doubts & scoring excellent marks in Class 9 exams.
Topper's Solved these Questions
- BOOK - NCERT TAMILCHAPTER - THE ELEMENTS OF GEOMETRY EXERCISE - BRAIN TEASER2videos
THE ELEMENTS OF GEOMETRY
- BOOK - NCERT TAMILCHAPTER - THE ELEMENTS OF GEOMETRY EXERCISE - TRY THIS1videos
THE ELEMENTS OF GEOMETRY
- BOOK - NCERT TAMILCHAPTER - SURFACE AREAS AND VOLUMES EXERCISE - EXERCISE 10.412videos
SURFACE AREAS AND VOLUMES
- BOOK - NCERT TAMILCHAPTER - TRIANGLES EXERCISE - EXERCISE - 7.47videos
TRIANGLES
Similar Questions
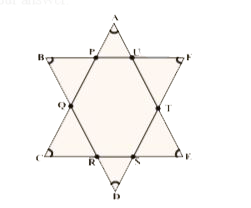
What is the measure of ∠A+∠B+∠C+∠D+∠E+∠F in the figure given below. Give reason to your answer.
 01:37View Solution
Can you give any two axioms from your daily life.
02:11View SolutionThe radius of sphere is 3.5cm Find its surface area and volume .
02:07View SolutionShow that in a right angled triangle, the hypotenuse is the longest side.
01:31View SolutionHow many lines of symmetry does the above figure have ?
02:45View SolutionDetermine the point of symmetry of a regular hexagon.
02:17View SolutionComplete adjectant figure so that X-axis and Y-axis are the lines of symmetry of the completed figure.
05:41View SolutionDtermine the images of the following figure about the given line :
02:10View SolutionMatch the following Column A to Column B
 02:17View Solution
Match the following Column A to Column B
 02:10View Solution
Match the following Column A to Column B
 01:59View Solution
The inequation represented by the graph given below is :
01:19View SolutionThe inequation that best describes the graph given below is _________
01:58View SolutionThe inequation that best describes the following graph is _________
02:59View SolutionThe equation of straight line shown in figure is :
ltimg src="https://d10lpgp6xz60nq.cloudfront.net/physics_images/ALN_PHY_R04_E01_020_Q01.png" width="80%"gt03:42View Solution

