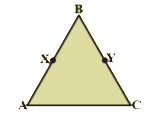
In the adjacent figure, we have BX=12AB,BY=12BC and AB=BC. Show that BX = BY.
 Solution in Tamil
Step by step video & image solution for In the adjacent figure, we have BX = 1/2 AB, BY = 1/2 BC and AB=BC. Show that BX = BY. by Maths experts to help you in doubts & scoring excellent marks in Class 9 exams.
Updated on:21/07/2023Topper's Solved these Questions
- THE ELEMENTS OF GEOMETRY BOOK - NCERT TAMILCHAPTER - THE ELEMENTS OF GEOMETRY EXERCISE - BRAIN TEASER
2 Videos
- THE ELEMENTS OF GEOMETRY BOOK - NCERT TAMILCHAPTER - THE ELEMENTS OF GEOMETRY EXERCISE - TRY THIS
1 Videos
- SURFACE AREAS AND VOLUMES BOOK - NCERT TAMILCHAPTER - SURFACE AREAS AND VOLUMES EXERCISE - EXERCISE 10.4
12 Videos
- TRIANGLES BOOK - NCERT TAMILCHAPTER - TRIANGLES EXERCISE - EXERCISE - 7.4
7 Videos
Similar Questions
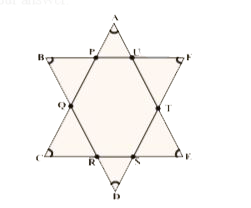
What is the measure of ∠A+∠B+∠C+∠D+∠E+∠F in the figure given below. Give reason to your answer.

View SolutionCan you give any two axioms from your daily life.
View SolutionThe radius of sphere is 3.5cm Find its surface area and volume .
View SolutionShow that in a right angled triangle, the hypotenuse is the longest side.
View SolutionHow many lines of symmetry does the above figure have ?
View SolutionDetermine the point of symmetry of a regular hexagon.
View SolutionDtermine the images of the following figure about the given line :
View SolutionIn the figure above (not to scale), ¯¯¯¯¯¯AB⊥¯¯¯¯¯¯CDandAD is the bisector of ∠BAE.AB=3cm and AC=5cm. Find CD.
View SolutionIn the following figure, AB and BC are equidistant from the centre 'O' of the Show that
(a) ABC is an isosceles triangle.
(b) OB bisects angle ABC.
ltimg src="https://d10lpgp6xz60nq.cloudfront.net/physics_images/PS_MATH_X_C13_E02_006_Q01.png" width="80%"gt
View SolutionMatch the following Column A to Column B

View SolutionMatch the following Column A to Column B

View SolutionMatch the following Column A to Column B

View SolutionThe inequation represented by the graph given below is :
View SolutionThe inequation that best describes the graph given below is _________
View SolutionThe inequation that best describes the following graph is _________
View Solution
