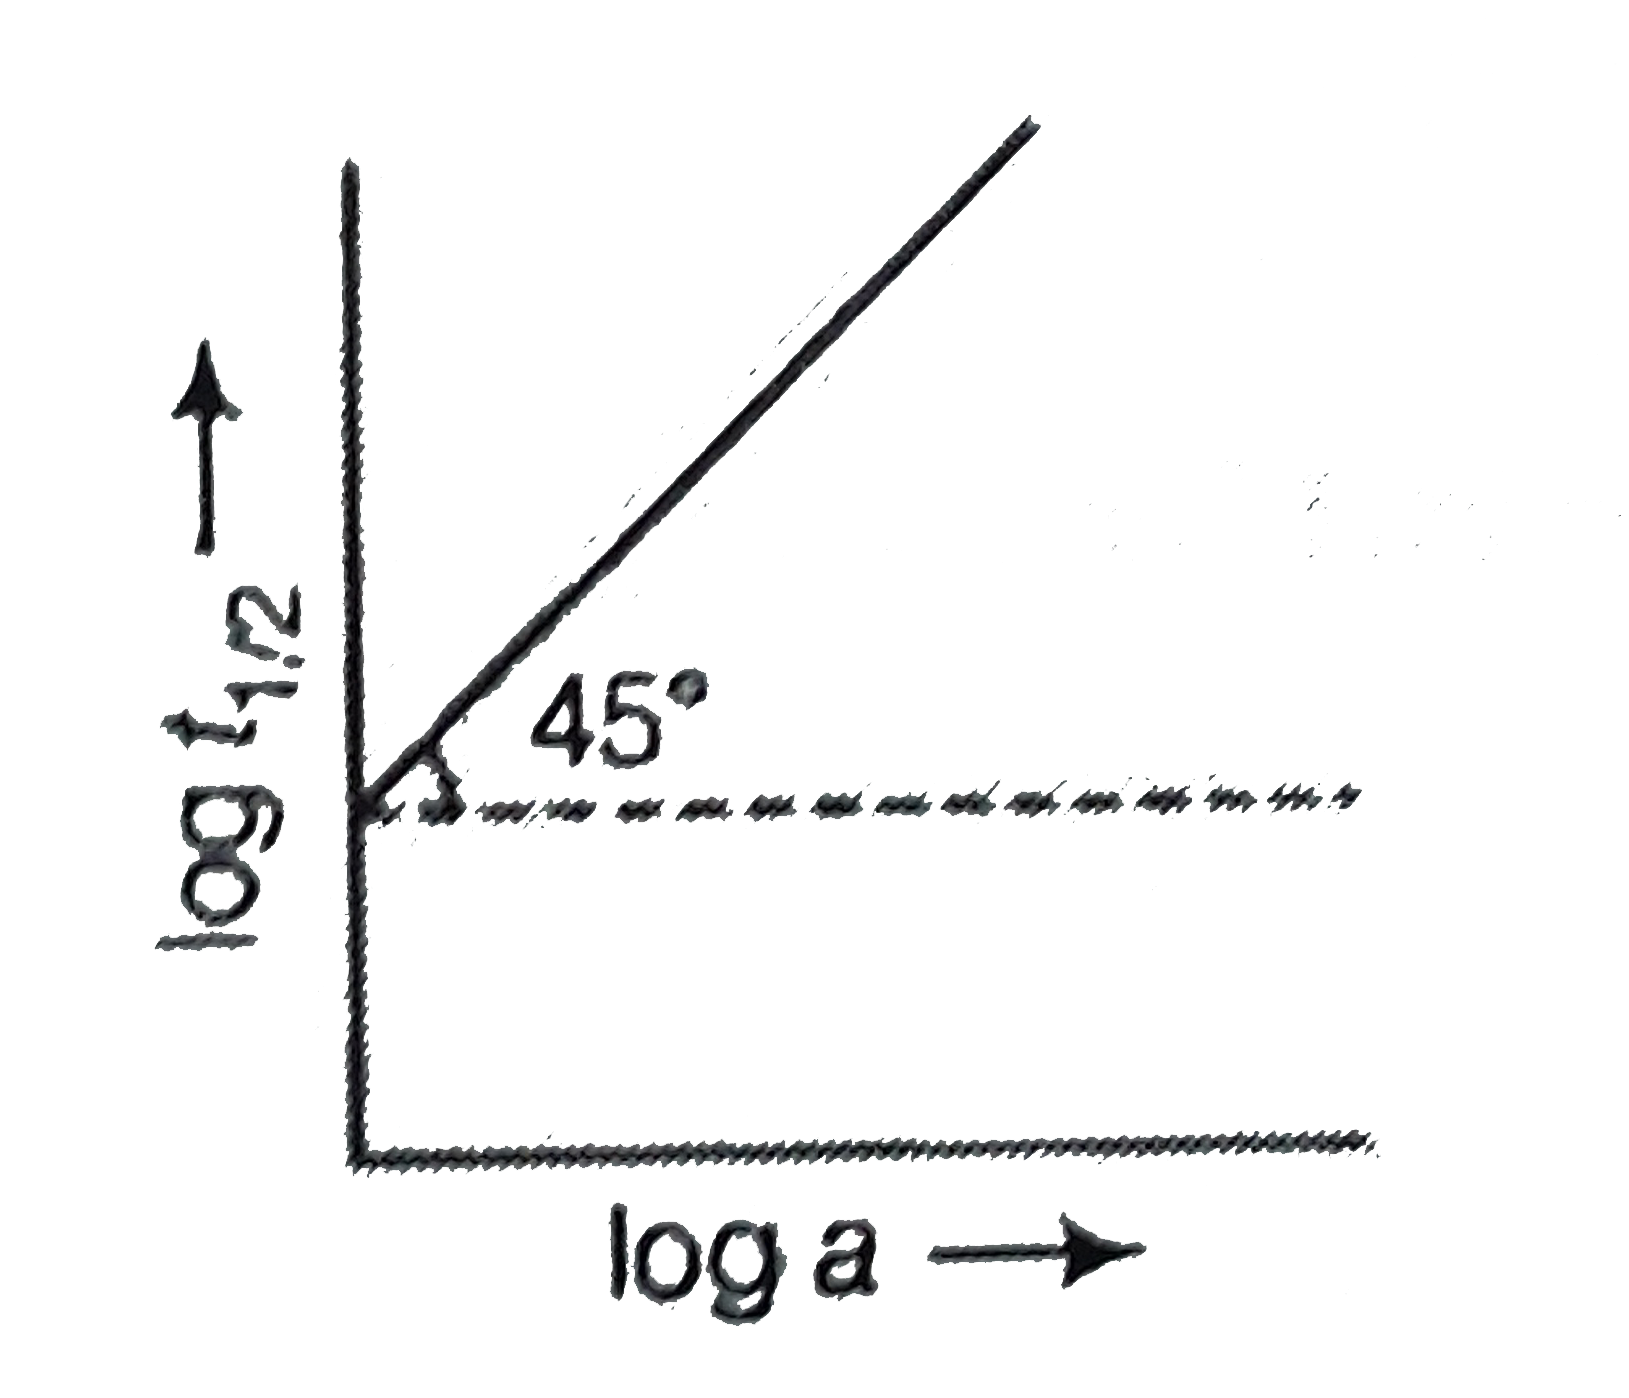
Following is the graph between log T50 and log a (a = initial concentration) for a given reaction at 27∘C.

Hence, order is
Video Solution
Text Solution
The correct Answer is:0
t1/2∝1an−10⇒t1/2k=1an−10
log t1/2 = log k - (n-1) log a0
tan 45∘=−(n−1)=−(0−1)
tan 45∘=1 ∴n=0
|
Topper's Solved these Questions
- CHEMICAL KINETICS BOOK - ERRORLESS CHAPTER - CHEMICAL KINETICS EXERCISE - JEE (Advanced ) 2018
1 Videos
- CHEMICAL KINETICS BOOK - ERRORLESS CHAPTER - CHEMICAL KINETICS EXERCISE - JEE SECTION (Comprehension type questions )
2 Videos
- CHEMICAL EQULIBRIUMBOOK - ERRORLESS CHAPTER - CHEMICAL EQULIBRIUMEXERCISE - JS JEE SECTION (ONLY ONE CHOICE ANSWER (Matrix)
1 Videos
- CHEMISTRY IN EVERYDAY IN LIFEBOOK - ERRORLESS CHAPTER - CHEMISTRY IN EVERYDAY IN LIFEEXERCISE - Critical Thinking (Objective question )
25 Videos
Similar Questions
Knowledge Check
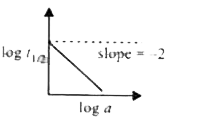
A graph between log t1/2 and log a (abscissa), a being the initial concentration of A in the reaction A → product, is depicted in the figure. The rate law is
 A−d[A]dt=kB−d[A]dt=k[A]C−d[A]dt=k[A]2D−d[A]dt=k[A]3
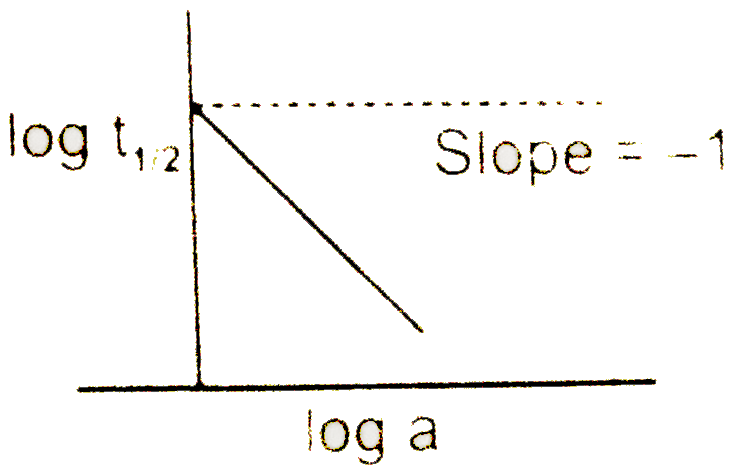
A graph between logt12 and log a (abscissa), a being the initial concentration of A in the reaction For reaction A→Product, the rate law is :
 A−d[A]dt=KB−d[A]dt=K[A]C−d[A]dt=K[A]2D−d[A]dt=K[A]3
A graph between logt12 and log a (abscissa), a being the initial concentration of A in the reaction For reaction A→Product, the rate law is :
 A−d[A]dt=kB−d[A]dt=k[A]C−d[A]dt=k[A]2D−d[A]dt=k[A]3
What is the type of graph between log P and log V at constant temperature?
View SolutionWhat is the type of graph between log P and log(1V) at constant temperature for a given amount of gas ?
View SolutionThe graph between log R and log A wher R is the nuclear radius and A is the mass of is.
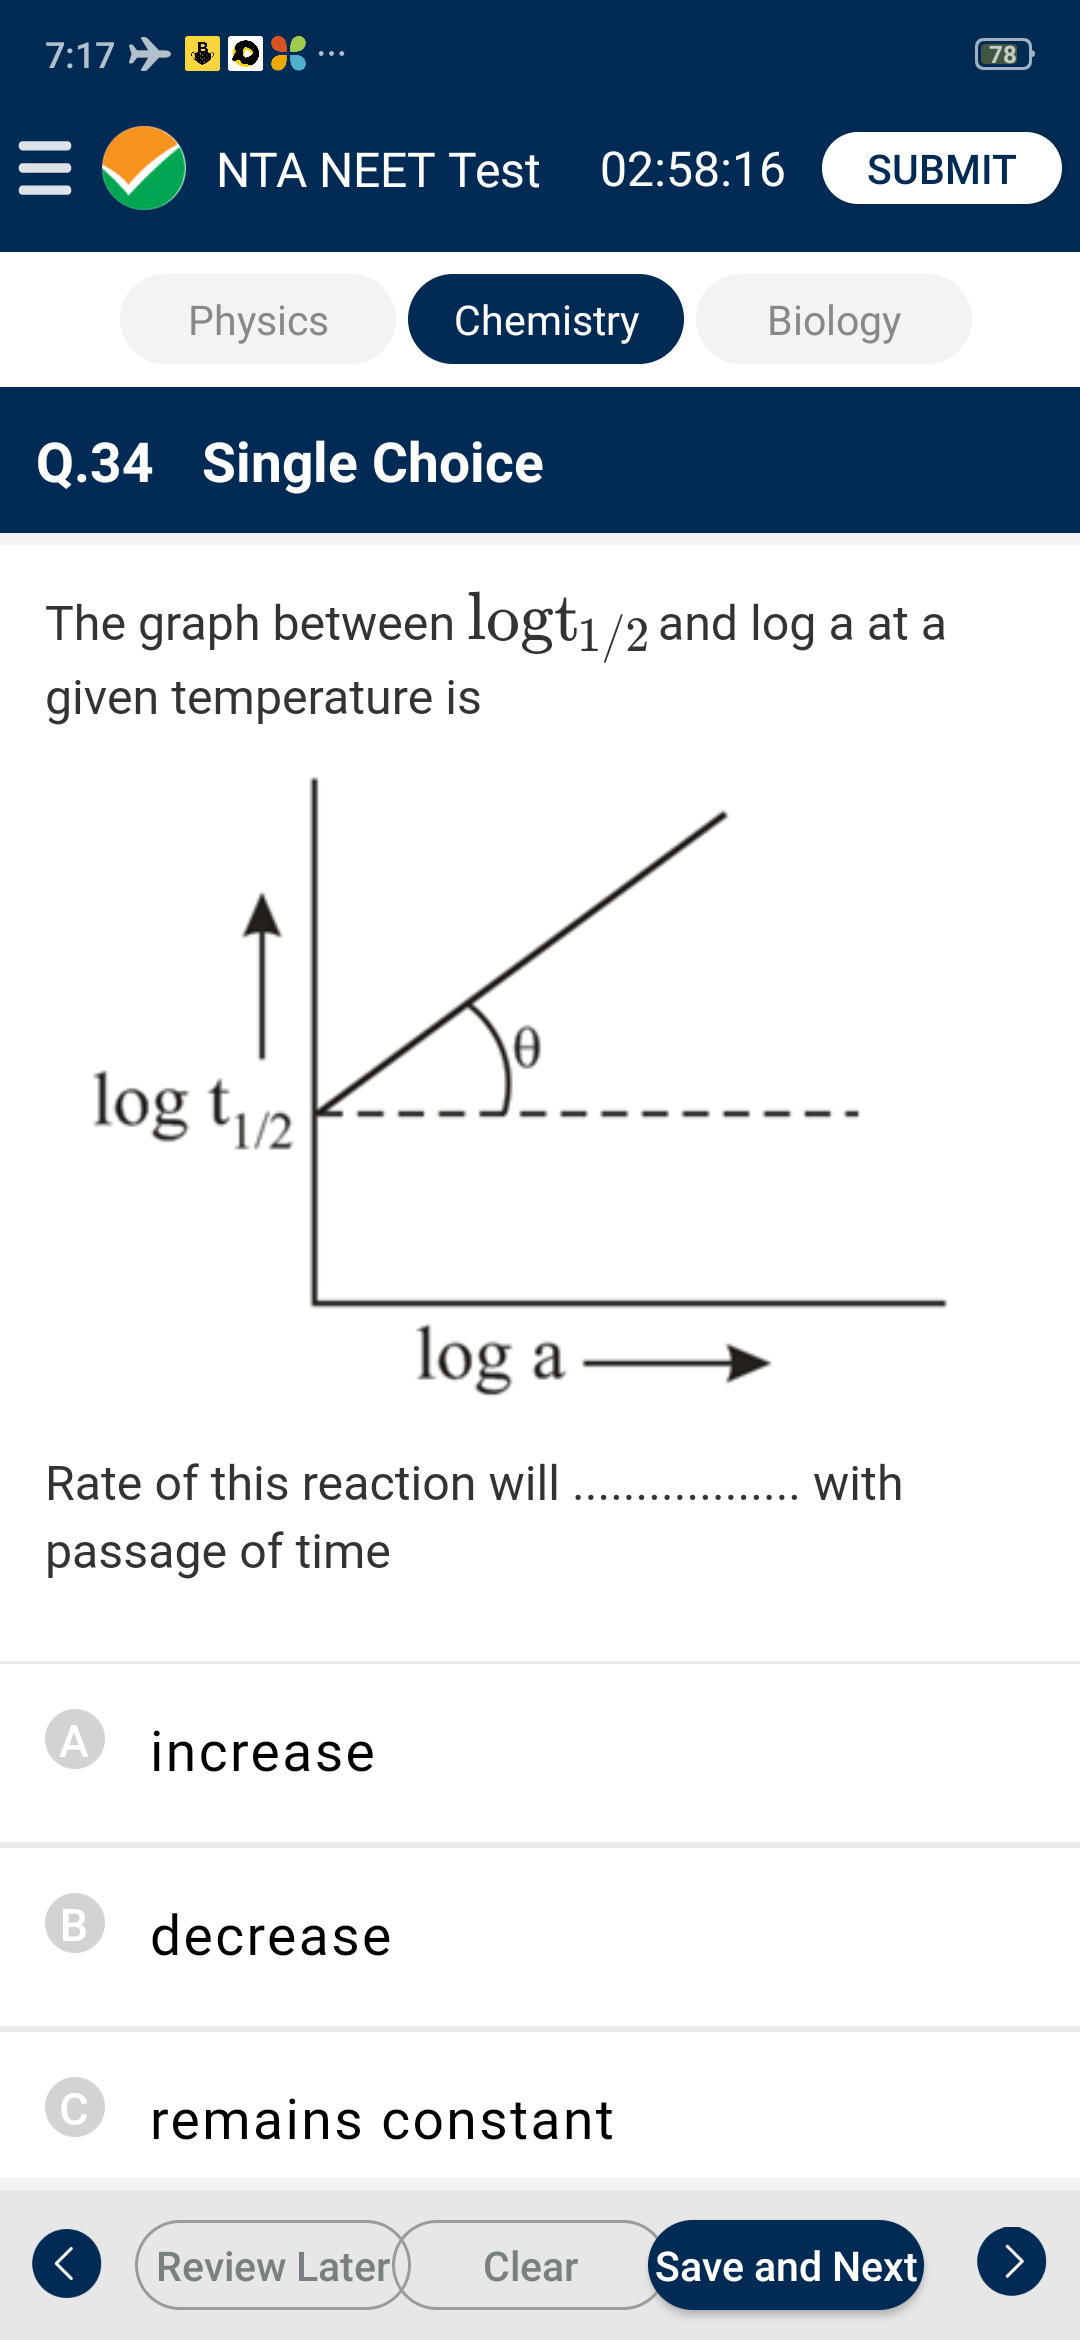
View SolutionThe graph between log t1/2 and log a at a given temperature is

Rate of this reaction will …….with passage of time
View SolutionA graph plotted between logt50% vs log concentration in a straight line. What conclusion can you draw from this graph?

View Solution

