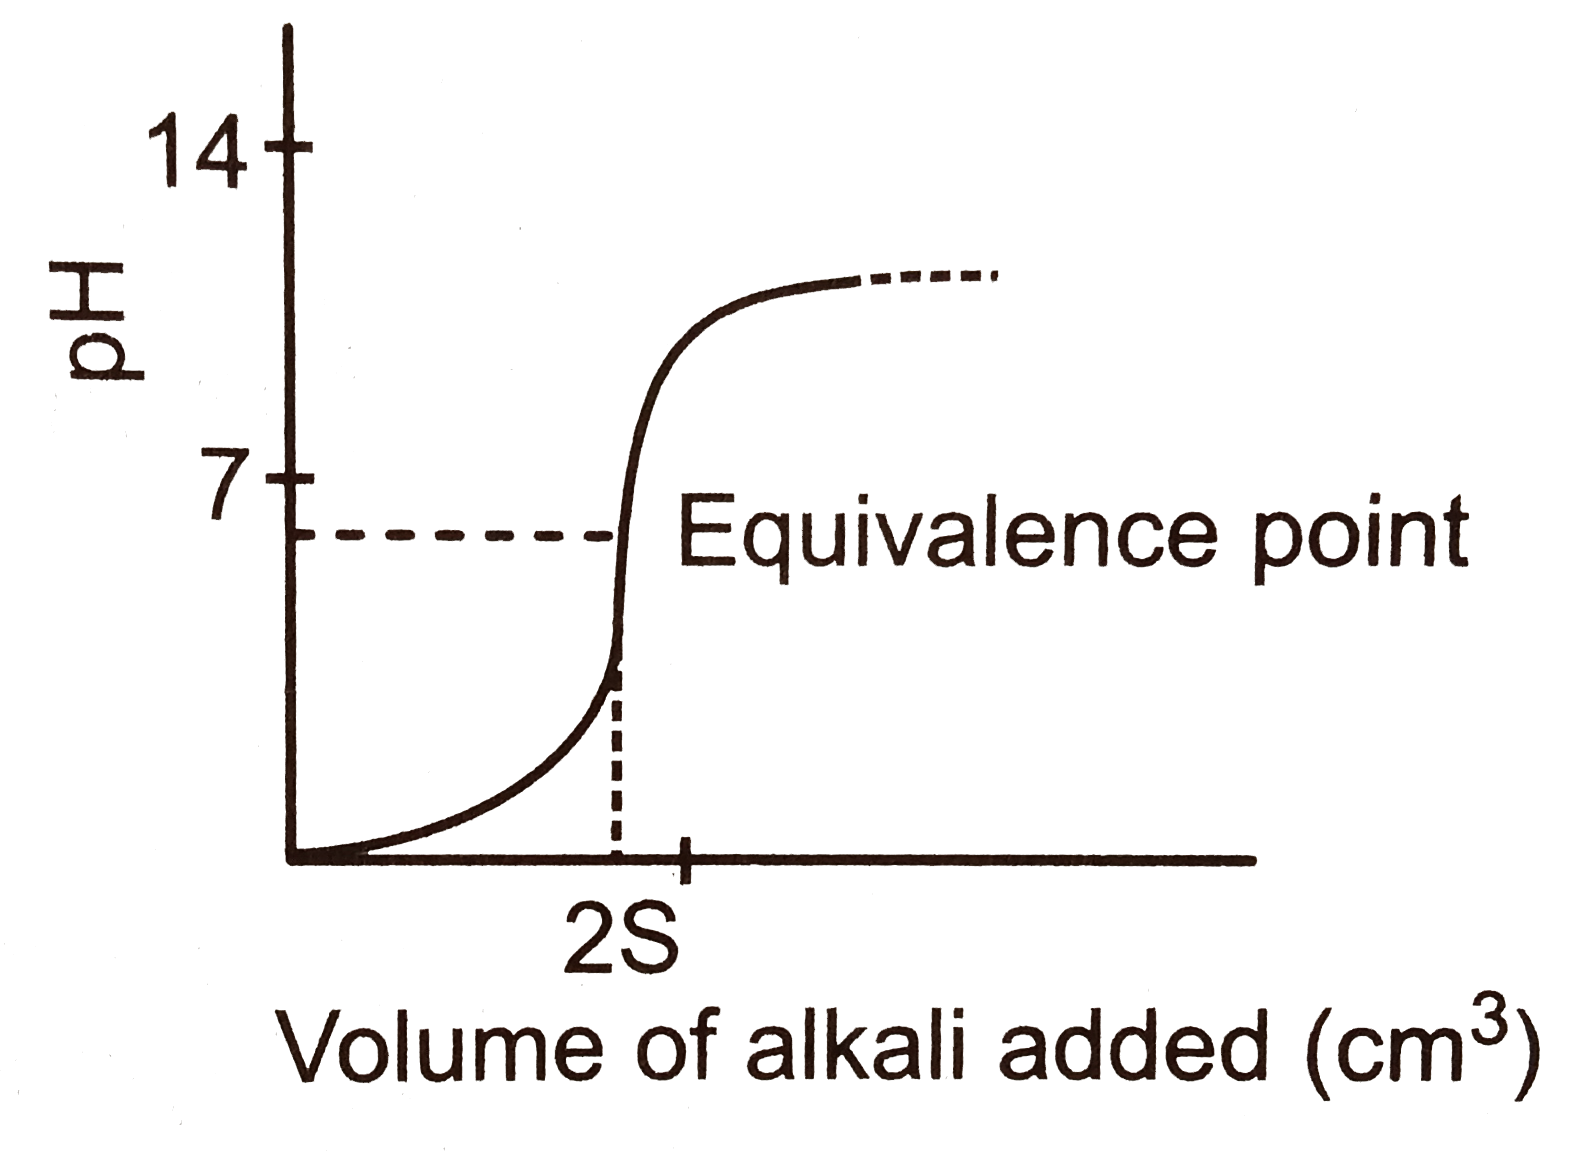
Which of the following plot represents the graph of pH against volume of alkali added in the titration of NaOH and HCl
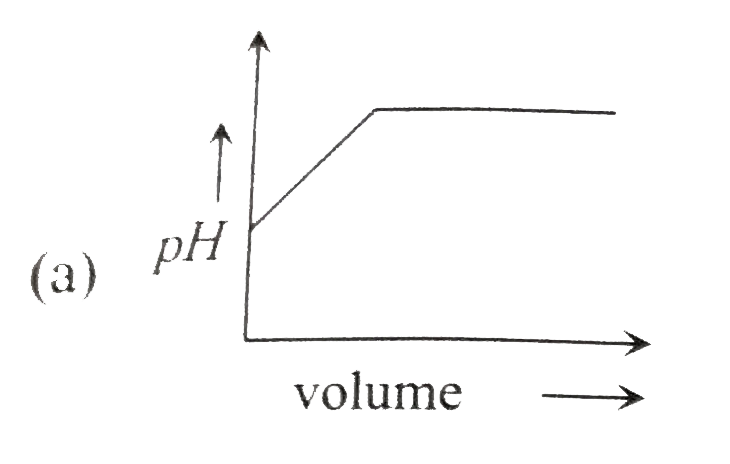
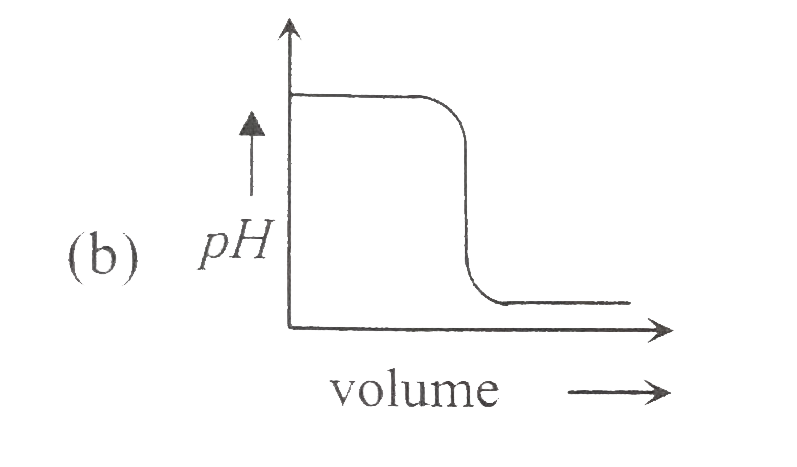
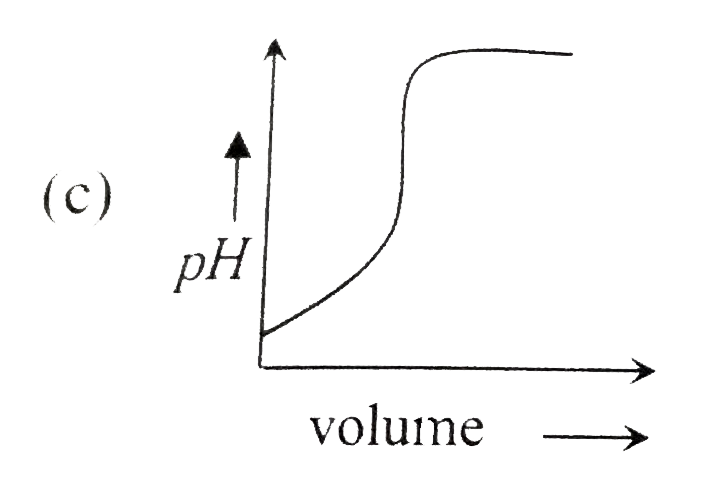
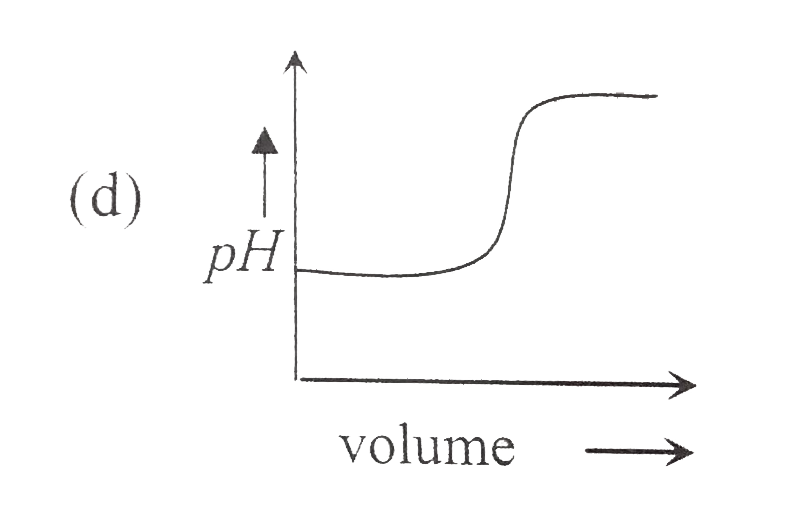
The correct Answer is:C
To determine which plot represents the graph of pH against the volume of alkali added in the titration of NaOH and HCl, we need to understand the behavior of pH during this titration process.
1. Identify the Reaction:
- The titration involves a strong acid (HCl) and a strong base (NaOH). The reaction can be represented as:
HCl+NaOH→NaCl+H2O
2. Understand the pH Scale:
- The pH scale ranges from 0 to 14. A pH of 7 is neutral, below 7 is acidic, and above 7 is basic.
3. Initial pH of HCl:
- Before any NaOH is added, the solution is acidic due to HCl. The pH will be less than 7, typically around 1-3 depending on the concentration of HCl.
4. Adding NaOH:
- As NaOH is gradually added, the pH will start to increase. Initially, the pH will rise slowly as the acid is neutralized.
5. Equivalence Point:
- At the equivalence point, where all the HCl has reacted with NaOH, the solution will be neutral, and the pH will be around 7.
6. Post-Equivalence:
- After the equivalence point, adding more NaOH will cause the pH to rise sharply above 7, indicating a basic solution.
7. Graph Characteristics:
- The graph of pH versus the volume of NaOH added will show a gradual increase in pH at first, followed by a steep rise around the equivalence point (pH = 7), and then a leveling off as more NaOH is added.
8. Identifying the Correct Plot:
- The correct plot will show a sharp increase in pH around the volume where the equivalence point occurs (between pH 4 and 7). It should not show a gradual slope throughout but rather a steep rise indicating the transition from acidic to neutral to basic.
Conclusion:
- The third option is the correct representation of the graph, as it shows the steep increase in pH around the equivalence point, indicating the transition from acidic to neutral to basic.
- The titration involves a strong acid (HCl) and a strong base (NaOH). The reaction can be represented as:
HCl+NaOH→NaCl+H2O
- The pH scale ranges from 0 to 14. A pH of 7 is neutral, below 7 is acidic, and above 7 is basic.
- Before any NaOH is added, the solution is acidic due to HCl. The pH will be less than 7, typically around 1-3 depending on the concentration of HCl.
- As NaOH is gradually added, the pH will start to increase. Initially, the pH will rise slowly as the acid is neutralized.
- At the equivalence point, where all the HCl has reacted with NaOH, the solution will be neutral, and the pH will be around 7.
- After the equivalence point, adding more NaOH will cause the pH to rise sharply above 7, indicating a basic solution.
- The graph of pH versus the volume of NaOH added will show a gradual increase in pH at first, followed by a steep rise around the equivalence point (pH = 7), and then a leveling off as more NaOH is added.
- The correct plot will show a sharp increase in pH around the volume where the equivalence point occurs (between pH 4 and 7). It should not show a gradual slope throughout but rather a steep rise indicating the transition from acidic to neutral to basic.
- The third option is the correct representation of the graph, as it shows the steep increase in pH around the equivalence point, indicating the transition from acidic to neutral to basic.
Topper's Solved these Questions
- ANALYTICAL CHEMISTRYBOOK - ERRORLESS CHAPTER - ANALYTICAL CHEMISTRYEXERCISE - Critical Thinking Objective Questions
20 Videos
- ANALYTICAL CHEMISTRYBOOK - ERRORLESS CHAPTER - ANALYTICAL CHEMISTRYEXERCISE - JEE Section (Reasoning Type Questions)
5 Videos
- ANALYTICAL CHEMISTRYBOOK - ERRORLESS CHAPTER - ANALYTICAL CHEMISTRYEXERCISE - Ordinary Thinking Objective Questions (Wet Test for Basic Radical)
71 Videos
- ALDEHYDES AND KETONES BOOK - ERRORLESS CHAPTER - ALDEHYDES AND KETONES EXERCISE - JEE Section (JEE (Advanced) 2018) Numeric answer type question
1 Video
- BIOMOLECULES AND POLYMERBOOK - ERRORLESS CHAPTER - BIOMOLECULES AND POLYMEREXERCISE - Jee section (Jee (Advanced 2018)) (More than one choice correct answer)
1 Video
Similar Questions
Which of the following diagram correctly represent variation of pH of a solution of NH4OH by addition of increasing quantity (volume in ml) of a known HCl solution?
View SolutionWhich of the following pH curve represent the titration of weak acid and strong base (dotted line show equivalence point)?
View Solution
Knowledge Check
The following graph represents the titration of pH vs volume
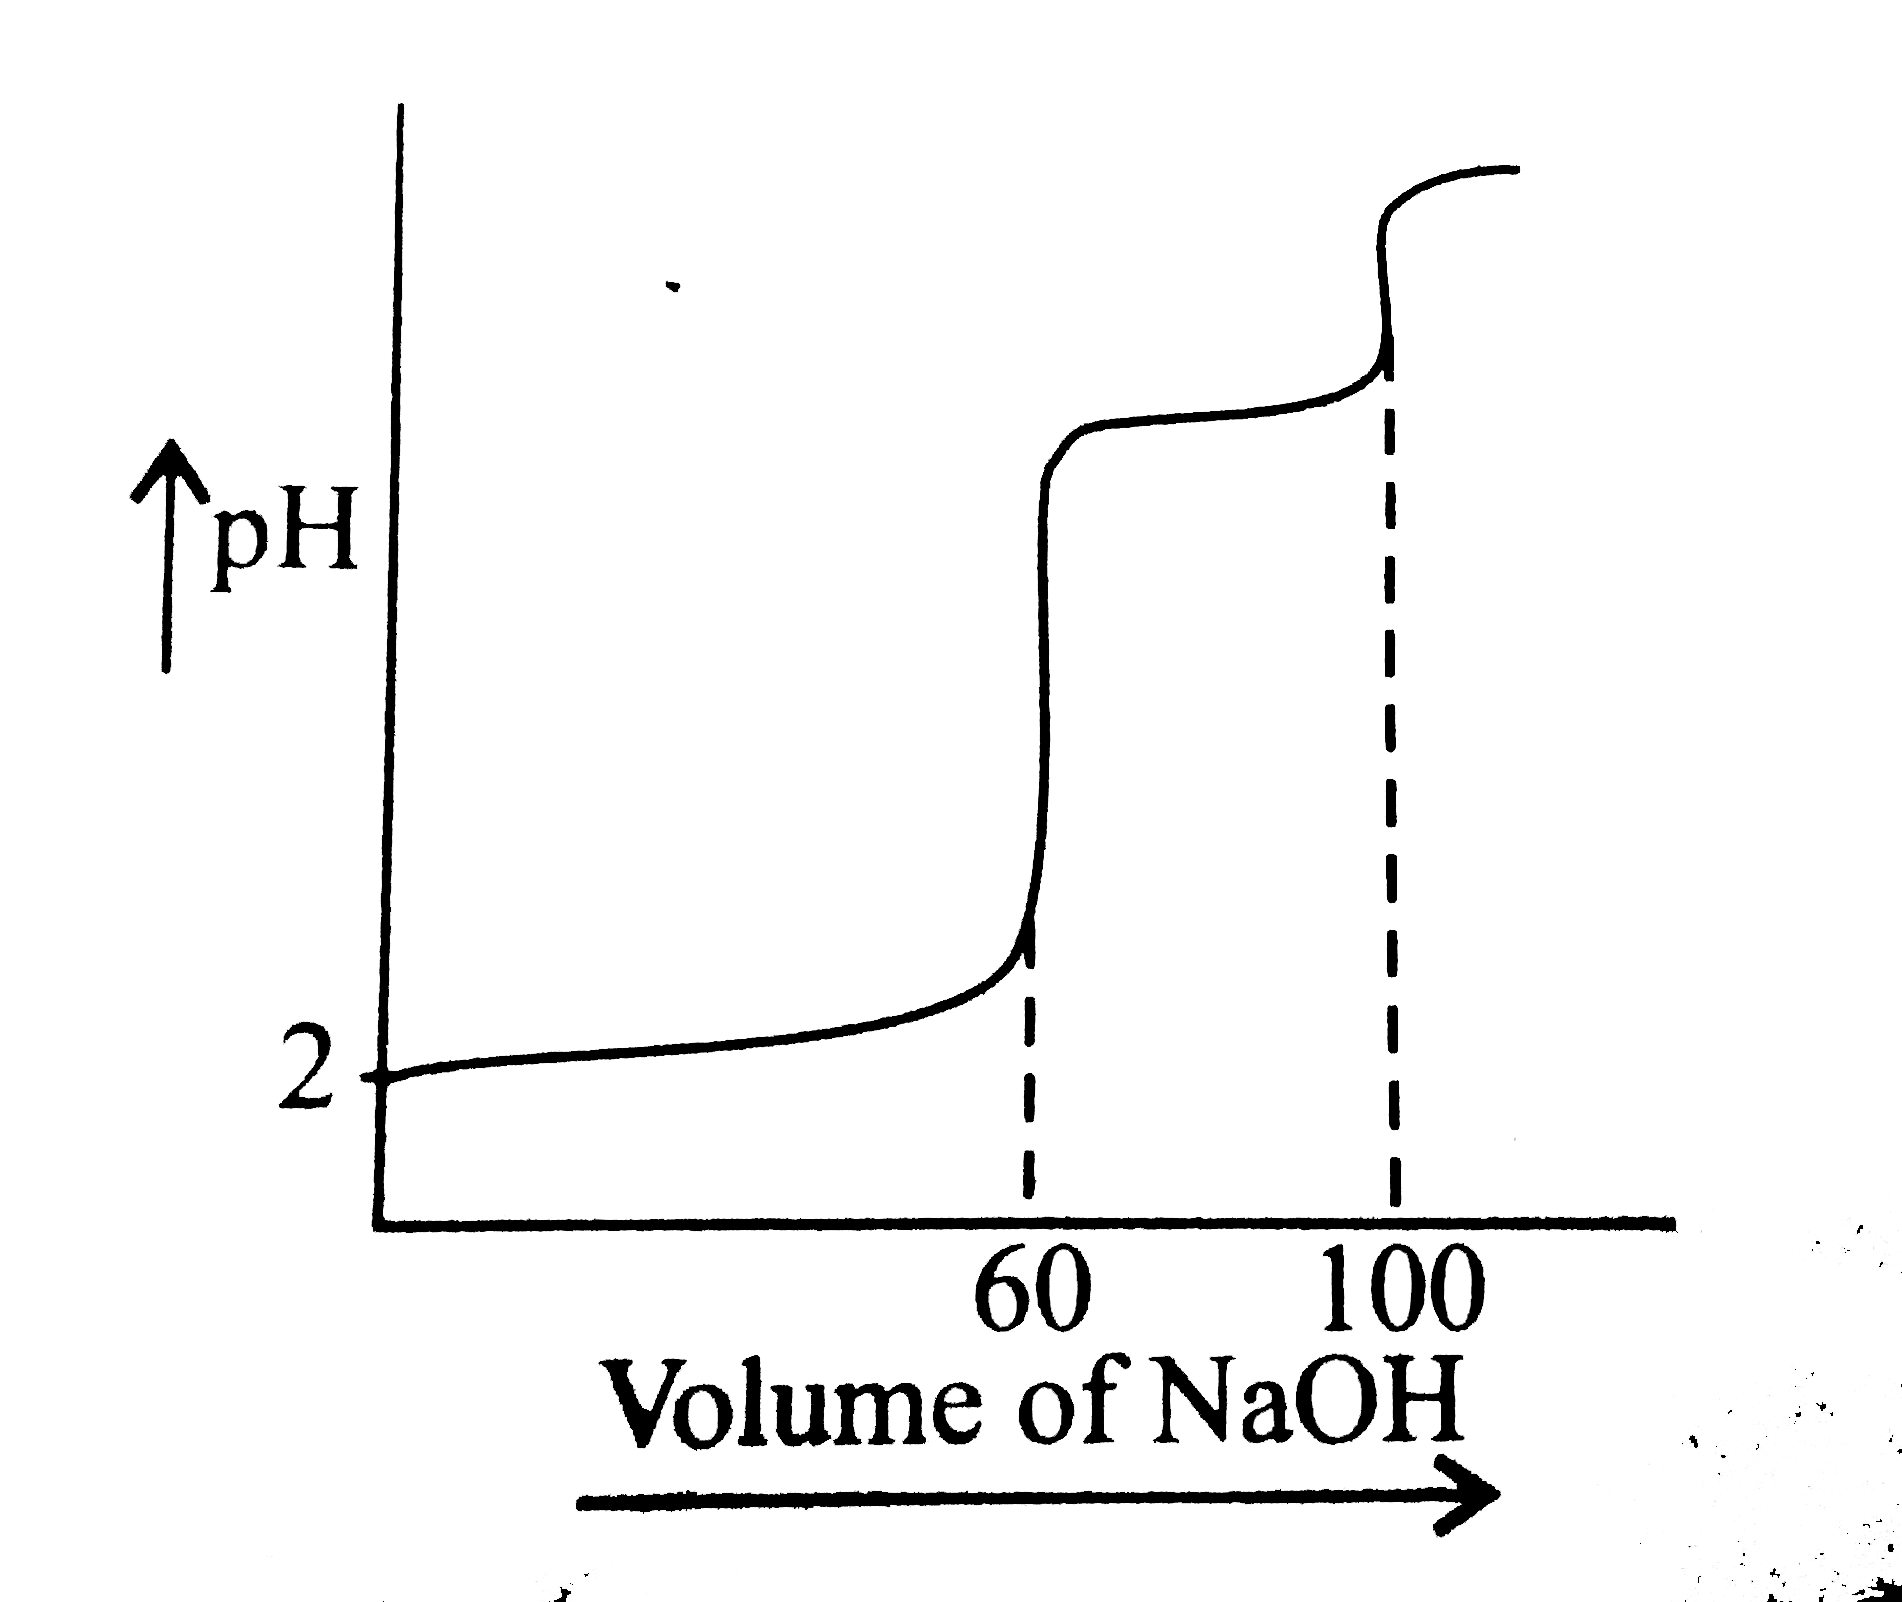 AA diprotic acid.BTwo monoprotic acids with the same Ka but different concentrations.CTwo monoprotic acids with different Ka but the same concentration.DTwo monoprotic acids with differnet Ka and different concentartions.
which one of the following curves represents the graph of pH during titration of NaOH and HCl (aq).?
A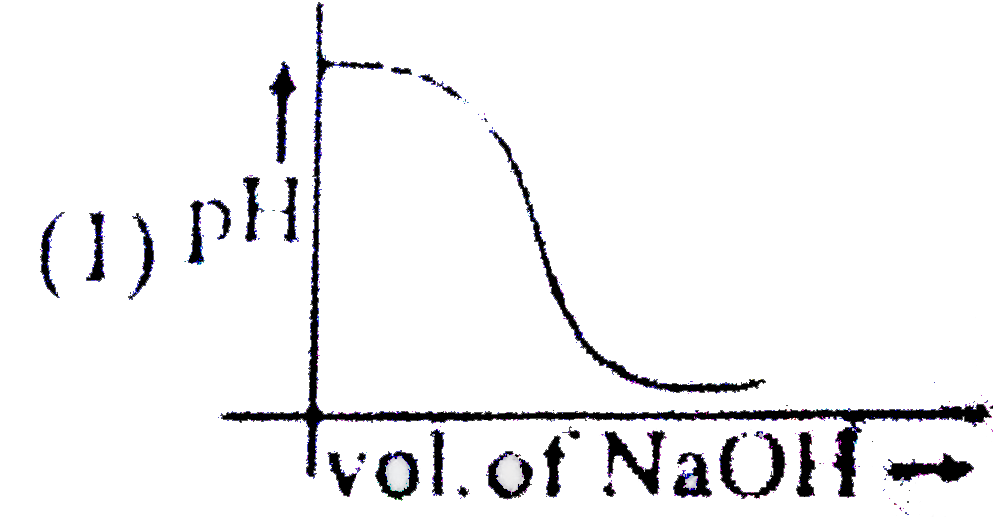 B
B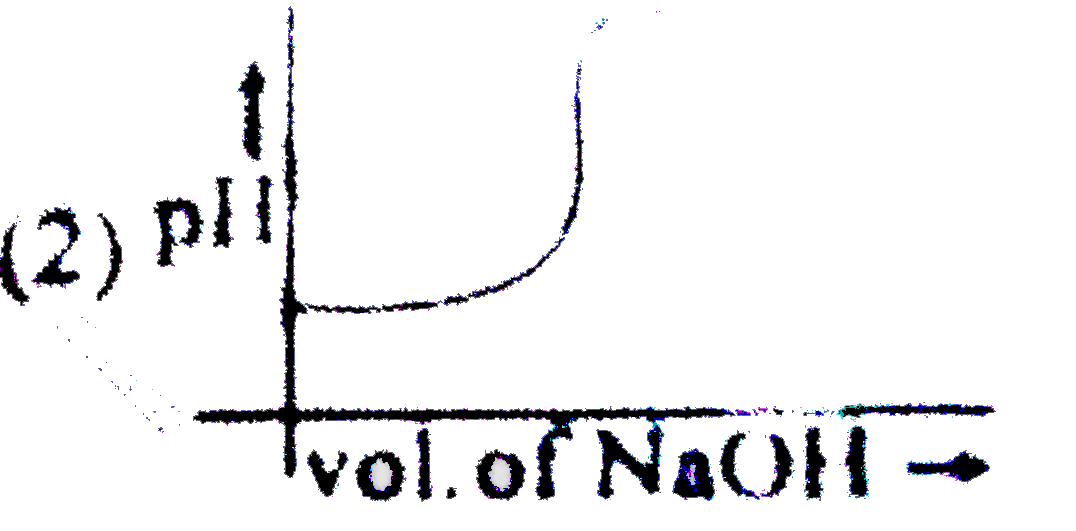 C
C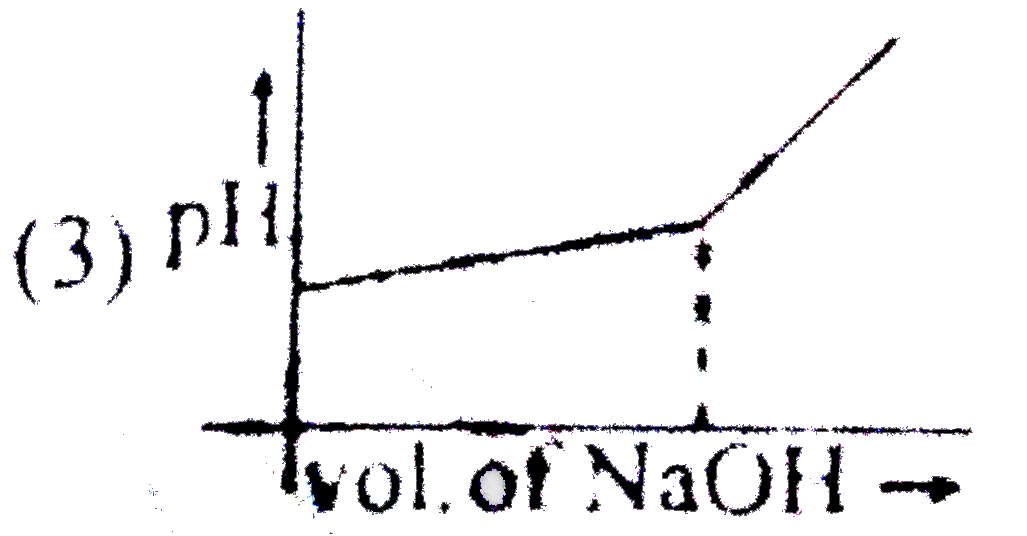 D
D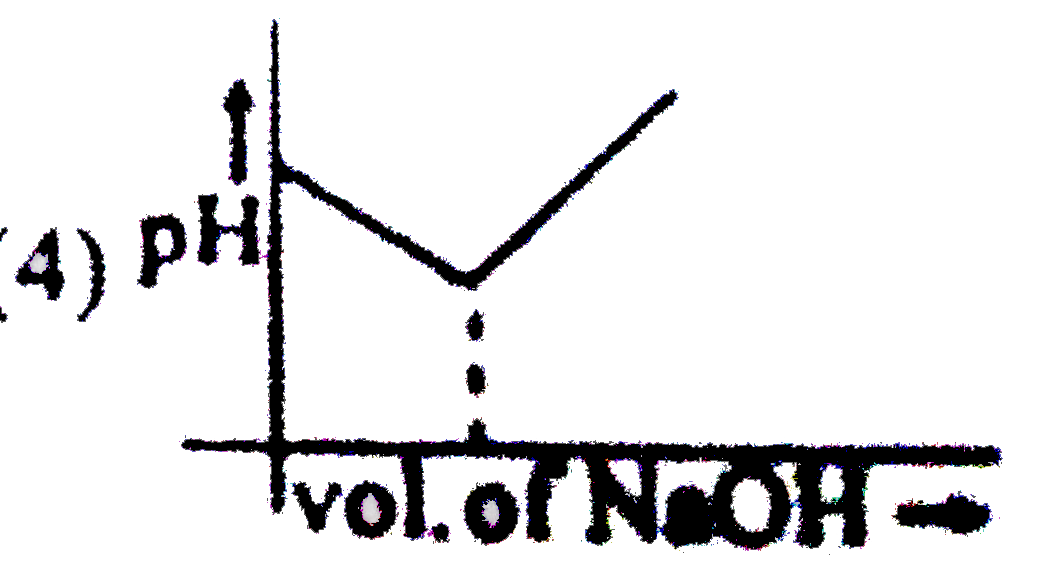
Which one of the following curves represents the graph pH during the titration of NaOH and HCl(aq)
A B
B C
C D
D
The graph represents the titration curve for :
View SolutionThe electricity conductivity of a solution serves as a means of determing the end point in a chemical reaction, involved in the titration of acids, bases, or precipitation. Which of the following conductometric titrations represent the curve of HClvsNH4OH
x− axis ⇒ Volume of alkali added
y− axis⇒ Conductivity
View SolutionWhich of the following plots will obtained for a conductomeric titration of strong acid against a weak base?
View SolutionFor a simple pendulum, a graph is plotted between itskinetic energy (KE) and potential energy (PE)against its displacement d. Which one of the following represents these correctly? (graph are schematic and not drawn to scale)
View SolutionWhich of the following statement is not correct about Lother Meyer's plot of atomic volume against atomic weight ?
View Solution