The following graph show the temprature of a patient in a hospital, recorded every hour, (a) What was the patient's temperature at 1 p.m.? *b) When was the patient's temperature 38.5∘C ? (j) The patient’s temperature was the same two times during the period given. What were these two times? (k) What was the temperature at 1.30 p.m.? How did you arrive at your answer? (l) During which periods did the patients’ temperature showed an upward trend?
(i) 36.5∘C
(ii) 12noon
(iii)1±&2±
(iv) 36.5∘C
(v) 9am to 11am or 2 pm to 3pm
answer
Topper's Solved these Questions
- INTRODUCTION TO GRAPHSBOOK - NCERTCHAPTER - INTRODUCTION TO GRAPHSEXERCISE - SOLVED EXAMPLES
8 Videos
- INTRODUCTION TO GRAPHSBOOK - NCERTCHAPTER - INTRODUCTION TO GRAPHSEXERCISE - EXERCISE 15.3
2 Videos
- FACTORISATIONBOOK - NCERTCHAPTER - FACTORISATIONEXERCISE - EXERCISE 14.4
21 Videos
- LINEAR EQUATIONS IN ONE VARIABLEBOOK - NCERTCHAPTER - LINEAR EQUATIONS IN ONE VARIABLEEXERCISE - EXERCISE 2.3
9 Videos
Similar Questions
The following graph shows the temperature of a patient in a hospital , recorded every hour.
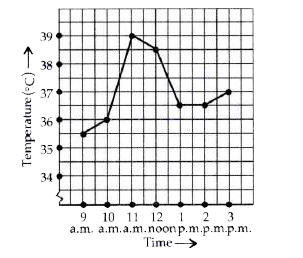
(a) What was the patient's temperature at 1 p.m. ?
(b) When was the patient's temperature 38.5∘C ?
(c ) The patient's temperature was the same two times during the period given. What were these two times?
(d) What was the temperature at 1.30 p.m.? How did you arrive at your answer?
(e) During which periods did the patient's temperature showed an upward trend?
View SolutionThe following table shows ages of 300 patients getting medical treatment in a hospital on a particular day:
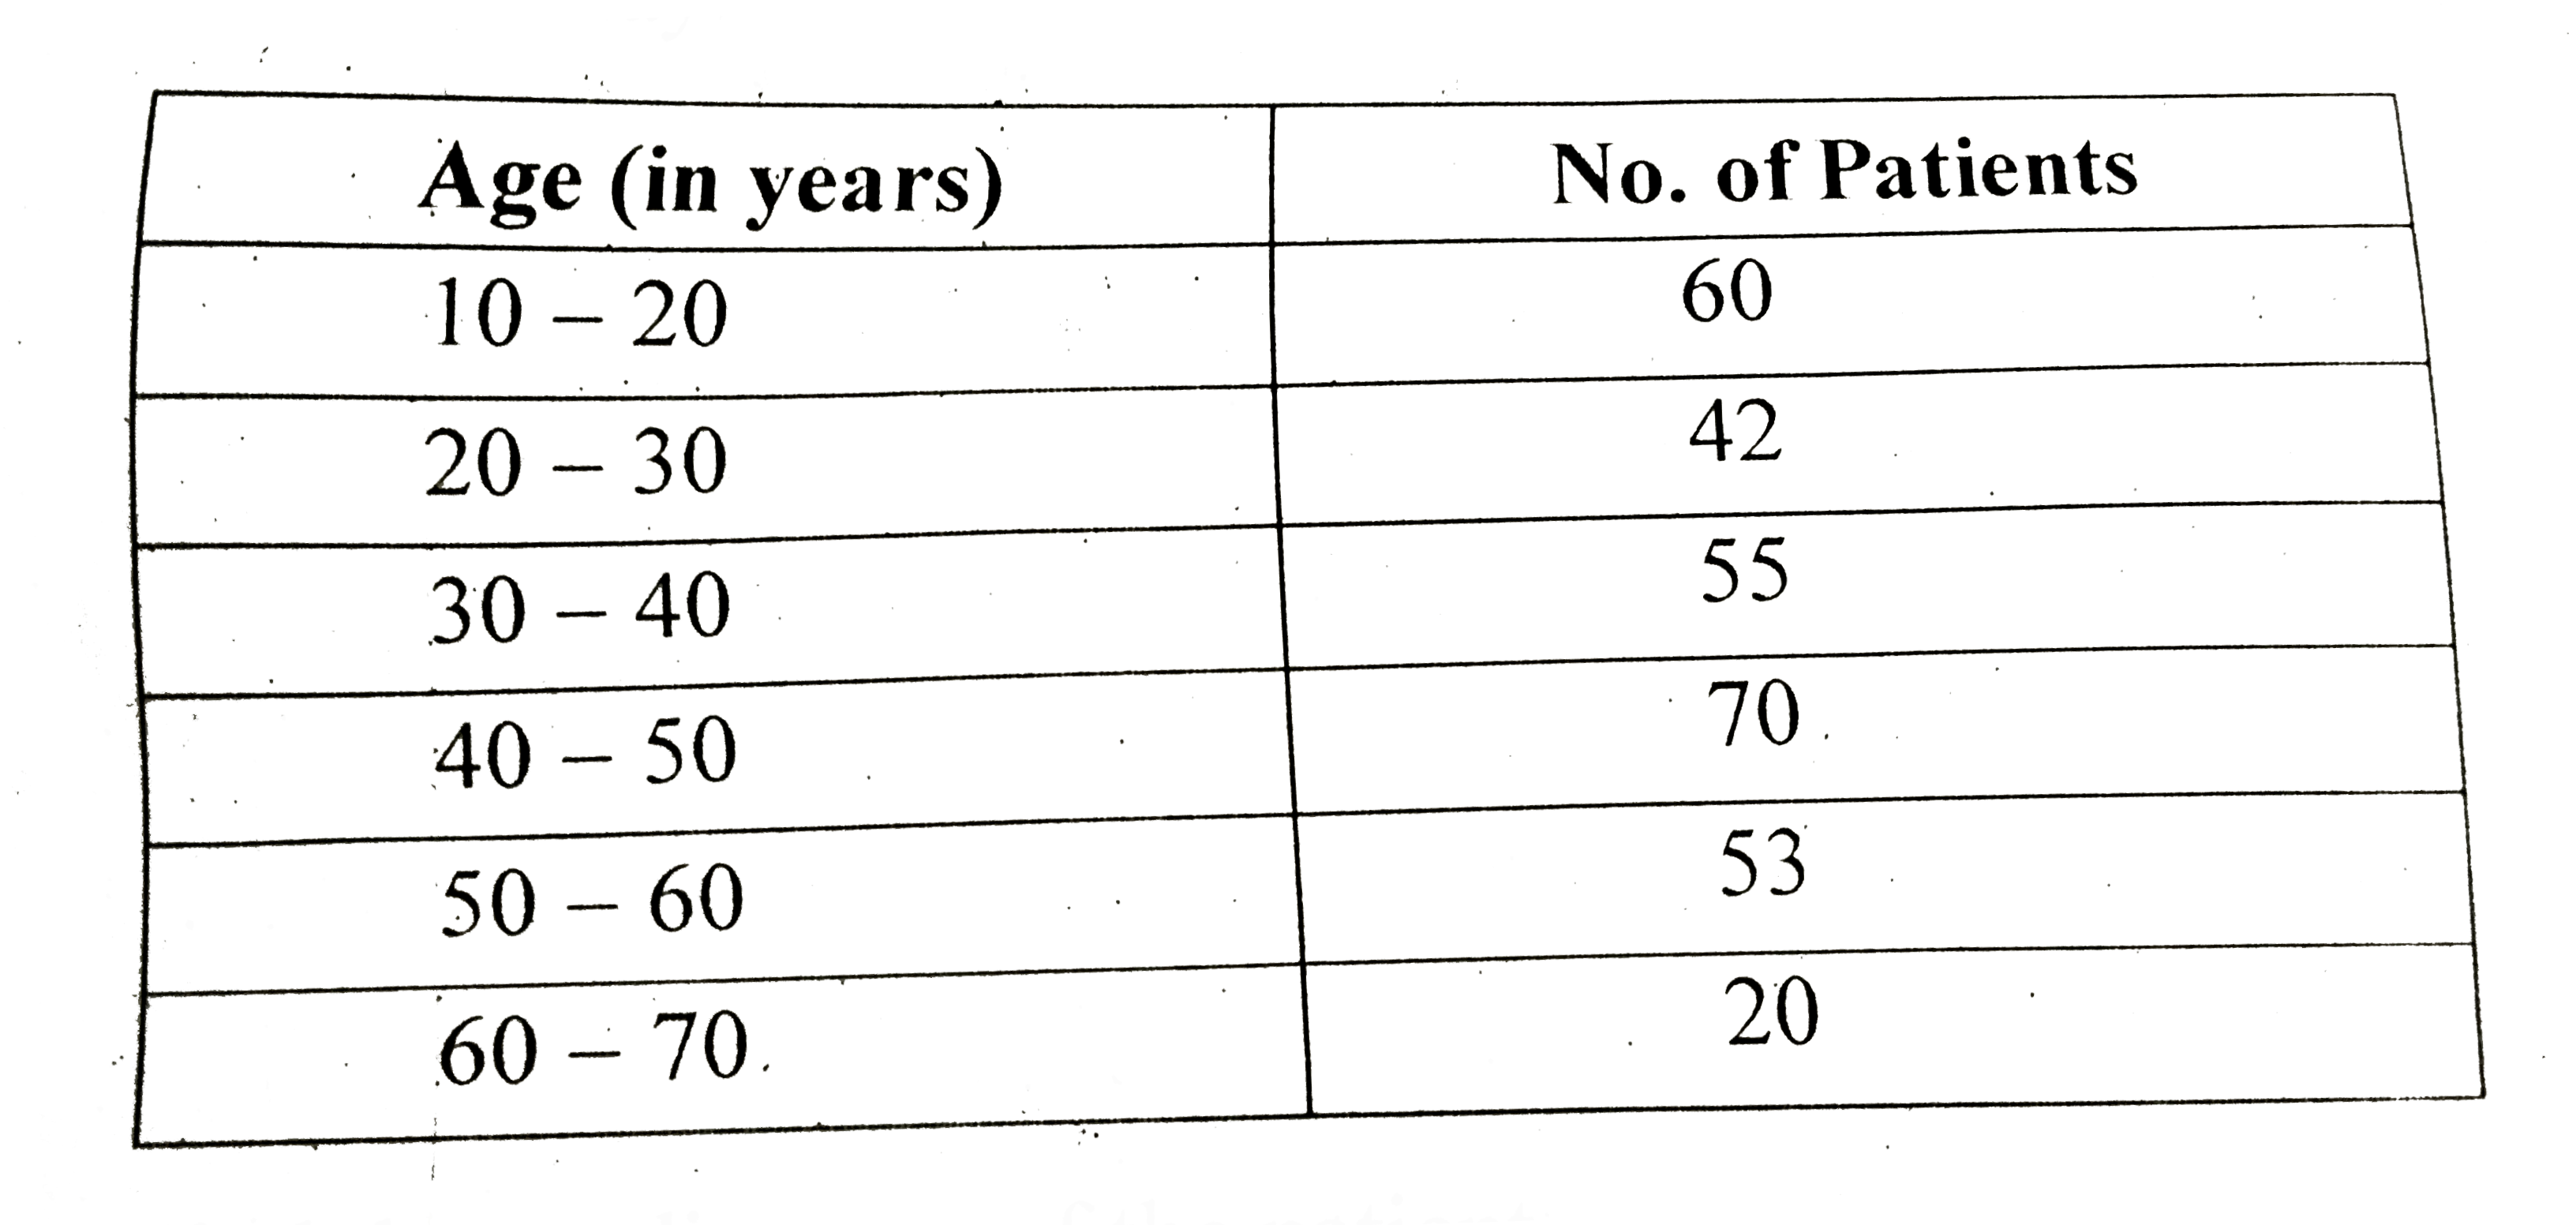
Find the median age of the patient.
View Solution
Knowledge Check
The following graph shows the temperature of a patient observed in a hospital at a certain interval of time on a certain day. Starting at 5 A.M.
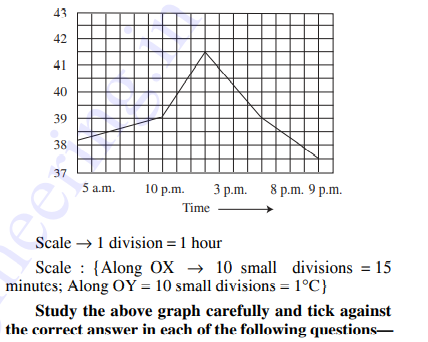
What was the temperature of the patient at 2 p.m.?A40.8∘CB41.1∘CC41.5∘CD41.9∘CThe following graph shows the temperature of a patient observed in a hospital at a certain interval of time on a certain day. Starting at 5 A.M.
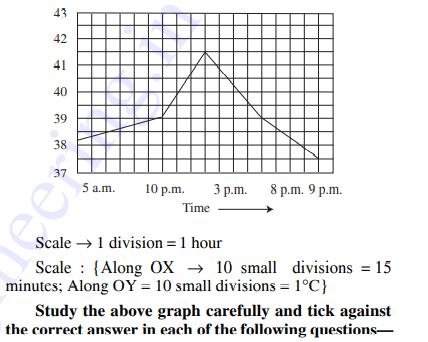
The normal temperature is 37.5∘C . At what time was the temperature normal ?A5 A.M.B5 P.M.C9 P.M.DAt no timeThe following graph shows the temperature of a patient observed in a hospital at a certain interval of time on a certain day. Starting at 5 A.M.
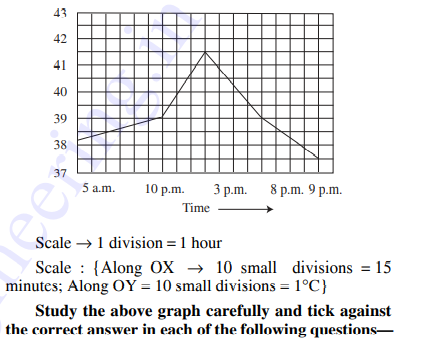
What was the maximum temperature during the day ?A40.7∘CB41.5∘CC40.8∘CD41∘C
Hospital , Nurse , Patient
View SolutionThe following frequency distribution table gives the ages of 200 patients treated in a hospital in a week. Find the mode of ages of the patients.

View SolutionThe following graph shows the temperature of a patient observed in a hospital at a certain interval of time on a certain day. Starting at 5 A.M.
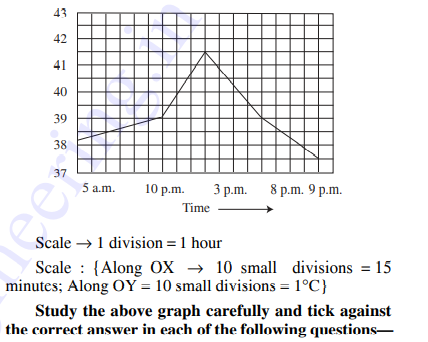
At what time during the day, the temperature was maximum ?
View SolutionThe following graph shows the temperature of a patient observed in a hospital at a certain interval of time on a certain day. Starting at 5 A.M.
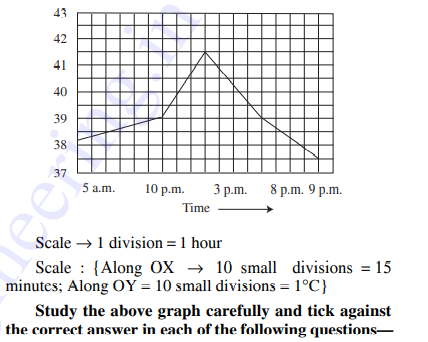
The time, when the temperature was recorded 40∘C was -----
View SolutionIf the temperature of a patient is 40∘C his temperature in the Fahrenheit scale will be
View Solution
