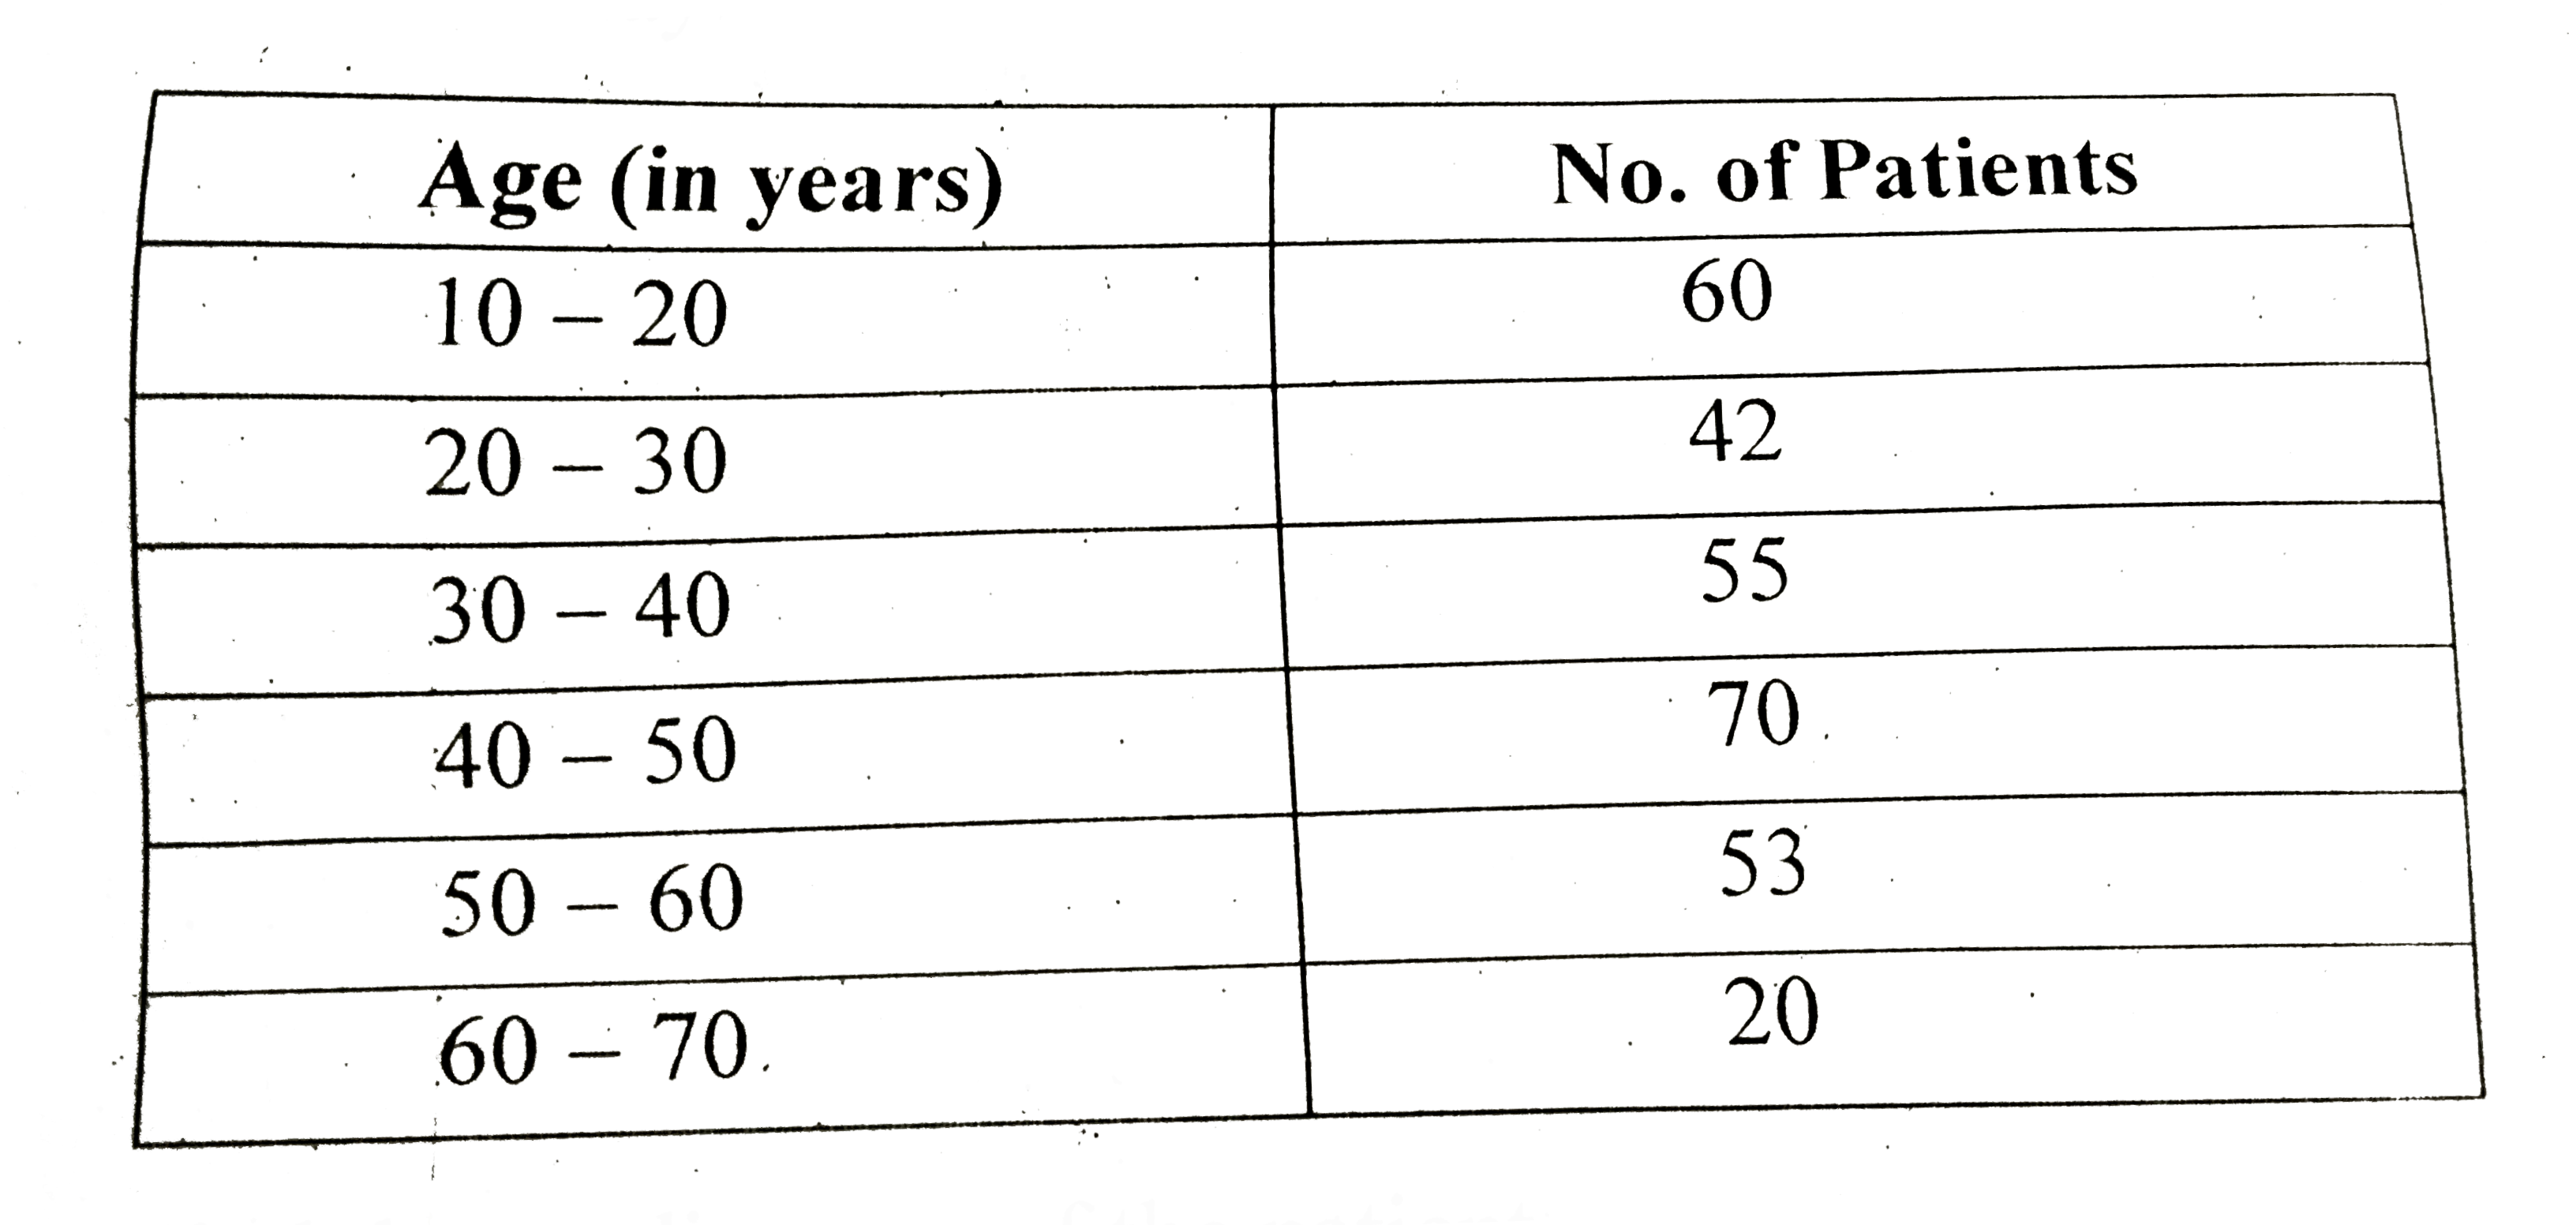
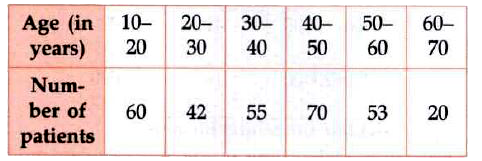
The following table shows ages of 300 patients getting medical treatment in a hospital on a particular day:

Find the median age of the patient.
Step by step video & image solution for The following table shows ages of 300 patients getting medical treatment in a hospital on a particular day: Find the median age of the patient. by Maths experts to help you in doubts & scoring excellent marks in Class 10 exams.
Updated on:21/07/2023Topper's Solved these Questions
- ALGEBRA MARCH 2015BOOK - GURUKUL PUBLICATION - MAHARASHTRA PREVIOUS YEAR PAPERSCHAPTER - ALGEBRA MARCH 2015EXERCISE - Attempt any three of the following sub-questions:
5 Videos
- ALGEBRA JULY 2017BOOK - GURUKUL PUBLICATION - MAHARASHTRA PREVIOUS YEAR PAPERSCHAPTER - ALGEBRA JULY 2017EXERCISE - QUESTIONS
22 Videos
- ALGEBRA MARCH 2016BOOK - GURUKUL PUBLICATION - MAHARASHTRA PREVIOUS YEAR PAPERSCHAPTER - ALGEBRA MARCH 2016EXERCISE - Attempt any two of the following subquestions :
3 Videos
Similar Questions
The following are the ages of 300 patients getting medical treatment in a hospital on a particular day:
Form
less than type cumulative frequency distribution.

View SolutionThe following are the ages of 300 patients getting medical treatment in a hospital on a particular day:
Form
more than type cumulative frequency distribution.

View Solution
Knowledge Check
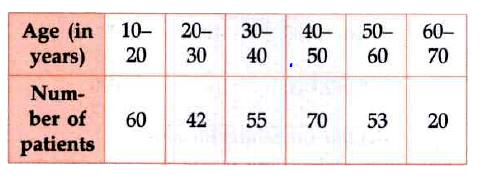
The given table shows the ages (in years) of 360 patients, getting medical treatment in a hospital.

One of the patients is selected at random. The probability that the selected patient's age is
30 year s or more but less than 40 years, isA1/6B2/9C0D1The given table shows the ages (in years) of 360 patients, getting medical treatment in a hospital.

One of the patients is selected at random. The probability that the selected patient's age is
10 years or more, isA0B1/6C1D1
The following are the ages of 300 patients getting medical treatment in a hospital on a particulat day

Form
(i) Less than type cumulative frequency distribution.
(ii) More than type cumulative frequency distribution.
View SolutionThe following table shows ages of 200 patients (in years) and the number of patients getting medical tretment on a particular day in a hospital in a day.

Find the median age of a patient.
View SolutionThe following frequency distribution table gives the ages of 200 patients treated in a hospital in a weak. Find the mode of ages of the patients.

View SolutionThe following table shows the ages of the patients admitted in a hospital during a year:Find the mode and the mean of the data given above. Compare and interpret the two measures of central tendency.
View SolutionThe following frequency distribution table gives the ages of 200 patients treated in a hospital in a week. Find the mode of ages of the patients.

View SolutionFollowing are the ages (in years) of 300 patients, getting medical treatment in a hospital.

One of the patients is selected at random. Find the probability that the age of the selected patient is
10 years or more.
View Solution