Graph plotted between stopping potential V0 and frequency v, where v>v0, for a photosensitive material is a_____graph whose slope is ____.
Linear, he
Topper's Solved these Questions
- DUAL NATURE OF RADIATION AND MATTERBOOK - U-LIKE SERIESCHAPTER - DUAL NATURE OF RADIATION AND MATTEREXERCISE - TRUE OR FALSE
8 Videos
- DUAL NATURE OF RADIATION AND MATTERBOOK - U-LIKE SERIESCHAPTER - DUAL NATURE OF RADIATION AND MATTEREXERCISE - ASSERTION REASON TYPE QUESTIONS
5 Videos
- DUAL NATURE OF RADIATION AND MATTERBOOK - U-LIKE SERIESCHAPTER - DUAL NATURE OF RADIATION AND MATTEREXERCISE - MULTIPLE CHOICE QUESTIONS
30 Videos
- CURRENT ELECTRICITY BOOK - U-LIKE SERIESCHAPTER - CURRENT ELECTRICITY EXERCISE - SELF ASSESSMENT TEST (SECTION C )
3 Videos
- ELECTRIC CHARGES AND FIELDS BOOK - U-LIKE SERIESCHAPTER - ELECTRIC CHARGES AND FIELDS EXERCISE - SELF ASSESSMENT TEST (SECTION-B) (VERY SHORT ANSWER QUESTIONS)
4 Videos
Similar Questions
The figure shows different graphs between stopping potential (V0) and frequency (v) for photosensitive surface of cesium , potassium , sodium and lithium. The plots are parallel. Correct ranking of the targets according to their work function greatest forst will be

View SolutionPlot a graph showing variation of stopping potential (V0) with the frequency (v) of the incident radiation for a given photosensitive material. Hence, state the significance of the threshold frequency in photoelectric emission.
Using the principle of energy conservation, write the equation relating the energy of incident photon, threshold frequency and the maximum kinetic energy of the emitted photoelectrons.
View Solution
Knowledge Check
The stopping potential (V0)
ADepends upon the angle of incident lightBDepends upon the intensity of incident lightCDepends upon the surface nature of the substanceDIs independent of the intensity of the incident lightThe figure shows different graphs between stopping potential (V0) and frequency (v) for photosensitive surface of cesium , potassium , sodium and lithium. The plots are parallel. Correct ranking of the targets according to their work function greatest first will be
 A(i)>(ii)>(iii)>(iv)B(i)>(iii)>(ii)>(iv)C(iv)>(iii)>(ii)=(iv)D(i)=(iii)>(ii)=(iv)
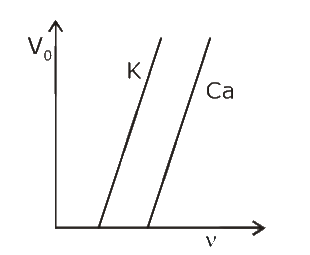
In the diagram, graph are drawn between stopping potential V0 and frequency v for the elements K and Ca. According this to diagram
 Athe work functions of K and Ca are equalBthe work function of K is greater than that of CaCthe work function of K is less than that of CaDno information can be obtained about the work function
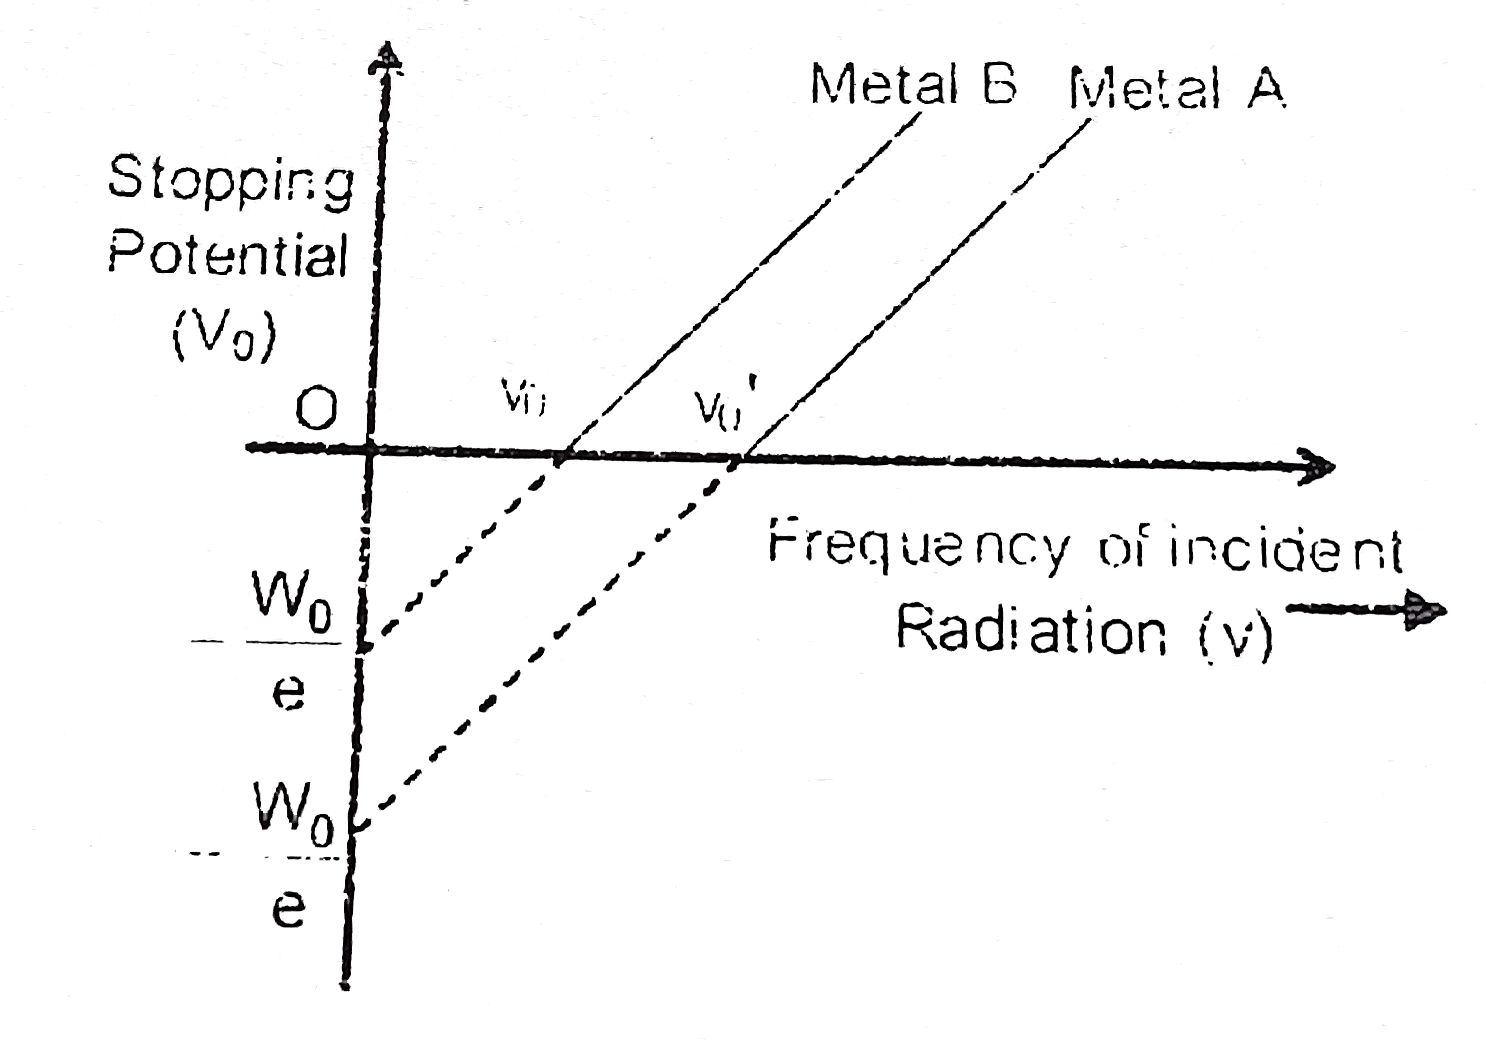
The graph shows variation of stopping potential V0 versus frequency of incident radiation v for two photosensitive metals A and B. Which of two metals has higher threshold frequency and why?

View SolutionThe graph shows variation of stopping potential V0 versus frequency of incident radiation v for two photosensitive metals A and B. Which of two metals has higher threshold frequency and why?

View SolutionSketch the graphs, showing the variation of stopping potential Vs with frequency v of the incident radiations for two photosensitive materials A and B having threshold frequencies v0>v'0 respectively.
(i) which of the two metals A or B has higher work function?
(ii) What information do you get from the slope of the graphs?
(iii) What does the value of the intercept of graph A on the potential axis represent?
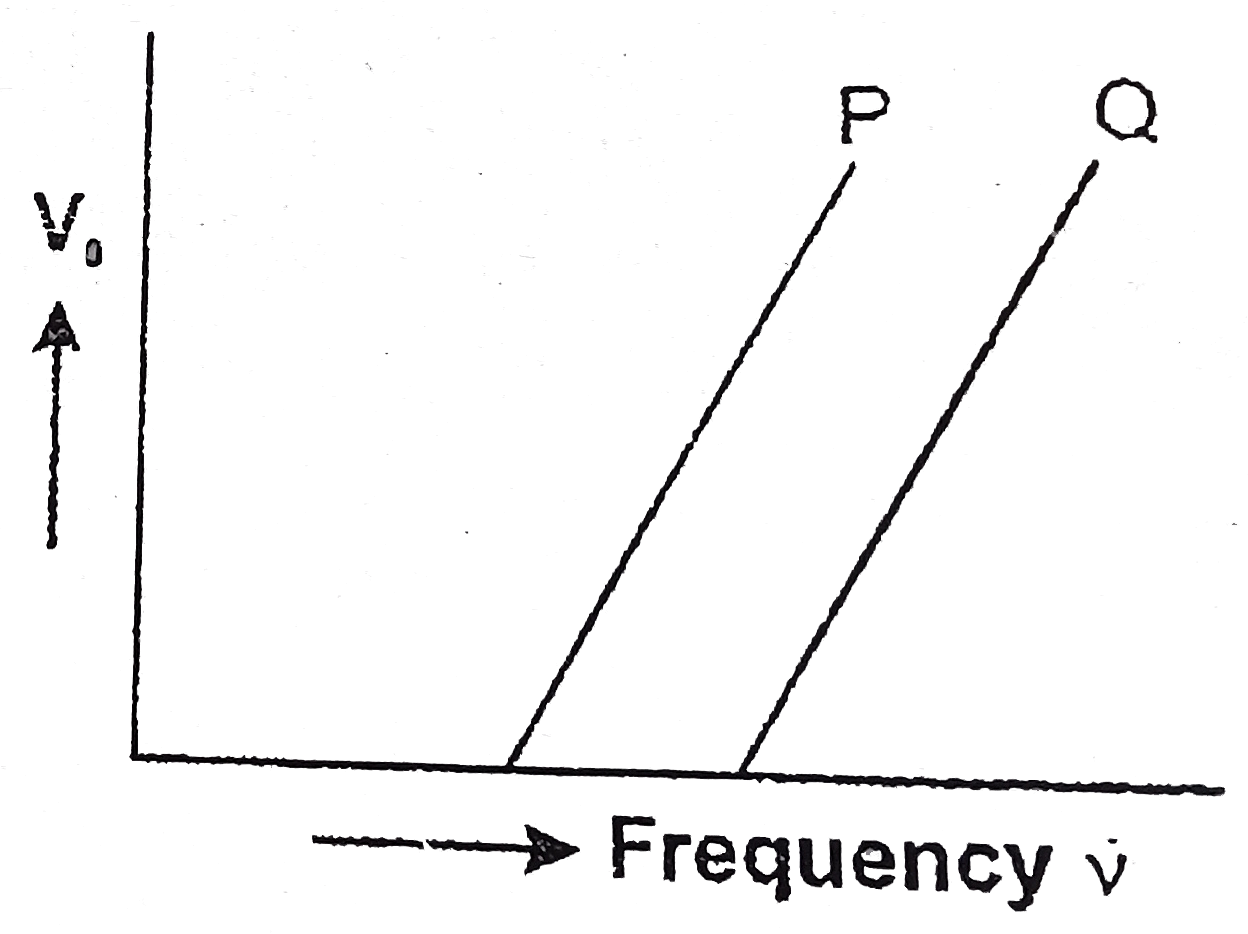
View SolutionThe graph between the stopping potential V0 and frequency v for two different metal plates P and Q are shown in the figure. Which of the metals has greater threshold wavelength and work function.

View Solution
