Sketch the graphs, showing the variation of stopping potential Vs with frequency v of the incident radiations for two photosensitive materials A and B having threshold frequencies v0>v'0 respectively.
(i) which of the two metals A or B has higher work function?
(ii) What information do you get from the slope of the graphs?
(iii) What does the value of the intercept of graph A on the potential axis represent?
The variation of stopping potential (Vs) with frequency (v) of incident radiations for two photosenstive materials is shown in fig.
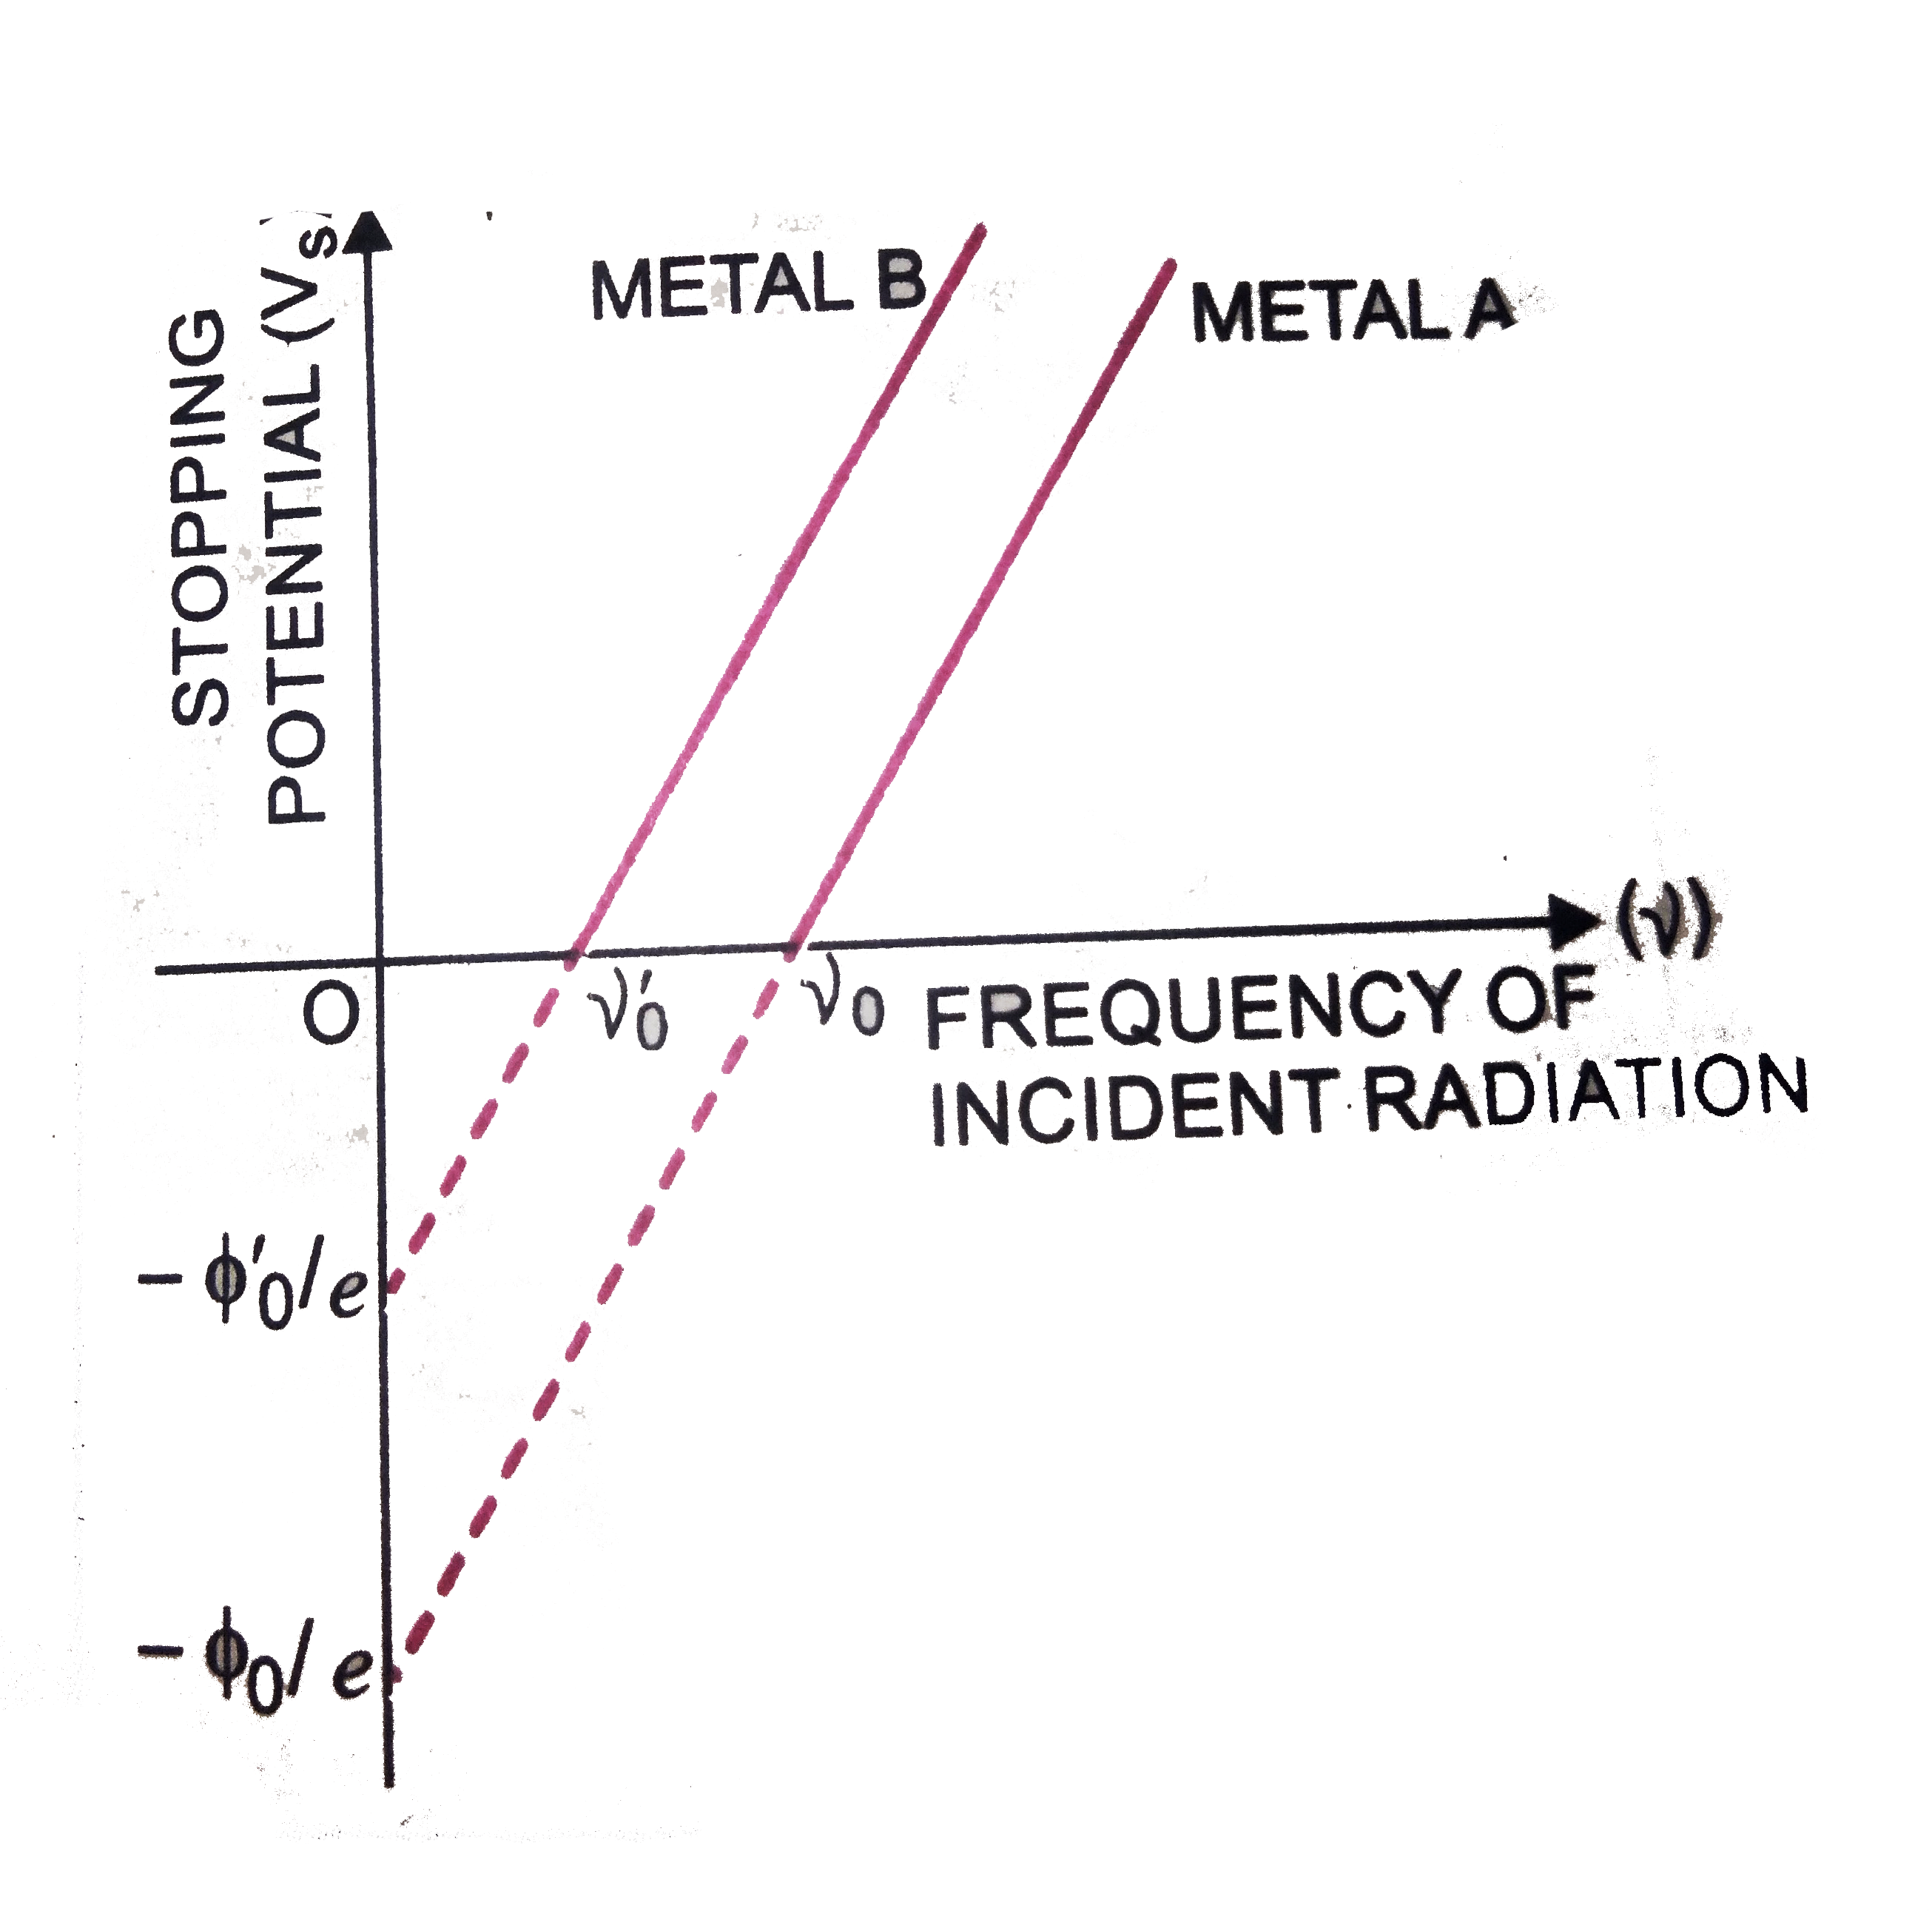
(i) Metal A has higher work function, as ϕ0=hv0andϕ'0=hv'0,sincev0>v'0.
(ii) Slope of Vs−v graph=h/e. [For discussion see conceptual problem 7]
(iii) Intercept of graph A on the potential axis =−ϕ0e=−hv0e
Topper's Solved these Questions
- BOOK - PRADEEPCHAPTER - DUAL NATURE OF RADIATION AND MATTEREXERCISE - NCERT Exerciese question1videos
DUAL NATURE OF RADIATION AND MATTER
- BOOK - PRADEEPCHAPTER - DUAL NATURE OF RADIATION AND MATTEREXERCISE - Short answer1videos
DUAL NATURE OF RADIATION AND MATTER
- BOOK - PRADEEPCHAPTER - CURRENT ELECTRICITYEXERCISE - Problems for Practice (B)2videos
CURRENT ELECTRICITY
- BOOK - PRADEEPCHAPTER - ELECTROMAGNETIC INDUCTION & ALTERNATING CURRENTEXERCISE - Multiple Choice Questions1videos
ELECTROMAGNETIC INDUCTION & ALTERNATING CURRENT
Similar Questions
Draw and explain the graph showing the variation of stopping potential with frequency of incident radiation in relation to photoelectric effect.
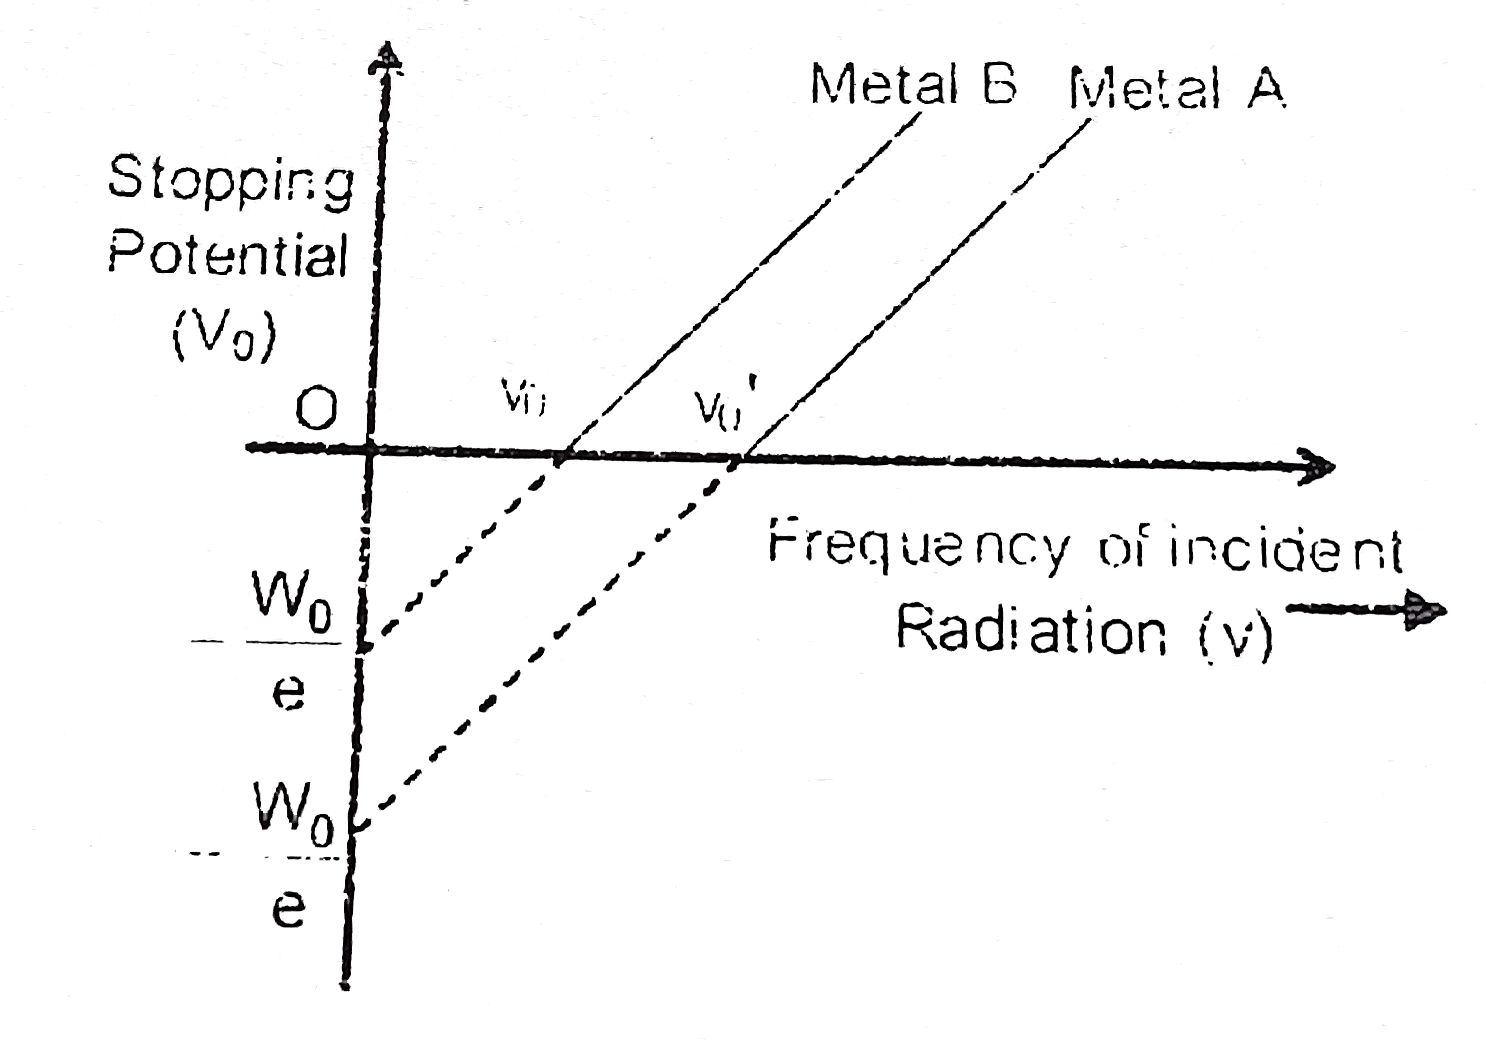
View SolutionThe graph shows variation of stopping potential V0 versus frequency of incident radiation v for two photosensitive metals A and B. Which of two metals has higher threshold frequency and why?
 View Solution
Knowledge Check
- Question 1 - Select One
Figure show the variation of the stopping potential (V0) with the frequency (v) of the incident radiations for two different photosensitive matererial M1 and M2 What are the values of work functions for M1 and M2 respectively
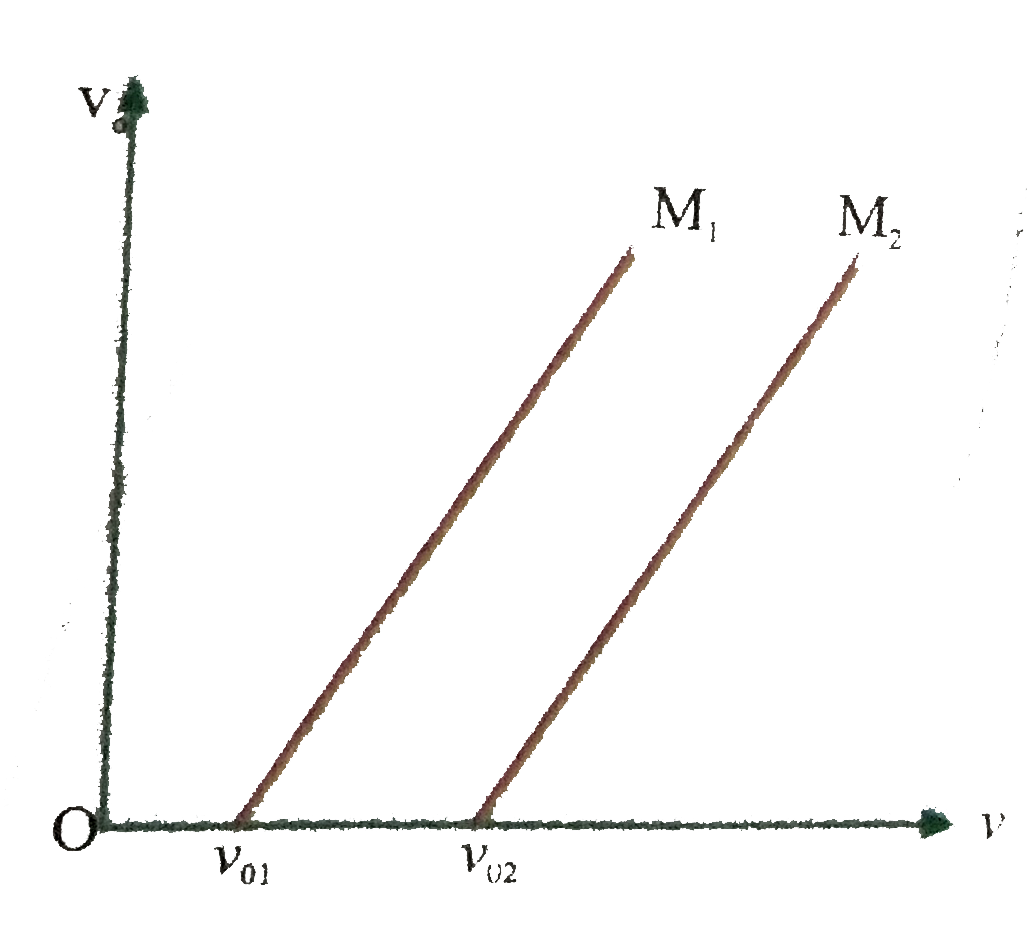 Ahv01,hv02Bhv02,hv01Chv01,hv01Dhv02,hv02
 - Question 2 - Select One
For a photoelectric cell, the graph shown the variation of cut off voltage (V0) with frequency (v) of incident light is
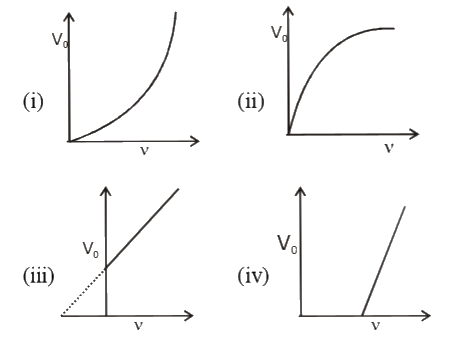 A(i)B(ii)C(iii)D(iv)
 - Question 3 - Select One
For a photoelectric cell the graph showing the variation of cut of voltage (V) with frequency (v) of incident light is best represented by
A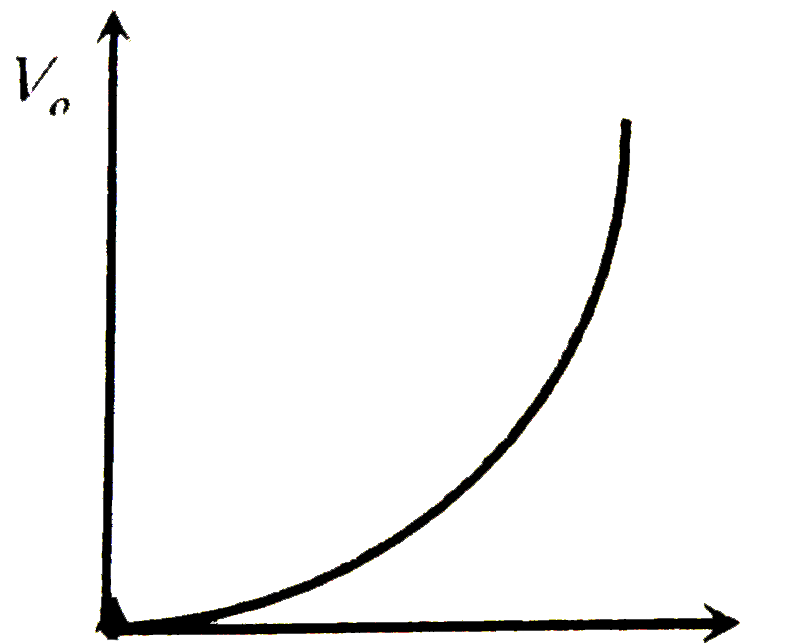 B
B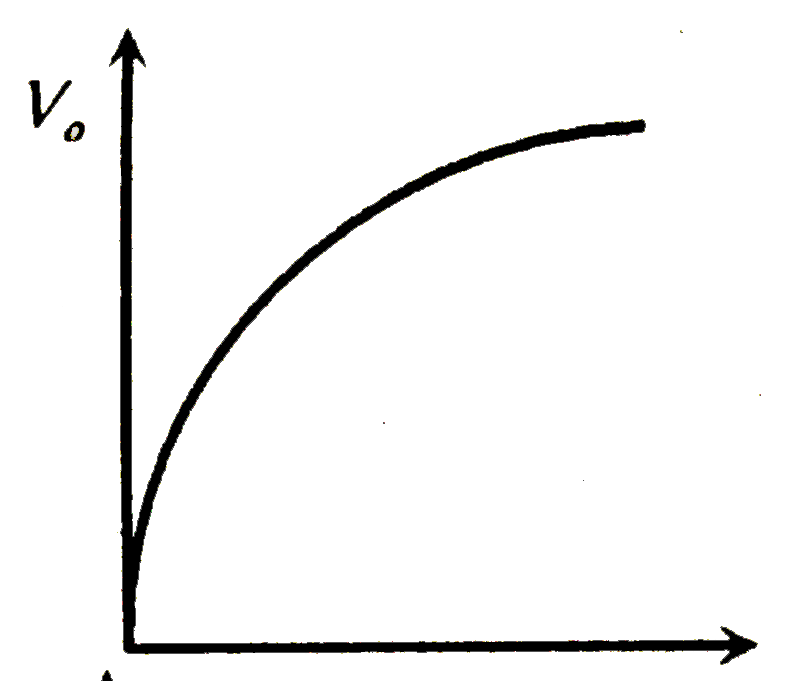 C
C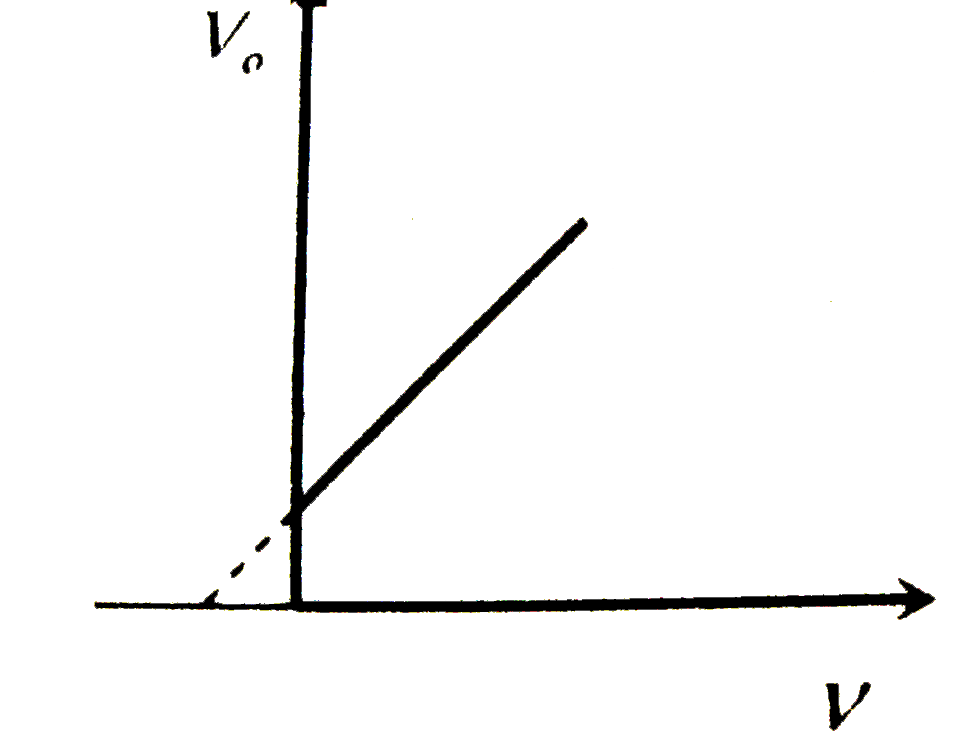 D
D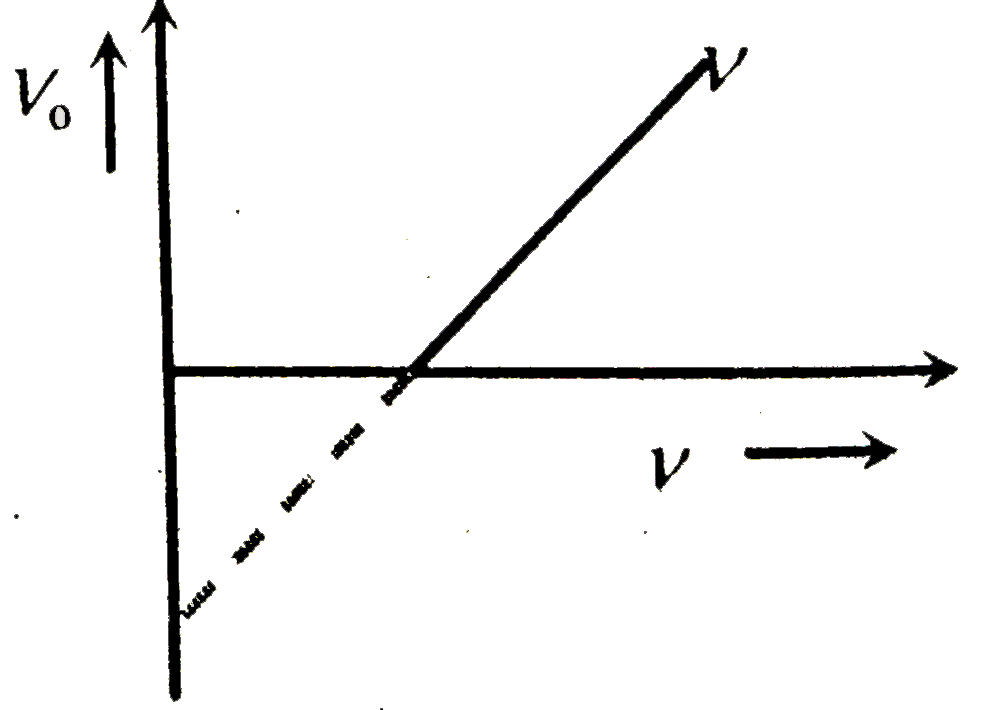
The figure shows the variation of stopping potential VQ with the frequency v of the incident radiations for two photosensitive metals P and
Which metal has smaller threshold wavelength ? Justify your answer.View SolutionDefine photoelectric effect. Draw a graph to show the variation of stopping potential with frequency of incident radiation on a metal plate.
View SolutionSketch the graphs showing variation of stopping potential with frequency of incident radiations for two photosensitive materials A and B having threshold frequencies vA>vB.
(i) In which case is the stopping materials A and B having threshold frequencies vA>VB.
(i) In which case is the stopping potential more and why?
(ii) Does the slope of the graph depend on the nature of the materials used ? Explain.View SolutionDraw a graph showing the variation of stopping potential with frequency of the incident on a metal plate. How can the value of Planck's constant be determined from this graph?
View SolutionPlot a graph showing the variation of stopping potential with the frequency of incident radiation for two different photosensitive materials having work functions W1andW2(W1>W2). On what factors does the (i) slope and (ii) intercept of the lines depend ?
View Solution

