Study the diagram given below and answer the questions that follow :
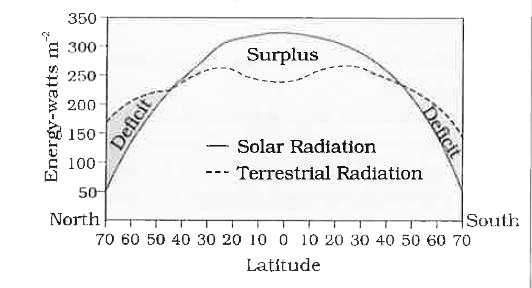
What does the diagram show?
The figure shows that there is a surplus of net ratiation balance between 40 degrees north and south and the regions near the poles have a deficit. The surplus heat energy from the tropics is redistributed pole wards ans as a result the tropics do not get progressively heated up due to the accumulation of excess heat or the high latitudes get permanently frozon due to excess deficit.
Topper's Solved these Questions
- SOLAR RADIATION, HEAT BALANCE AND TEMPERATUREBOOK - FULL MARKSCHAPTER - SOLAR RADIATION, HEAT BALANCE AND TEMPERATUREEXERCISE - ADDITIONAL QUESTIONS WITH ANSWER LONG ANSWER TYPE QUESTIONS
3 Videos
- SOLAR RADIATION, HEAT BALANCE AND TEMPERATUREBOOK - FULL MARKSCHAPTER - SOLAR RADIATION, HEAT BALANCE AND TEMPERATUREEXERCISE - ADDITIONAL QUESTIONS WITH ANSWER HOTS QUESTION
1 Videos
- SOLAR RADIATION, HEAT BALANCE AND TEMPERATUREBOOK - FULL MARKSCHAPTER - SOLAR RADIATION, HEAT BALANCE AND TEMPERATUREEXERCISE - ADDITIONAL QUESTIONS WITH ANSWER SHORT ANSWER TYPE QUESTIONS
8 Videos
- SOILSBOOK - FULL MARKSCHAPTER - SOILSEXERCISE - TEST ASSIGNMENT
5 Videos
- STRUCTURE AND PHYSIOGRAPHYBOOK - FULL MARKSCHAPTER - STRUCTURE AND PHYSIOGRAPHYEXERCISE - Additional Questions With Answers (VI. Map/Diagram Based Questions)
6 Videos
Similar Questions
Study the diagram given below and answer the questions that follow :
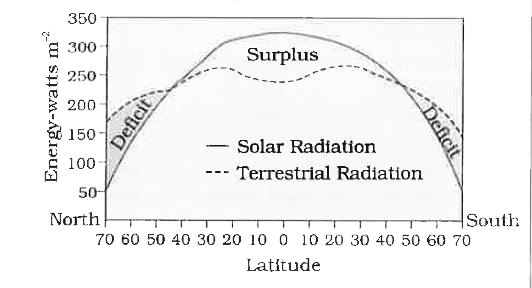
What does the diagram depict?
View SolutionStudy the diagram given below and answer the questions that follow :
What is emulsification?
View SolutionStudy the diagram given below and answer the questions that follow:
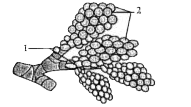
Draw a neat, labelled diagram of the human lungs.
View SolutionStudy the diagram given below and answer the questions that follow :
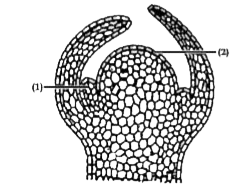
Draw a neat, labelled diagram of a meristematic cell.
View SolutionThe given diagram represents the process of germination of seed. Study the diagram given below and answer the questions that follows :
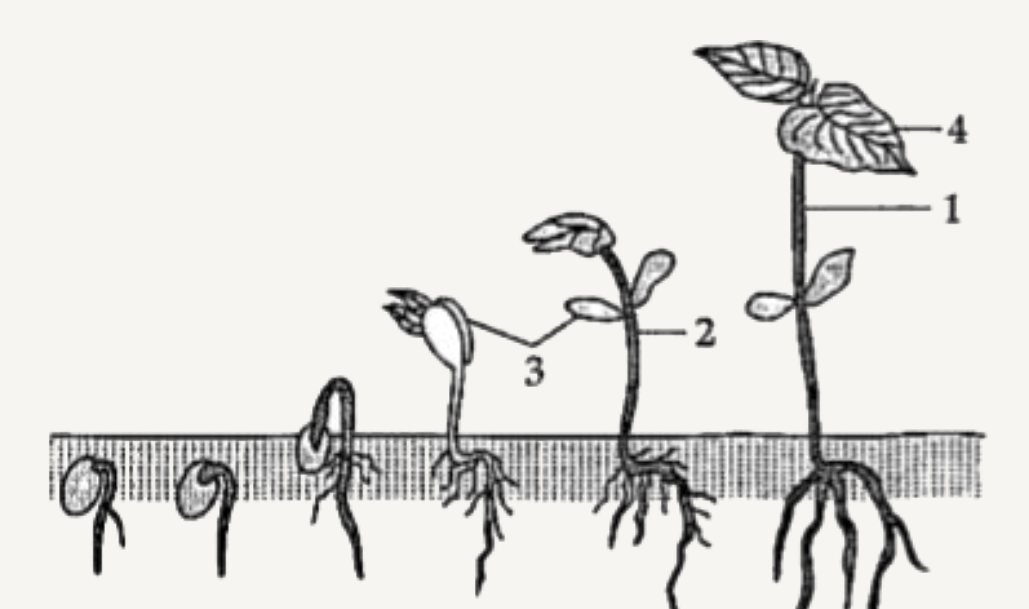
What happens when seed absorbs moisture ?
View SolutionStudy the diagram given below and then answer the questions that follow:
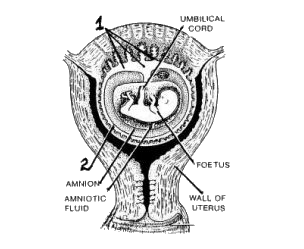
Name the part in the diagram which is endocrine in nature.
View SolutionStudy the diagram given below and answer the questions that follows :
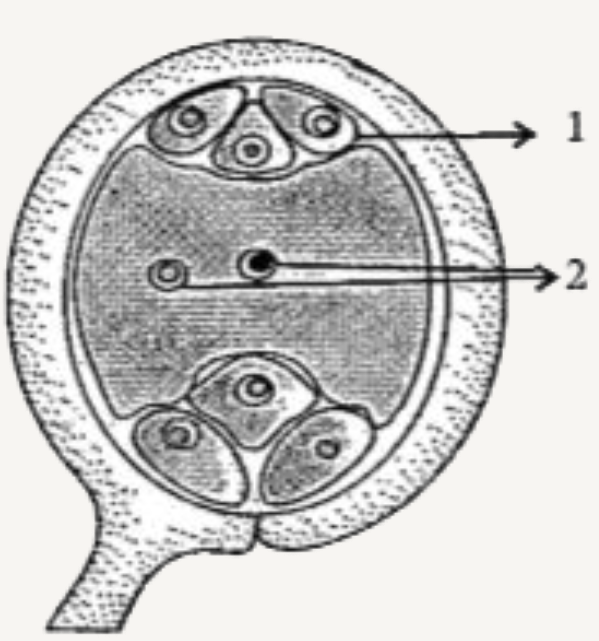
What is the fate of the calyx and corolla after fertilizations?
View SolutionStudy the diagram given below and then answer the questions that follow :
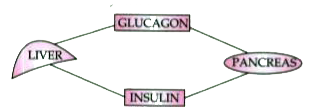
What is the technical term for the cells of the pancreas that produce endocrine hormones ?
View SolutionStudy the diagram given below and answer the following questions.
View SolutionStudy the diagram given below and answer the questions that follow :
Name the structure shown in the diagram. It is a part of which system of the human body?
View Solution
