When the number of old people above 60 years of age are more in the sex-age pyramid of country, then what does it indicate ? Explain in relation to demographie evolution.
Step by step video & image solution for When the number of old people above 60 years of age are more in the sex-age pyramid of country, then what does it indicate ? Explain in relation to demographie evolution. by Geography experts to help you in doubts & scoring excellent marks in Class 12 exams.
Updated on:21/07/2023Topper's Solved these Questions
- POPULATION COMPOSITIONBOOK - FULL MARKSCHAPTER - POPULATION COMPOSITIONEXERCISE - Previous Years Board Questions Solved (III. Long Answer Type Questions)
7 Videos
- POPULATION : DISTRIBUTION , DENSITY , GROWTH & COMPOSITION BOOK - FULL MARKSCHAPTER - POPULATION : DISTRIBUTION , DENSITY , GROWTH & COMPOSITION EXERCISE - WORKSHEET
21 Videos
- PRACTICE PAPER 01BOOK - FULL MARKSCHAPTER - PRACTICE PAPER 01EXERCISE - QUESTIONS
16 Videos
Similar Questions
Knowledge Check
What does the shape of the given age pyramids reflects about the growth status of the related population ?
 A(i)(ii).ExpandingStableB(i)(ii).StableDecliningC(i)(ii).ExpandingDecliningD(i)(ii).DecliningStable
Eight people viz. L, M, N, O, P, Q, R and S are sitting in a straight line. They all are facing north. Each one of them has a different age i.e. 14, 16,17,19,21,23 26 and 31 year, but not necessarily in the same order. M sits at one of the extreme end of the row. There are three persons sitting between N and Q. Q is of neither 14 nor 19yr old. There are two persons sitting between O and the person whose age is 23yr. Neither A nor B is the oldest person. Age difference of immediate neighbours of O is 5yr. L sits right to the R, but not immediate right. There are three persons sitting between M and the one whose age is 16yr. The one whose age is 19yr sits third to the right of N. R sits to the right of M. Q sits second to the right of the person whose age is 23yr. Psits immediate left of the person whose age is 14yr. Q is not youngest person. The one, whose age is 31 yr in not immediate neighbour of the youngest person, N is not the fourth oldest person.
If P is related to 16 yr in the same way as M is related to 26 yr, then which of the following is R related to, following the same pattern ?A19yrB17yrC21yrD31yrWhat is the ratio of total number of persons of ages above 50 years in the villages B and C taken together to the total number of persons having ages between 20 and 50 years in the said village
A49:57B47:53C51:59D24:27
Why is the base the central portion of sex-age pyramid of a developed country more balanced? Comment
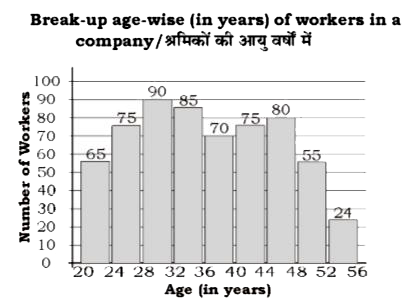
View SolutionStudy the giiven graph and answer that follows

What is the ratio of the number of workers in the company whose age in 28 years or more but less than 40 years to the number of workers whose age is 40 years or more but less than 52 years.
View SolutionTen years ago, the ages of the members of a joint family of eight people added up to 231 years. Three years later, one member died at the age of 60 years and a child was born during the same year. After another three years, one more member died, again at 60, and a child was born during the same year. The current average of this eight-member joint family is nearest to (a) 21 years (b) 22 years (c) 23 years (d) 24 years (e) 25 years
View SolutionTen years ago, the ages of the members of a joint family of eight people added up to 231 years. Three years later, one member died at the age of 60 years and a child was born during the same year. After another three years, one more member died, again at 60, and a child was born during the same year. The current average age of this eight–member joint family is nearest to
View SolutionIn the command hospital Lucknow the sum of the ages of all the 29 people i.e, physicians, surgeons and nurses is 696. If the age of each physician, each surgeon and each nurse be 1 year, 6 years and 3 years more, then the average age of the whole staff would have been 3 years more. If the number of surgeon is a square root of a two digit number which is also a perfect cube, then the number of nurses in the hospital is :
View Solution
