What are the typical characteristics of population in the different age groups?
Step by step video & image solution for What are the typical characteristics of population in the different age groups? by Geography experts to help you in doubts & scoring excellent marks in Class 12 exams.
Updated on:21/07/2023Topper's Solved these Questions
- POPULATION COMPOSITIONBook:FULL MARKSChapter:POPULATION COMPOSITIONExercise:Previous Years Board Questions Solved (III. Long Answer Type Questions)
Explore 7 Videos
- POPULATION : DISTRIBUTION , DENSITY , GROWTH & COMPOSITION Book:FULL MARKSChapter:POPULATION : DISTRIBUTION , DENSITY , GROWTH & COMPOSITION Exercise:WORKSHEET
Explore 21 Videos
- PRACTICE PAPER 01Book:FULL MARKSChapter:PRACTICE PAPER 01Exercise:QUESTIONS
Explore 16 Videos
Similar Questions
Knowledge Check
Monoculture is a typical characteristic of
AShifting cultivationBSubsistence farmingCSpecialized horticultureDCommercial grain farmingNatality is the characteristic of population which means :
Athe total number of individuals present per unit area at a given timeBthe increase in number of individuals in a population under given environmental conditionsCloss of individuals due to death in a populations under given environmental conditionsDthe movement of individuals into and out of populationA broad-based, pyramid shaped age structure is characteristic of a population that is –
AGrowing rapidlyBAt carrying capacityCStableDShrinking
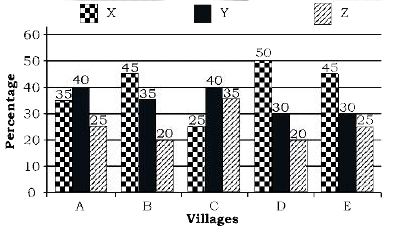
The given Bar Graph presents the percentages of population in the age groups. X(above 50 years), Y(20 to 50 years). Z(below 20 years) in five different villages. A,B,C,D and E with total population of 5000, 6000, 8000, 4500 and 6000 respectively
 The difference between the number of persons of ages below 20 years in villages D and E,taken together, is what percentage of the number of persons of the same age group in village D?
View SolutionThe given bar graph presents the percentages of population in the age groups X ,Y , Z in five different villages A,B,C,D and E total population of 5000,6000,8000,4500 and 6000 respectively.

The number of persons having ages below 20 years in villages B and C taken together is what percentage of the total population of the said villages.
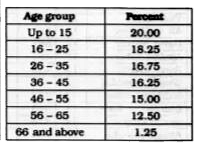
View SolutionThe table shows the percentage of total population of a city in different age groups. Study the table and answer the questions.

If there are 22 million people below 26 years, then the number of people (in millions) in the age group (56 - 65) is
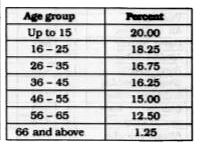
View SolutionThe table shows the percentage of total population of a city in different age groups. Study the table and answer the questions.

If the difference between the number of people in the age groups (46 - 55) and (16 - 25) is 0.975 million, then the total population (in millions) of the city is
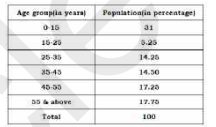
View SolutionThe following table showing the percentage of the total population of a state in different age groups. Out of every 50,000 people, find the approximate number of persons below the age of 35?
निम्नलिखित तालिका एक राज्य में अलग-अलग आयु वर्ग की कुल आबादी के प्रतिशत को दर्शाती है |
प्रत्येक 50,000 लोगों में से, 35 वर्ष से कम उम्र के लोगों की संख्या (लगभग) ज्ञात करें |
View Solution