Polygraph is constructed to represent.
Only one variable
Two variables only
More than two variales
None of the above
The correct Answer is:C
Topper's Solved these Questions
- GRAPHICAL REPRESENTATION OF DATABook:FULL MARKSChapter:GRAPHICAL REPRESENTATION OF DATAExercise:NCERT TEXTBOOK QUESTIONS SOLVED (ACTIVITY)
Explore 5 Videos
- GRAPHICAL REPRESENTATION OF DATABook:FULL MARKSChapter:GRAPHICAL REPRESENTATION OF DATAExercise:ADDITIONAL QUESTIONS SOLVED (VERY SHORT ANSWER QUESTIONS)
Explore 11 Videos
- DATA-ITS SOURCE AND COMPLIATIONBook:FULL MARKSChapter:DATA-ITS SOURCE AND COMPLIATIONExercise:ADDITIONAL QUESTION SOLVED (IV. VIVA-VOCE QUESTIONS)
Explore 8 Videos
- HUMAN DEVELOPMENTBook:FULL MARKSChapter:HUMAN DEVELOPMENTExercise:Worksheet (Based on Chapter -4)
Explore 12 Videos
Similar Questions
Construction
View SolutionConstruction of graphs
View SolutionConstructive Interference
View SolutionDefine and construct a line graph of represent the growth rate of population in India during 1901-2001.
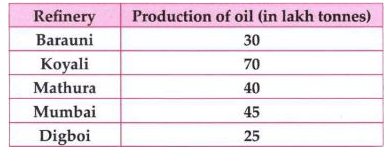
View SolutionThe production of oil (in lakh tonnes) in some of the refineries in India during 2008 is given below :

Construct a bar graph to represent the above data
View SolutionSteps To Construct
View SolutionSteps To Construct
View SolutionThe marks obtained (out of 100) by a class of 80 students are given below:

Construct a histogram to represent the data above
View SolutionThe marks obtained (out of 100) by a class of 80 students are given below:

Construct a histogram to represent the data above
View SolutionConstruct the region represented by the inequations x+y≤3andx−y≤2.
View Solution
