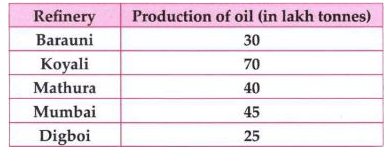
The production of oil (in lakh tonnes) in some of the refineries in India during 2008 is given below :

Construct a bar graph to represent the above data
Step by step video & image solution for The production of oil (in lakh tonnes) in some of the refineries in India during 2008 is given below : Construct a bar graph to represent the above data by Maths experts to help you in doubts & scoring excellent marks in Class 7 exams.
Updated on:21/07/2023Topper's Solved these Questions
- DATA HANDLINGBOOK - MTG IIT JEE FOUNDATIONCHAPTER - DATA HANDLINGEXERCISE - NCERT Section (Exercise - 3 .1 )
23 Videos
- DATA HANDLINGBOOK - MTG IIT JEE FOUNDATIONCHAPTER - DATA HANDLINGEXERCISE - NCERT Section (Exercise - 3 .2 )
9 Videos
- DATA HANDLINGBOOK - MTG IIT JEE FOUNDATIONCHAPTER - DATA HANDLINGEXERCISE - Olympiad / Hots Corner
20 Videos
- CONGRUENCE OF TRIANGLES BOOK - MTG IIT JEE FOUNDATIONCHAPTER - CONGRUENCE OF TRIANGLES EXERCISE - Olympiad/HOTS Corner
10 Videos
- EXPONENTS AND POWERSBOOK - MTG IIT JEE FOUNDATIONCHAPTER - EXPONENTS AND POWERSEXERCISE - OLYMPIAD/HOTS CORNER
15 Videos
Similar Questions
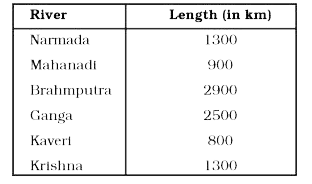
The lengths in km (rounded to nearest hundred) of some major rivers of India is given below:

Draw a bar graph to represent the above information.
View SolutionThe sales of a shopkeeper in the first week of january 2012, are given below :

Draw a graph representing the above data.
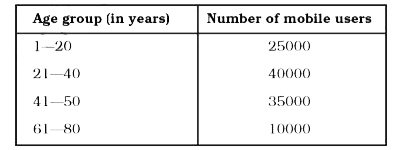
View SolutionNumber of mobile phone users in various age groups in a city is listed below:

Draw a bar graph to represent the above information.
View SolutionThe expenditure of a family of different heads in a month is given below

Draw a bar graph to represent the data above.
View SolutionThe runs scored by a cricket team in first 10 overs are given below:

Draw a line graph representing the above data.
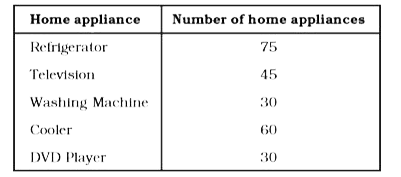
View SolutionHome appliances sold by a shop in one month are given as below:

Draw a bar graph to represent the above information.
View SolutionThe daily pocket expenses of 206 students in a school are given below.

Construct a frequency polygon representing the above data.
View SolutionThe daily pocket expenses of 206 students in a school are given below.

Construct a frequency polygon representing the above data.
View SolutionThe marks obtained (out of 100) by a class of 80 students are given below:

Construct a histogram to represent the data above
View SolutionThe approximate speeds of some objects are given below. Draw a bar graph to represent them:

View Solution
