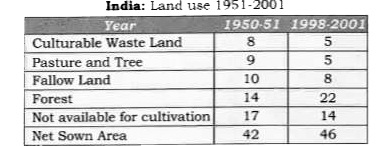
Represent the followng data with help of pie- diagram.
India: Land use 1951-2001

Topper's Solved these Questions
- BOOK - FULL MARKSCHAPTER - GRAPHICAL REPRESENTATION OF DATAEXERCISE - ADDITIONAL QUESTIONS SOLVED (VERY SHORT ANSWER QUESTIONS)11videos
GRAPHICAL REPRESENTATION OF DATA
- BOOK - FULL MARKSCHAPTER - GRAPHICAL REPRESENTATION OF DATAEXERCISE - ADDITIONAL QUESTIONS SOLVED (SHORT ANSWER QUESTIONS)3videos
GRAPHICAL REPRESENTATION OF DATA
- BOOK - FULL MARKSCHAPTER - GRAPHICAL REPRESENTATION OF DATAEXERCISE - TEST ASSIGNMENT3videos
GRAPHICAL REPRESENTATION OF DATA
- BOOK - FULL MARKSCHAPTER - DATA-ITS SOURCE AND COMPLIATIONEXERCISE - ADDITIONAL QUESTION SOLVED (IV. VIVA-VOCE QUESTIONS)8videos
DATA-ITS SOURCE AND COMPLIATION
- BOOK - FULL MARKSCHAPTER - HUMAN DEVELOPMENTEXERCISE - Worksheet (Based on Chapter -4)12videos
HUMAN DEVELOPMENT
Similar Questions
Knowledge Check
- Question 1 - Select One
What is pie diagram useful for?
AComparing different amountsBShowing a particular amount in relation to the wholeCShowing a patternDShowing features of the historical period - Question 2 - Select One
What are pie diagrams useful for?
AShowing features of a historical periodBShowing a patternCComparing different amountsDShowing a particular amount in relation to the whole
Represent the following data with the help of a pie-diagram: Items, Wheat, Rice, Tea Production (in metric tons), 3280, 1840, 900
View SolutionRepresent the following data, using a percentage bar diagram :
 View Solution
Represent the following data using a histogram.
 View Solution
Define and construct a line graph of represent the growth rate of population in India during 1901-2001.
View SolutionRepresent the formation of MgCl2 with the help of diagram of their electornic configuration.
View SolutionDraw a pie-diagram to represent the following data on the proposed outlay during the fourth five-year plan. Items, Agriculture, Ind. and Minerals, Irrigation & Power, Communication, Miscellaneous Rupees (in crores), 6000, 4000, 2500, 4500, 3000
View Solution


