Draw a pie-diagram to represent the following data on the proposed outlay during the fourth five-year plan. Items, Agriculture, Ind. and Minerals, Irrigation & Power, Communication, Miscellaneous Rupees (in crores), 6000, 4000, 2500, 4500, 3000
To draw a pie diagram representing the proposed outlay during the fourth five-year plan, we will follow these steps:
Step 1: Gather the Data
We have the following data:
- Agriculture: 6000 crores
- Industrial and Minerals: 4000 crores
- Irrigation & Power: 2500 crores
- Communication: 4500 crores
- Miscellaneous: 3000 crores
Step 2: Calculate the Total Amount
Add all the amounts together to find the total outlay:
Total=6000+4000+2500+4500+3000
Total=20,000 crores
Step 3: Calculate the Central Angle for Each Category
The total amount corresponds to a full circle (360 degrees). We will calculate the angle for each category using the formula:
Angle=(AmountTotal)×360
1. Agriculture:
Angle=(600020000)×360=108 degrees
2. Industrial and Minerals:
Angle=(400020000)×360=72 degrees
3. Irrigation & Power:
Angle=(250020000)×360=45 degrees
4. Communication:
Angle=(450020000)×360=81 degrees
5. Miscellaneous:
Angle=(300020000)×360=54 degrees
Step 4: Draw the Pie Chart
Now that we have the angles, we can draw the pie chart. Here’s how to represent each category:
1. Start with a circle.
2. Use a protractor to measure and draw the angles:
- Draw a 108-degree section for Agriculture.
- Next, draw a 72-degree section for Industrial and Minerals.
- Then, draw a 45-degree section for Irrigation & Power.
- Follow with an 81-degree section for Communication.
- Finally, draw a 54-degree section for Miscellaneous.
Step 5: Label Each Section
Label each section of the pie chart with the corresponding category name and the amount in crores.
Final Pie Chart
You should now have a pie chart that visually represents the proposed outlay during the fourth five-year plan.
---
We have the following data:
- Agriculture: 6000 crores
- Industrial and Minerals: 4000 crores
- Irrigation & Power: 2500 crores
- Communication: 4500 crores
- Miscellaneous: 3000 crores
Add all the amounts together to find the total outlay:
Total=6000+4000+2500+4500+3000
Total=20,000 crores
The total amount corresponds to a full circle (360 degrees). We will calculate the angle for each category using the formula:
Angle=(AmountTotal)×360
Angle=(600020000)×360=108 degrees
Angle=(400020000)×360=72 degrees
Angle=(250020000)×360=45 degrees
Angle=(450020000)×360=81 degrees
Angle=(300020000)×360=54 degrees
Now that we have the angles, we can draw the pie chart. Here’s how to represent each category:
2. Use a protractor to measure and draw the angles:
- Draw a 108-degree section for Agriculture.
- Next, draw a 72-degree section for Industrial and Minerals.
- Then, draw a 45-degree section for Irrigation & Power.
- Follow with an 81-degree section for Communication.
- Finally, draw a 54-degree section for Miscellaneous.
Label each section of the pie chart with the corresponding category name and the amount in crores.
You should now have a pie chart that visually represents the proposed outlay during the fourth five-year plan.
Topper's Solved these Questions
Similar Questions
Draw a pie-diagram for the following data of the investment pattern in a five year plan: Agriculture , Irrigation and Power, Small Industries, Transport, Social service, Misc. 14%, 16%, 29%, 17%, 16%, 8%
View SolutionThe following pie chart gives he distribution of funds in a five year plan under the major heads of development expenditures:
Agriculture (A), Industry (B), Education (C), Employment (D) and Miscellaneous (E)
The total allocation is 36,000 (in crores of rupees).
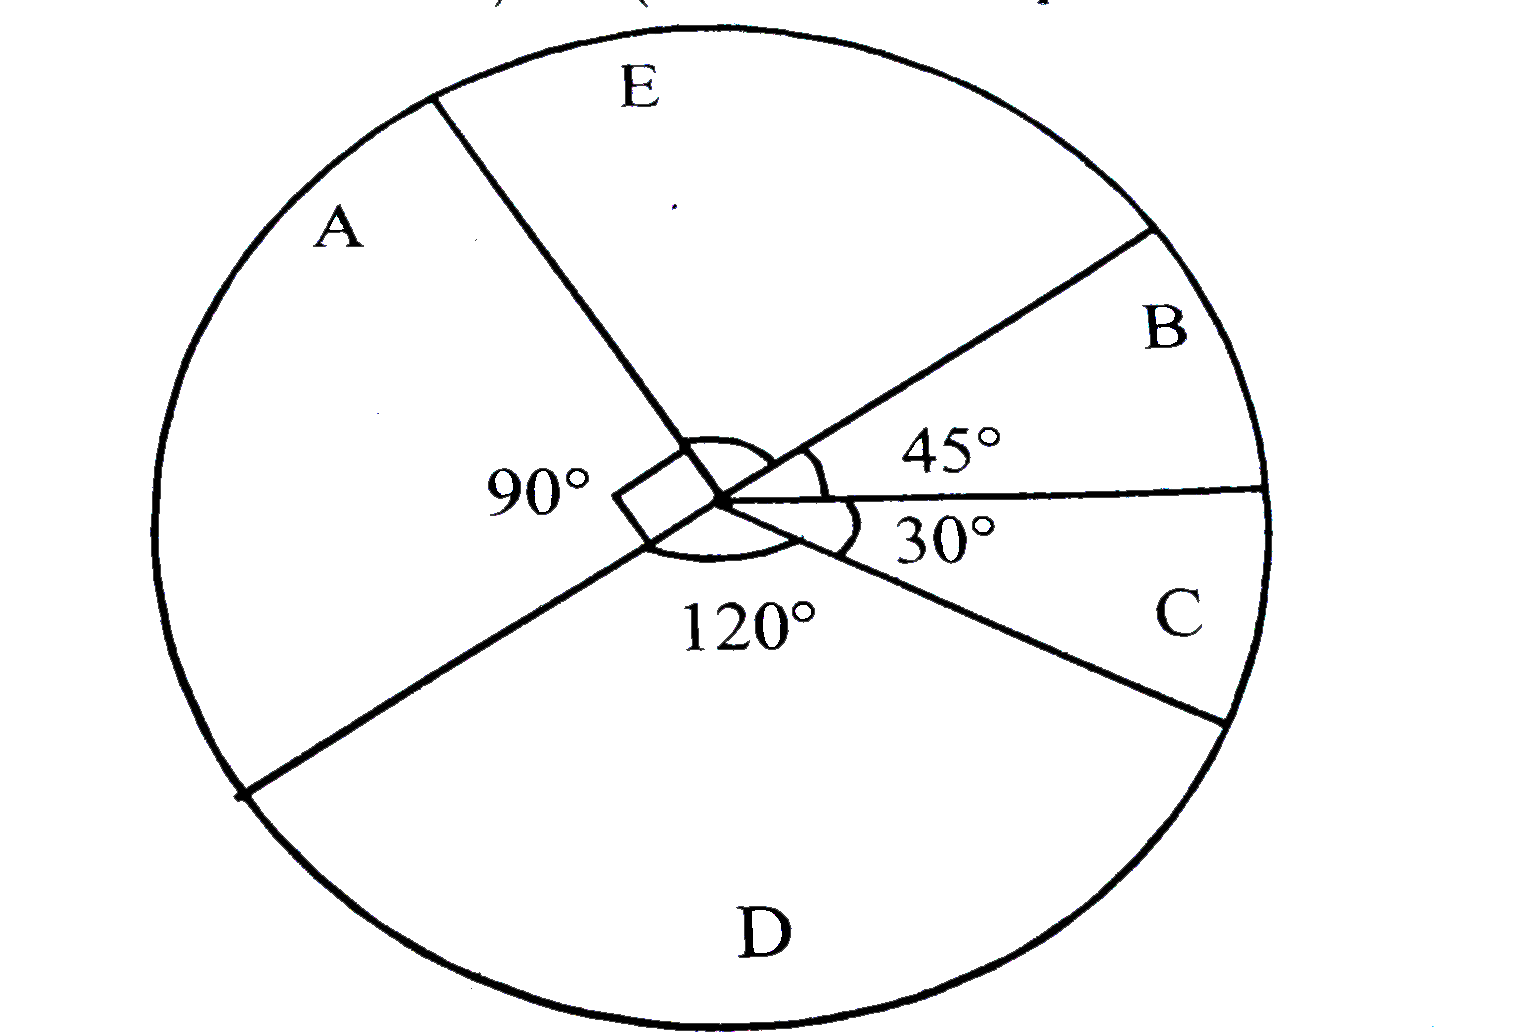
Which head is allocated maximum funds ?
View Solution
Knowledge Check
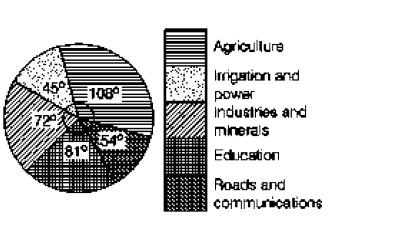
The adjoining pie chart represents the proposed outlay of the fifth year plan of 40000 crore . The amount (in X crore) proposed on irrigation and power is less than that on industries and minerals by
 A3000B3500C2000D2500
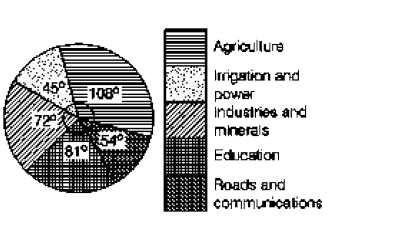
The adjoining pie chart represents the proposed outlay of the fifth year plan of 40000 crore .The amount proposed on agriculture is more than that on industries and minerals by
 A0.075B0.1C0.12D0.125
The pie-chart shows the proposed outlay fdor different sectors during a Five-Year plan of Government of India. Total outlay is Rs. 40,000 crores. By reading the pie-chart answer the following three questions.
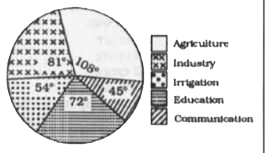
If the proposed outlay of Irrigation is x% of the proposed outlay of Agriculture, then x is equal toA50%B15%C25%D75%
Directions : The pie chart shows the proposed outlay for different sectors during a Five-Year plan of Government of India. Total outlay is Rs. 40,000 crores. By reading the pie-chart answer the following three questions.
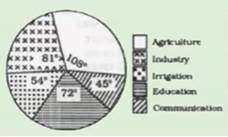
find the proposed outlay of outlay of Irrigation and Communication ?
View SolutionThe following data give year wise outlay in lakhs of rupees in a certain 5 year plan (1980-1985) of a state ,under the heads :
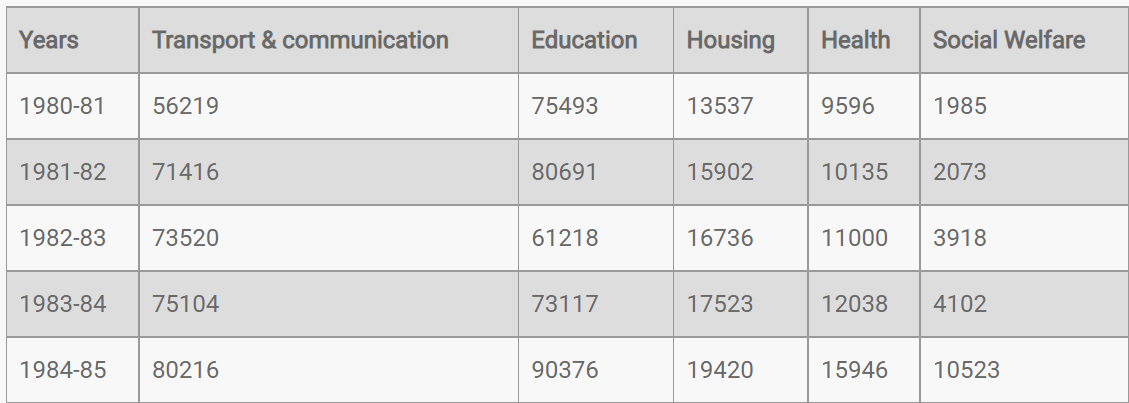
Putting the data in the form of a table ,write the total under each head and answer the following question -----
During which year the outlay on education was maximum ?
View SolutionThe following data shows the agriculture production in India during a certain year.| Food grain | Rice, Wheat Pulses Maize Coarse Cereals Production 106, 74, 24, 4, 20| (in millions of tons)Draw a pie chart to represent the above data.
View SolutionThe following data give year wise outlay in lakhs of rupees in a certain 5 year plan (1980-1985) of a state ,under the heads :
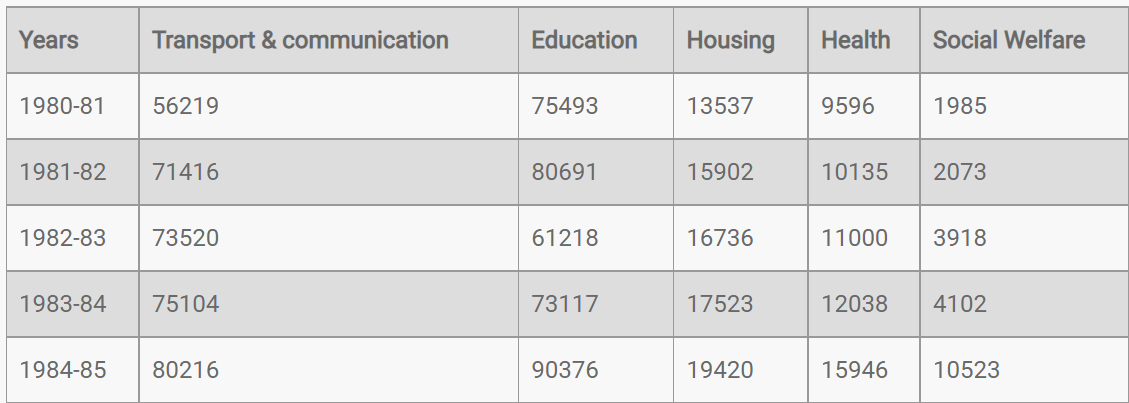
Putting the data in the form of a table ,write the total under each head and answer the following question -----
What is total outlay on Social Welfare during the plan period __ (lakhs )?
View SolutionThe following data give year wise outlay in lakhs of rupees in a certain 5 year plan (1980-1985) of a state ,under the heads :
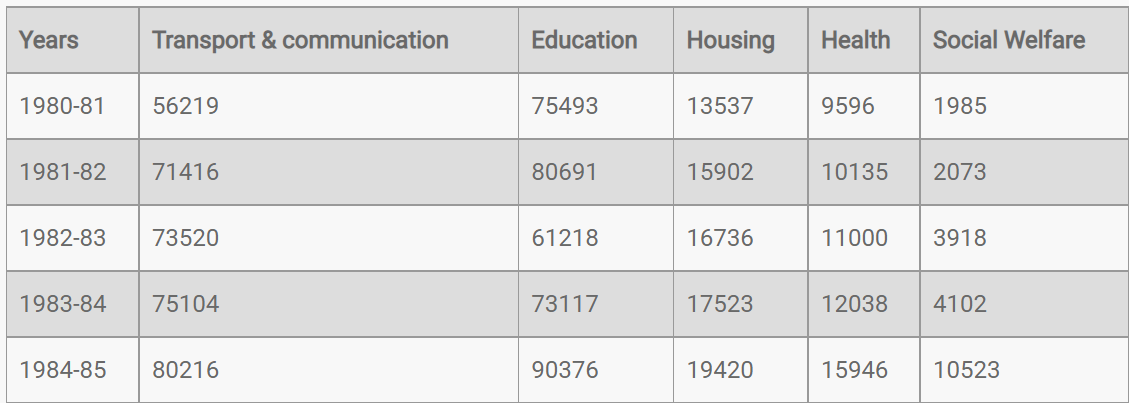
Putting the data in the form of a table ,write the total under each head and answer the following question -----
What is the ratio between outlay on Transport & communication and Housing during 1984-85?
View Solution
