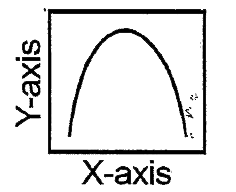
The curve given below show enzymatic activity with relation to three conditions (pH, temperature and substrate concentration)
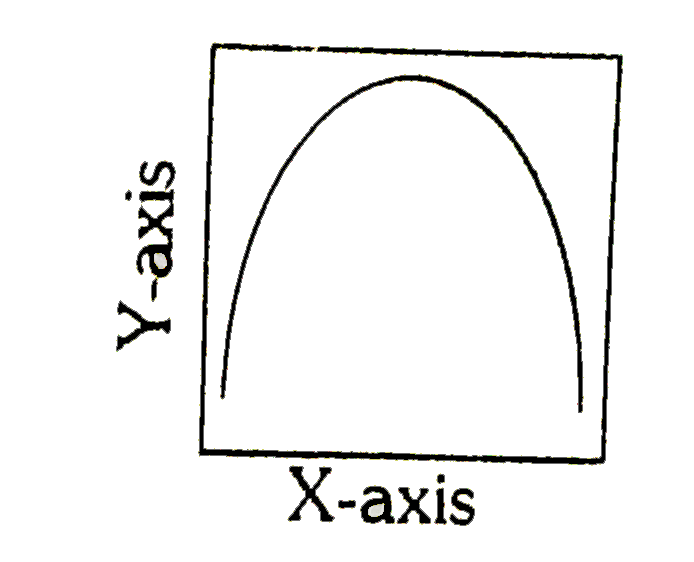
What do the two axises (x and y) represent
X-axisY-axis(a)enzymatic activitypH
X-axisY-axis(b)temperatureenzyme activity
X-axisY-axis(c)substrate concentrationenzymatic acitvity
X-axisY-axis(d)enzymatictemperature
The correct Answer is:B
Step by step video & image solution for The curve given below show enzymatic activity with relation to three conditions (pH, temperature and substrate concentration) What do the two axises (x and y) represent by Biology experts to help you in doubts & scoring excellent marks in Class 11 exams.
Updated on:21/07/2023Topper's Solved these Questions
- BIOMOLECULES Book:PRADEEPChapter:BIOMOLECULES Exercise:PRACTICE QUESTIONS (ASSERTION-REASON )
Explore 31 Videos
- BIOMOLECULES Book:PRADEEPChapter:BIOMOLECULES Exercise:ANALYTICAL QUESTIONS WITH ANSWERS
Explore 19 Videos
- BIOLOGICAL CLASSIFICATIONBook:PRADEEPChapter:BIOLOGICAL CLASSIFICATIONExercise:Practice Questions (II. Assertion-Reason Type Questions)
Explore 8 Videos
- BODY FLUIDS AND CIRCULATIONBook:PRADEEPChapter:BODY FLUIDS AND CIRCULATIONExercise:Practice Questions (II. Assettion-Resson Type Questions)
Explore 11 Videos
Similar Questions
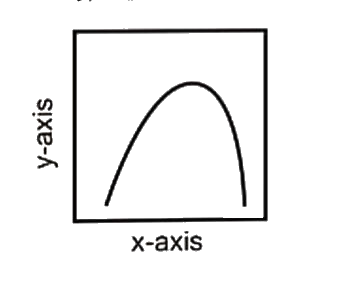
The curve given below shows enzymatic activity with relation to three conditions (pH, temperature and substrate concentration). What does the two axis (x and y) represent ?
View SolutionThe graph given below represents the organisms reponse to temperature as an environmental conditions :
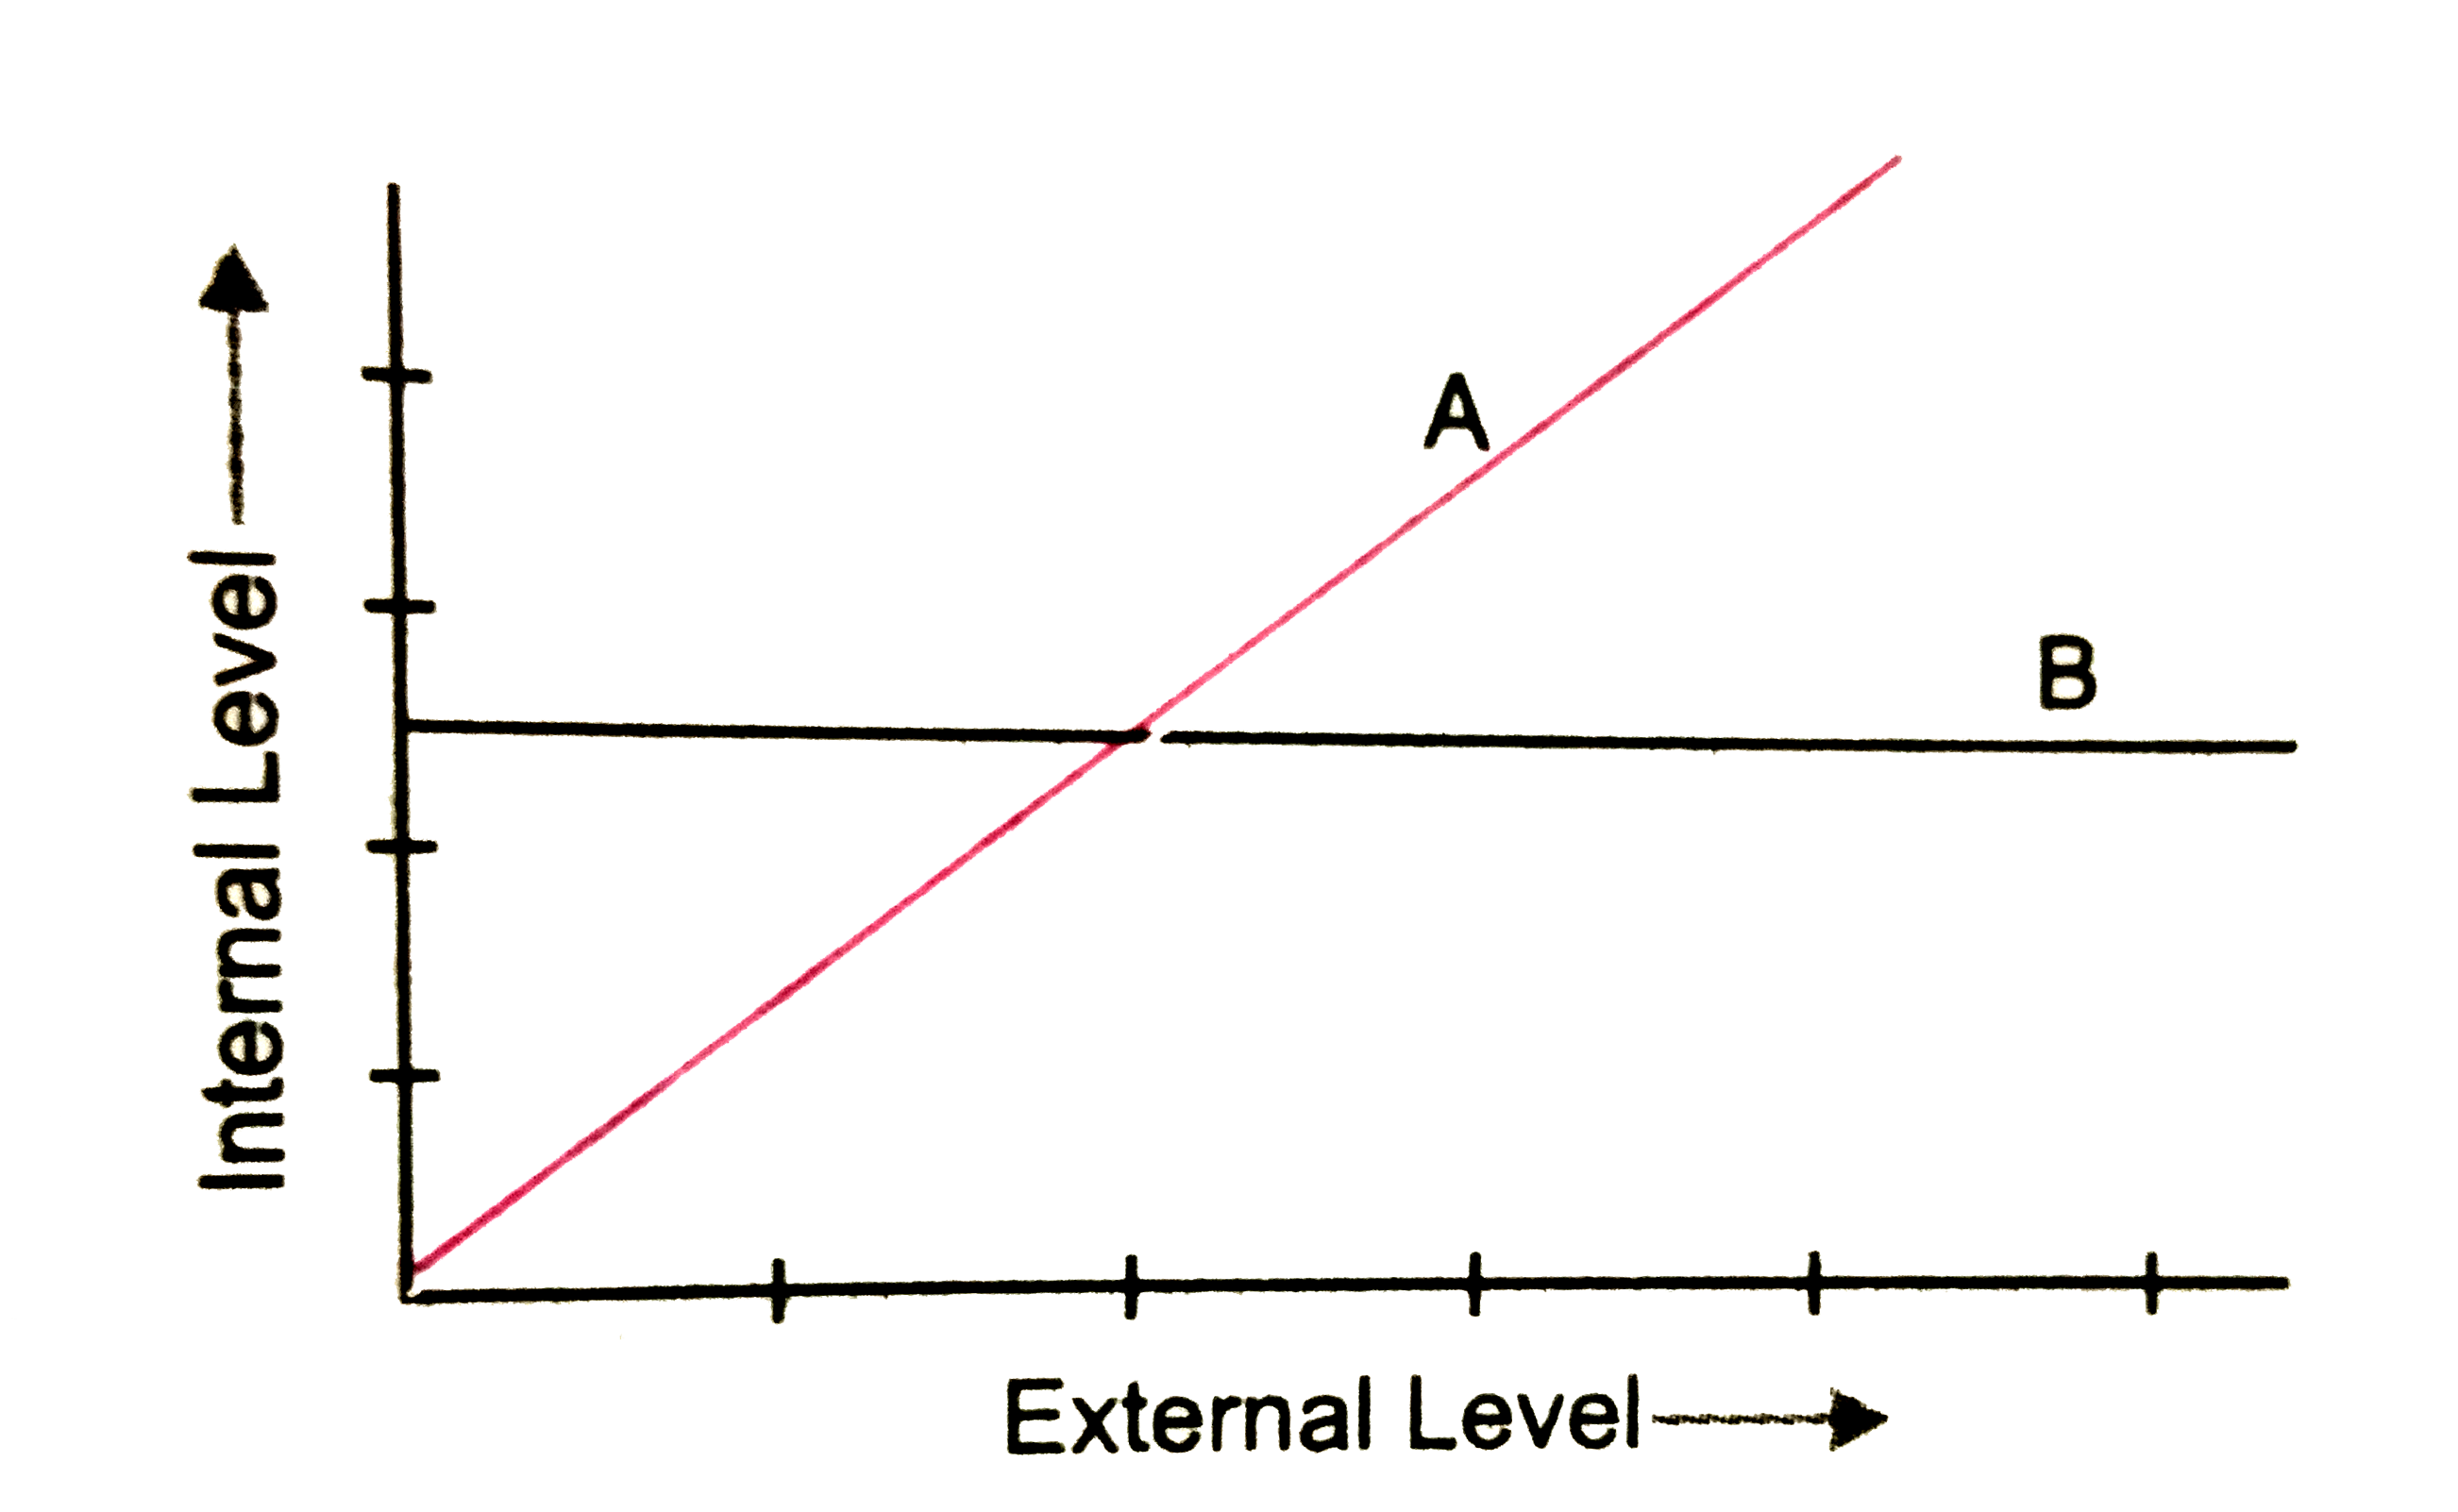
(i) Which one of the two lines represents conformers and why ?
(ii) What does the other line in the graph represent and why ?
(b) Mention the different adaptations the parasites have evolved with , to be able to successfuly complete their life cycle in their hosts.
View Solution
Knowledge Check
The curve given below shows enzymatic activity with relation to three conditions (pH, temperature and substrate concentration). What does the two axis (x and y) represent ?
 AX-axis: Enzymatic activity, Y-axis: pHBX-axis: Temperature, Y-axis: Enzyme activityCX-axis: Substrate concentration, Y-axis: Enzymatic activityDX-axis: Enzymatic activity, Y-axis: Temperature
the curve given below shows wnzymatic acitvity with relation to three conditions (pH , temperature and substrate concentration ).
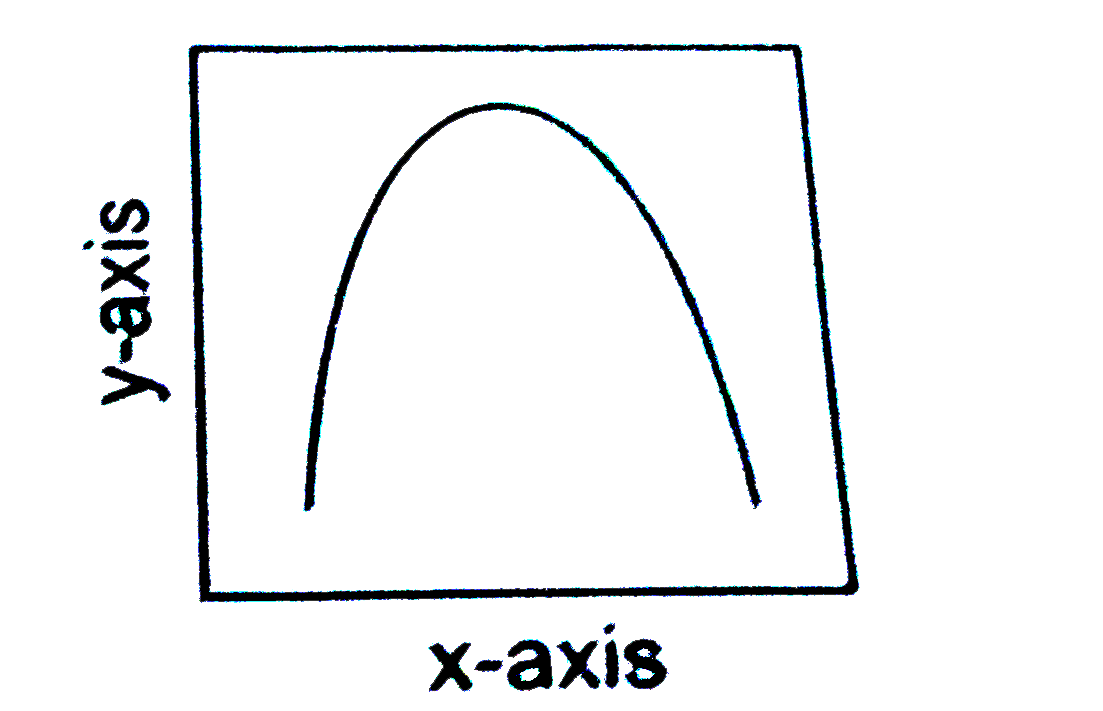
what do the two axes ( x and y) represent ?AEnzymatic acticity , temperatureBEnzymatic activity ,pHCTemperature enzye activityDSubstrate concentration enzymatic activityThe curve given show enzymatic activity with relation to three conditions (pH, temp: and substrate conc.). What do the two axises (x and y) represent?
 Ax-axis - Enzymatic activity, y-axis - pHBx-axis - Temperature, y-axis - Enzyme activityCx-axis - Substrate conc., y-axis - Enzymatic activityDx-axis - enzymatic activity, y-axis - temperature
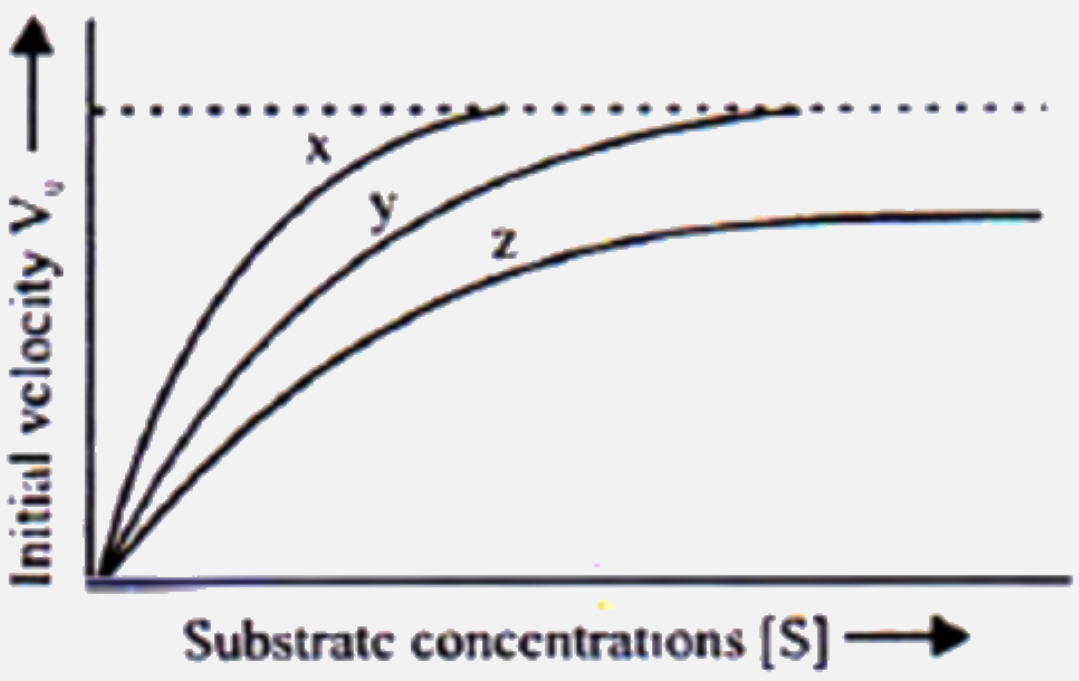
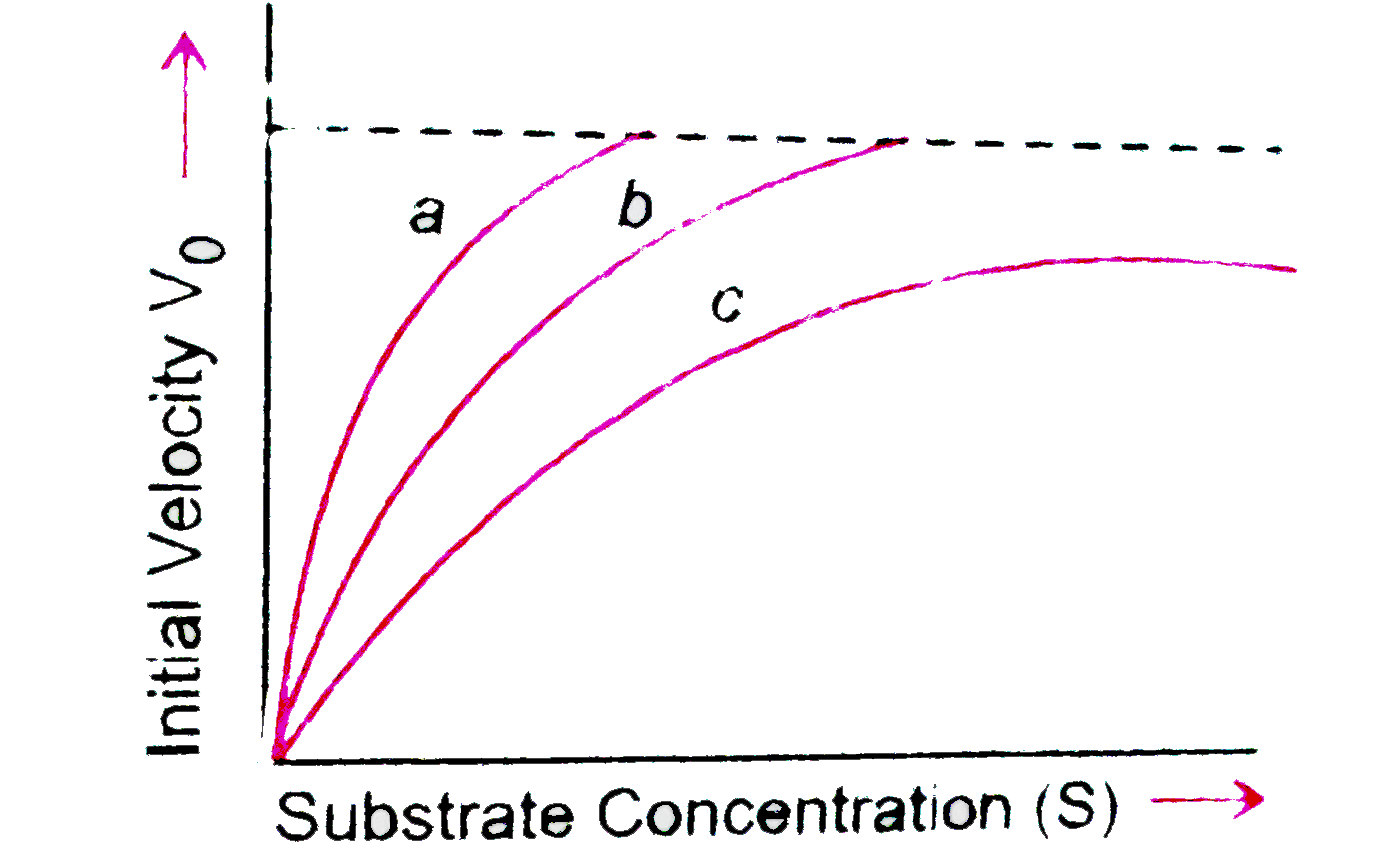
The Given figure shows three velocity-substrate concentration curves of an enzyme reaction. What do the curves X Y and Z depict respectively ?
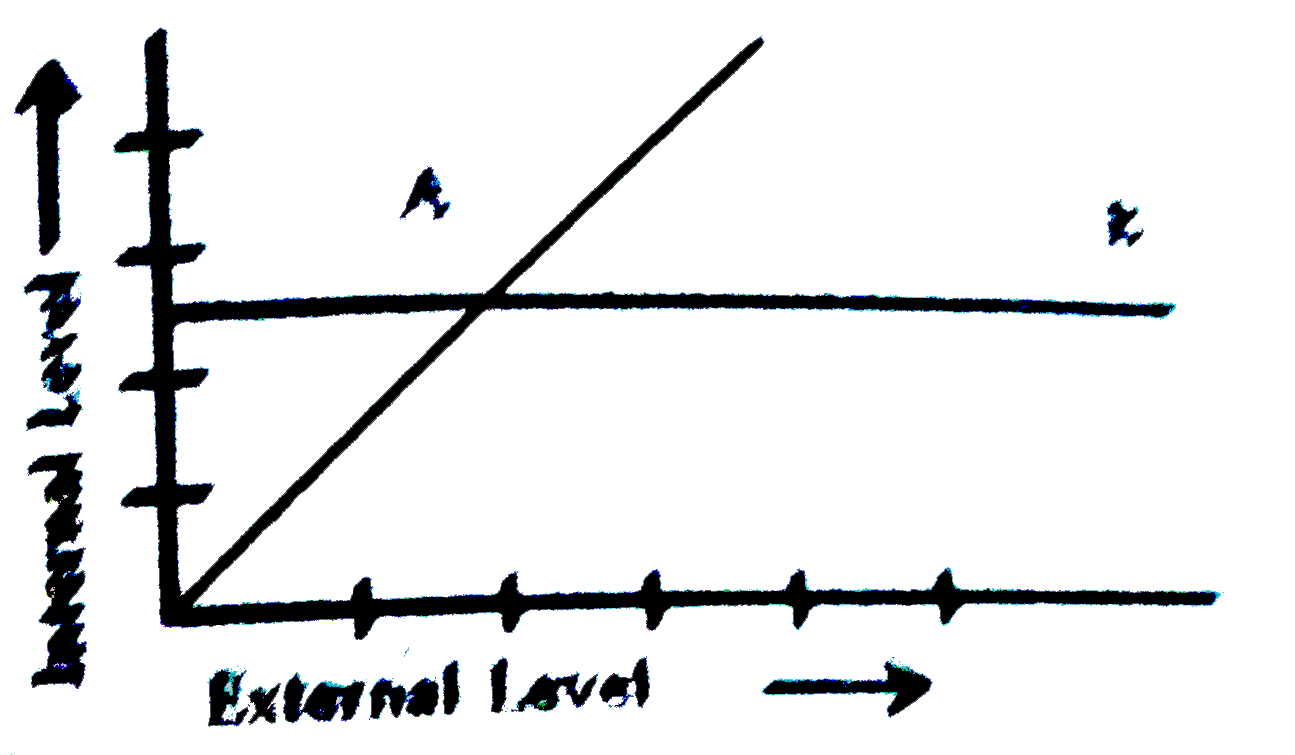
View Solution(a) The graph given below represents the organisms response to temperature as an environmental condition.
(i) Which one of the two lines represents conformers and why ?
(ii) What does the other line in the graph represent and why ?
(b) Mention the different adaptations the parasites have evolved with, to be able to successfully complete their life cycles in their hosts.
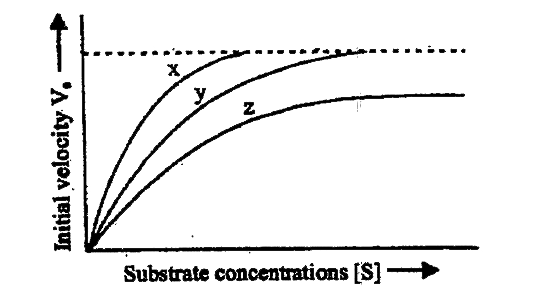
View SolutionThe given figure shows three velocity-substrate concentration curves for an enzyme reaction. What do the curves x, y and z depict respectively?
View SolutionFigure given below shows three velocity-substrate concentration curves for an enzyme reaxtion. What do the curves for an enzyme reaction. What do the curves depict
View SolutionThe rate law expresses the relationship of the rate of a reaction to the rate constant and the concentration of the reactants raised to some powers for the general reaction.
aA+bB→cC+dD
Rate law takes the form
r=k[A]x[B]y
where x and y are number that must be determined experimentely k is the rate constant and [A] and [B] are concentration of A & B respectively.
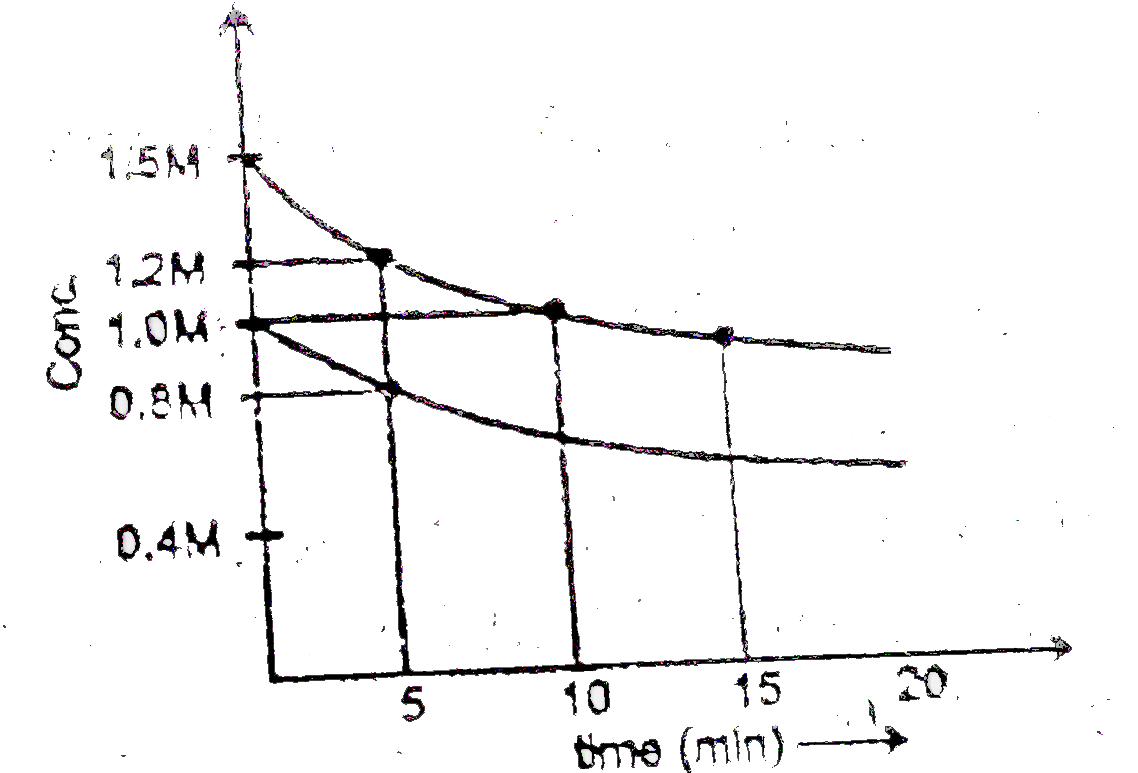
The varitation of concentration of 'A' with time in two experiments starting with two different initial concentration of 'A' is given by the following graph.The reaction is represented by A(aq)→B(aq) what is rate of reaction (M/min) when conc. of A in aqueous solution was 1.8 M:
View Solution