Study the following graph and answer the question given below :
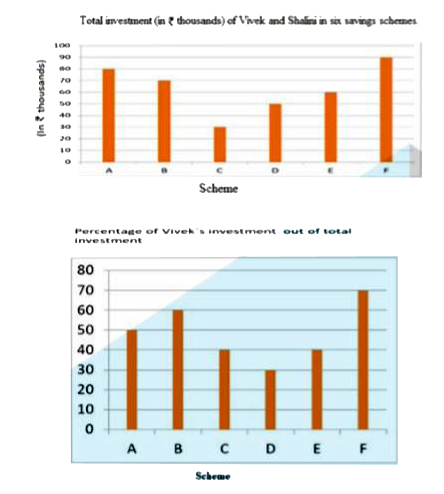
What is the average amount invested by Vivek in savings schemes A, B, C and D ?
Rs 27,200
Rs 28, 500
Rs 27,250
Rs 27, 000
The correct Answer is:C
Step by step video & image solution for Study the following graph and answer the question given below : What is the average amount invested by Vivek in savings schemes A, B, C and D ? by Maths experts to help you in doubts & scoring excellent marks in Class 14 exams.
Updated on:21/07/2023Similar Questions
Study the following graph and answer the questions given below: What is the average amount invested by Vivek in saving schemes A, B, C and D?
निम्नलिखित आरेख का अध्ययन करें और नीचे दिए गए प्रश्नों के उत्तर दें: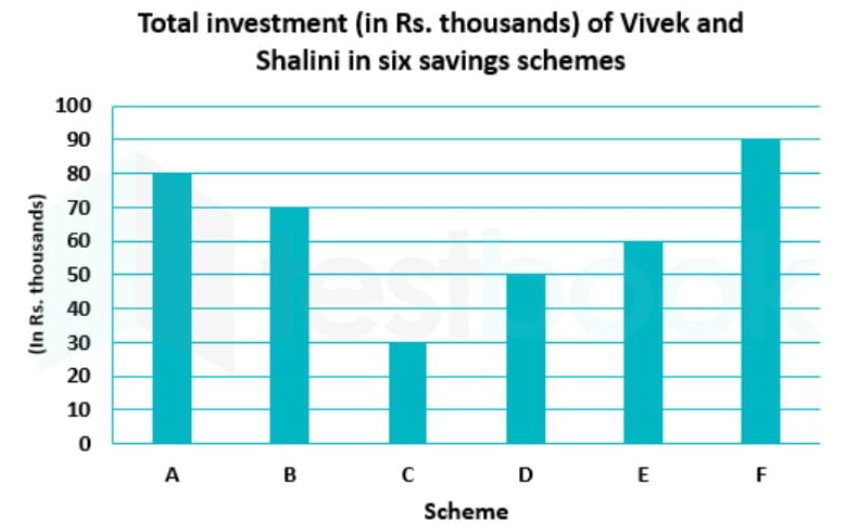
बचत योजनाओं A, B, C, D में विवेक द्वारा निवेश की गई औसत राशि क्या है?
View SolutionStudy the following graph and answer the question given below :
What is the ratio of the total amount invested by vivek in schemes A and C together to the total amount invested by Shalini in schemes A and C together ?
View Solution
Knowledge Check
Read the following graph and answer the questions given below
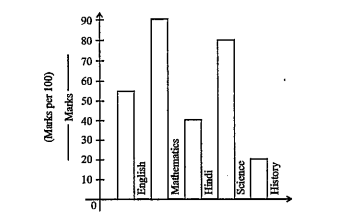
average marks obtained by the student isA57B63C80D48Study the following graph and answer the questions given below -----
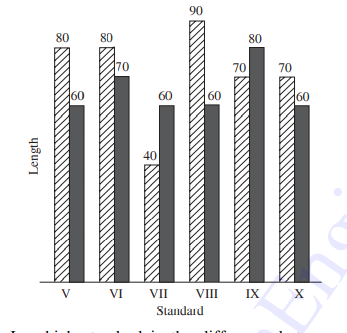
In which standard is the failure of girls lowest ?AXBVIICVIIIDVStudy the following graph carefully and answer the questions that
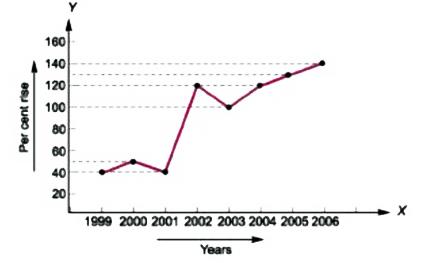
What was the average of percent rise over the given years ?A1.1B1.05C100.5%D92.5%
Read the following graph carefully and answer the questions given below:
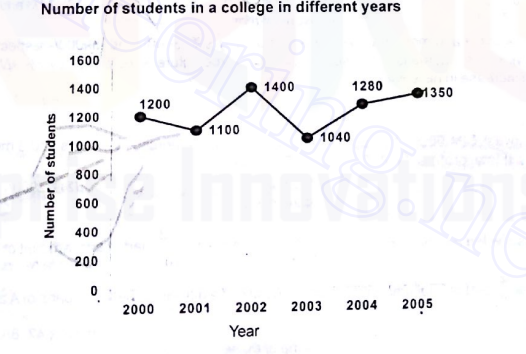
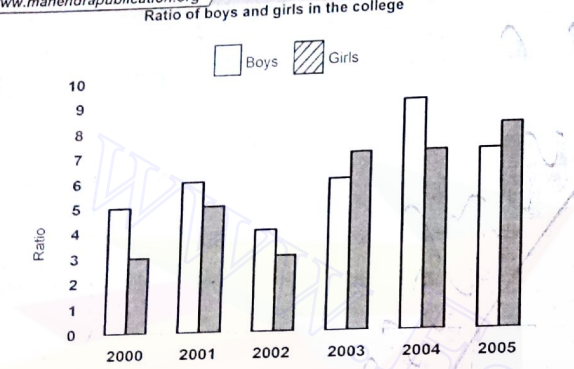
What is the average number of girls in all the years?
View SolutionStudy the following graph and answer the questions given below it.
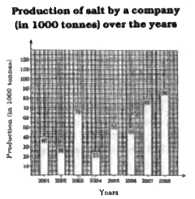
What was the percentage increase in production of salt in 2008 compared to that of 2001 ?
View SolutionStudy the following bar graph and answer the questions given below.
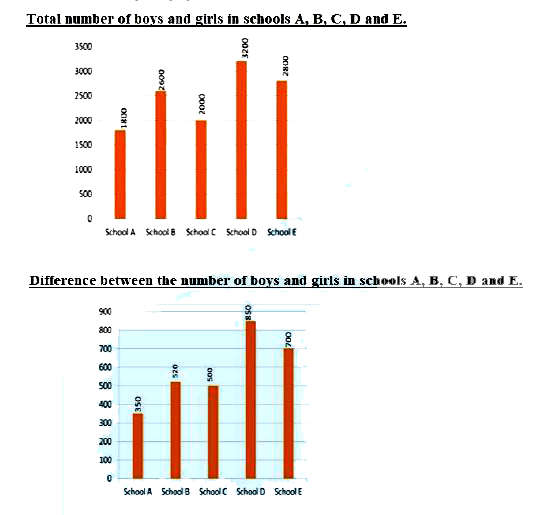
What is the ratio of numbers of boys to the number of girls in school E?
View SolutionStudy the following graph and answer the questions given below it.
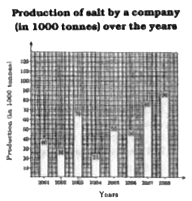
What was the percentage decline in the product of salt from 2003 to 2004 ?
View SolutionStudy the following bar graph and answer the questions given below
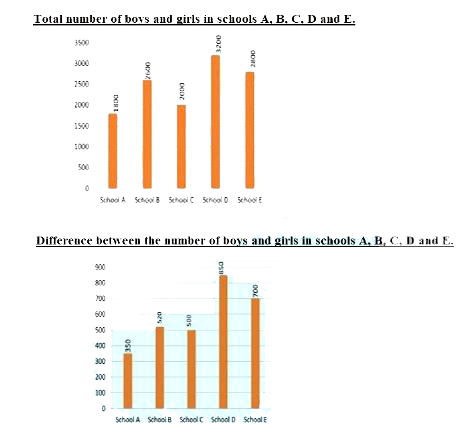
What is the difference the number of girls in school A and the number of girls in school C?
View Solution
