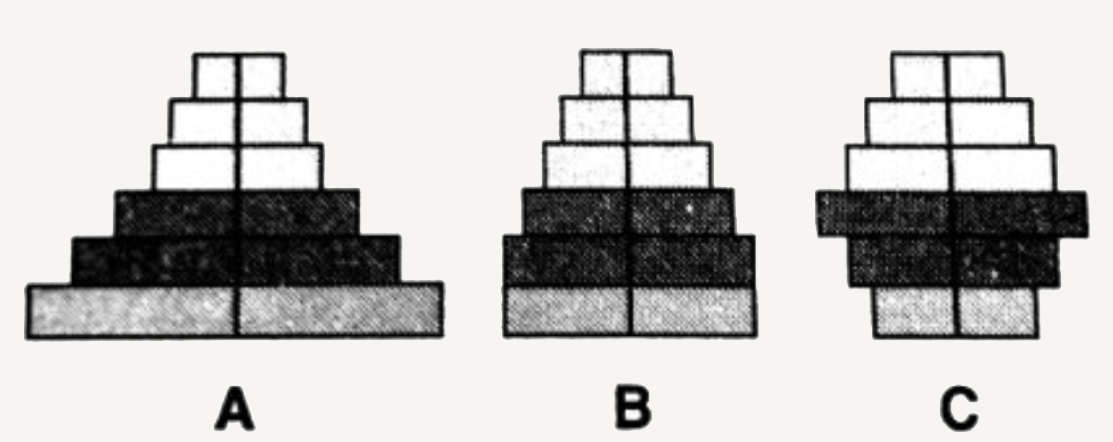
A country with a high rate of population growth took measures to reduce it. The figure below shows agesex pyramids of populations A and B twenty years apart. Select the correct interpretation about them:
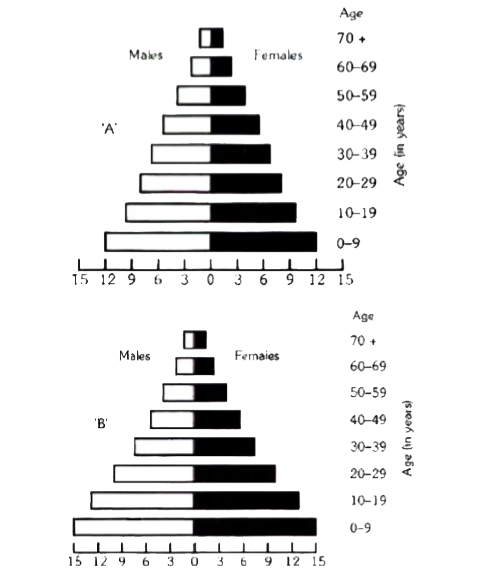
A' is the earlier pyramid and no cba.nge has occurred in the growth rate.
'A' is more recent and shows slight reduction in the growth rate.
B' is earlier pyramid and shows stabilized growth rate
'B' is more recent showing that population is very young
The correct Answer is:B
Step by step video & image solution for A country with a high rate of population growth took measures to reduce it. The figure below shows agesex pyramids of populations A and B twenty years apart. Select the correct interpretation about them: by Biology experts to help you in doubts & scoring excellent marks in Class 12 exams.
Updated on:21/07/2023Topper's Solved these Questions
- ORGANISMS AND POPULATIONS BOOK - PRADEEPCHAPTER - ORGANISMS AND POPULATIONS EXERCISE - Practice Questions (II. Assertion - Reason Type Questions)
18 Videos
- ORGANISMS AND POPULATIONS BOOK - PRADEEPCHAPTER - ORGANISMS AND POPULATIONS EXERCISE - Analytical (Questions with Answers)
20 Videos
- ORGANISMS AND POPULATIONORGANISMS AND POPULATIONSBOOK - PRADEEPCHAPTER - ORGANISMS AND POPULATIONORGANISMS AND POPULATIONSEXERCISE - Additional Questions (Very Short Answer Questions)
1 Videos
- PRINCIPLES OF INHERITANCE AND VARIATION BOOK - PRADEEPCHAPTER - PRINCIPLES OF INHERITANCE AND VARIATION EXERCISE - ASSERTION-REASON TYPE QUESTIONS
15 Videos
Similar Questions
Knowledge Check
Representation of age pyramids for human population is given below. Identify A, B and C by selecting the correct option:
 AABCDecliningStableExpandingBABCStableExpandingDecliningCABCExpandingStableDecliningDABCStableDecliningExpanding
The figures given below show the types of coelom. Identify them and select the correct group of organisms which possess them.
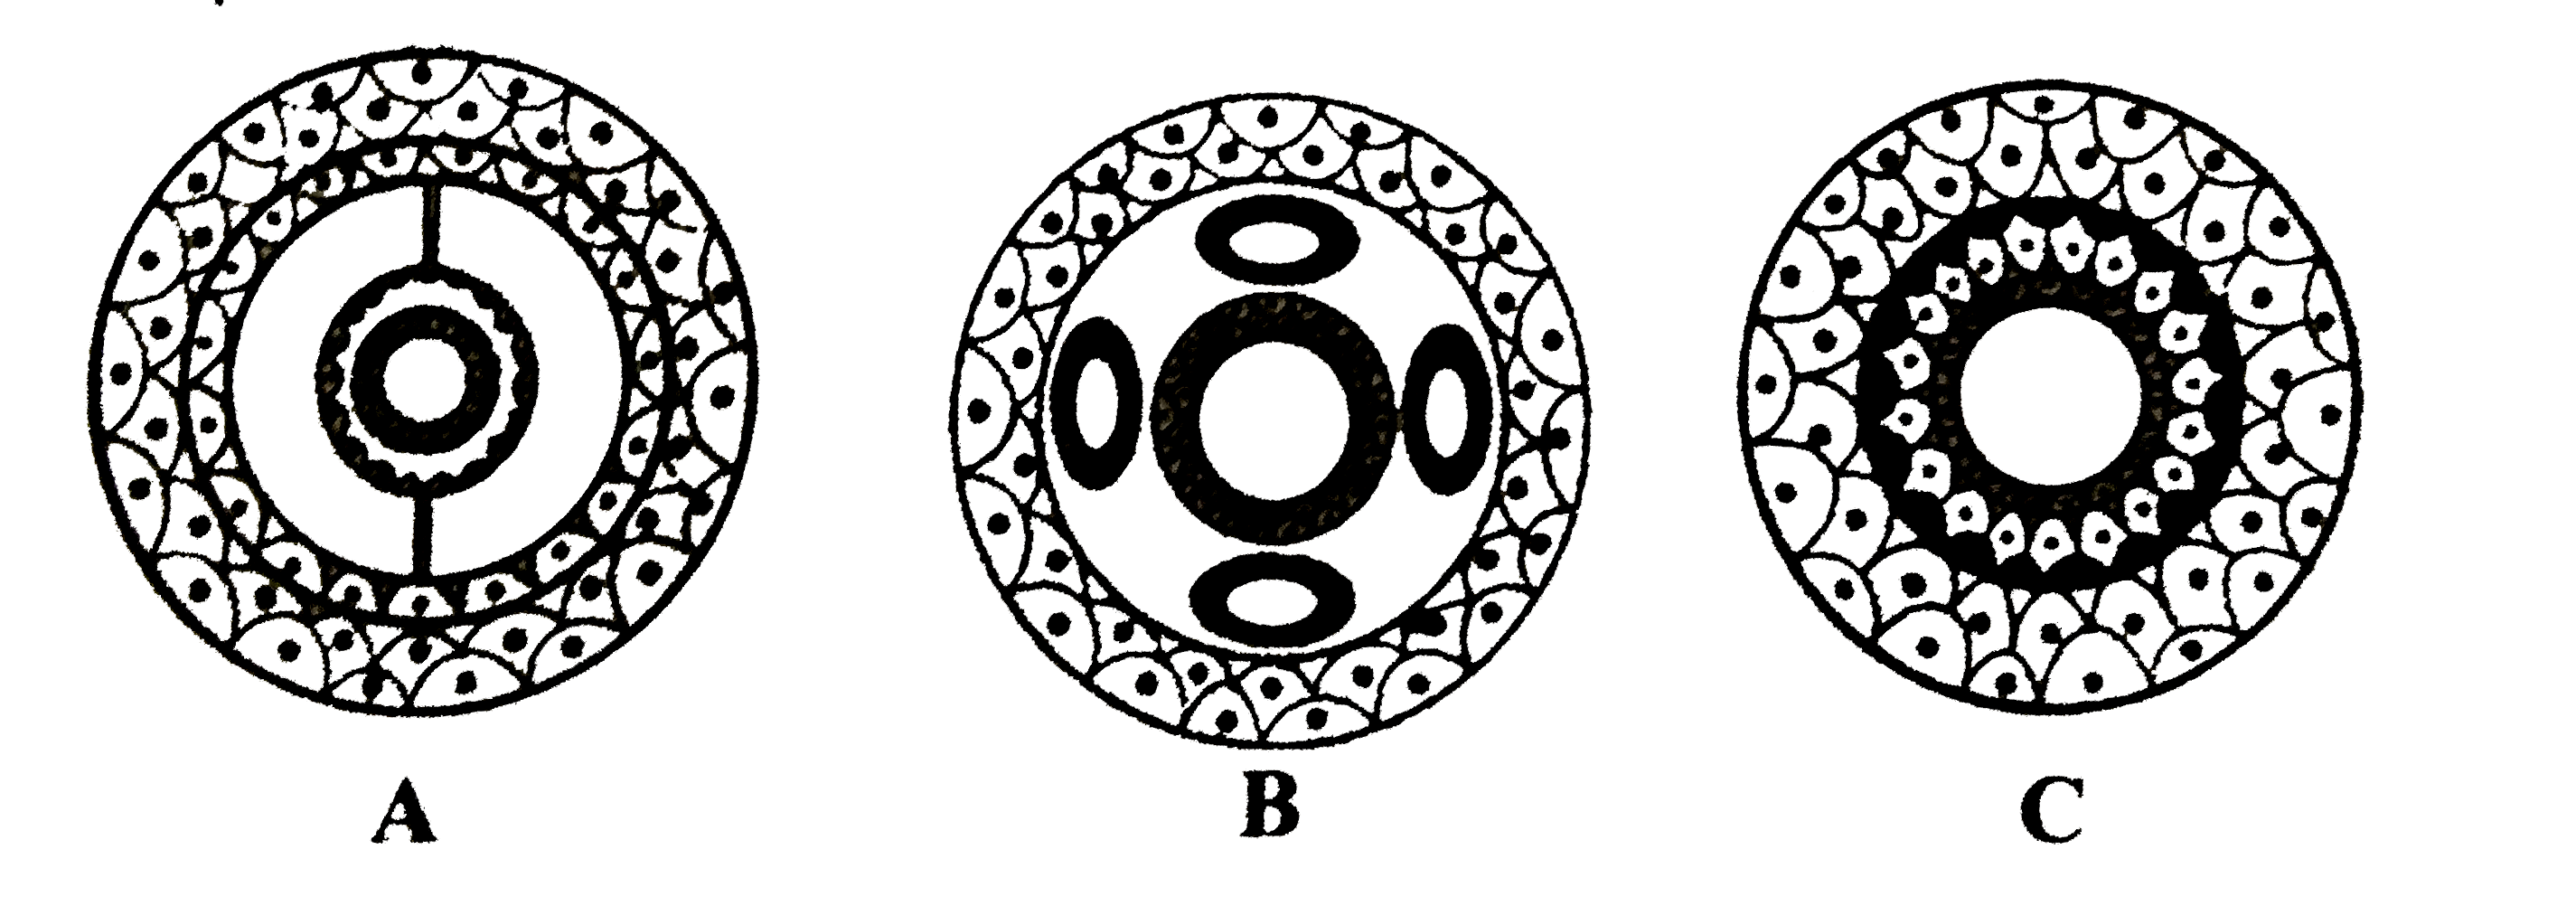 AABCAnnelidsAscheliminthesPlatyhelimthesBABCMolluscsArthropodsPlatyhelimthesCABCEchinodermsAschelminthesAnnelidsDABCEchinodermsArthropodsPlatyhelminthes
The figure below shows development of follicles (A, B, C, D). Select the option giving correct identification together with its function?
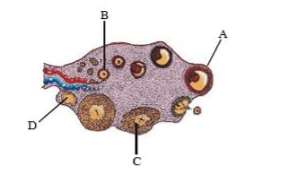 AB – Secondary Follicle – secretes progesteroneBD – Corpus albicans – Secretes estrogenCA – Tertiary follicle – Secretes FSH & LHDC – Corpus luteum – Secretes progesterone
Representation of age pyramids for the human population is given below. Identify A, B, and C by selecting the correct option .
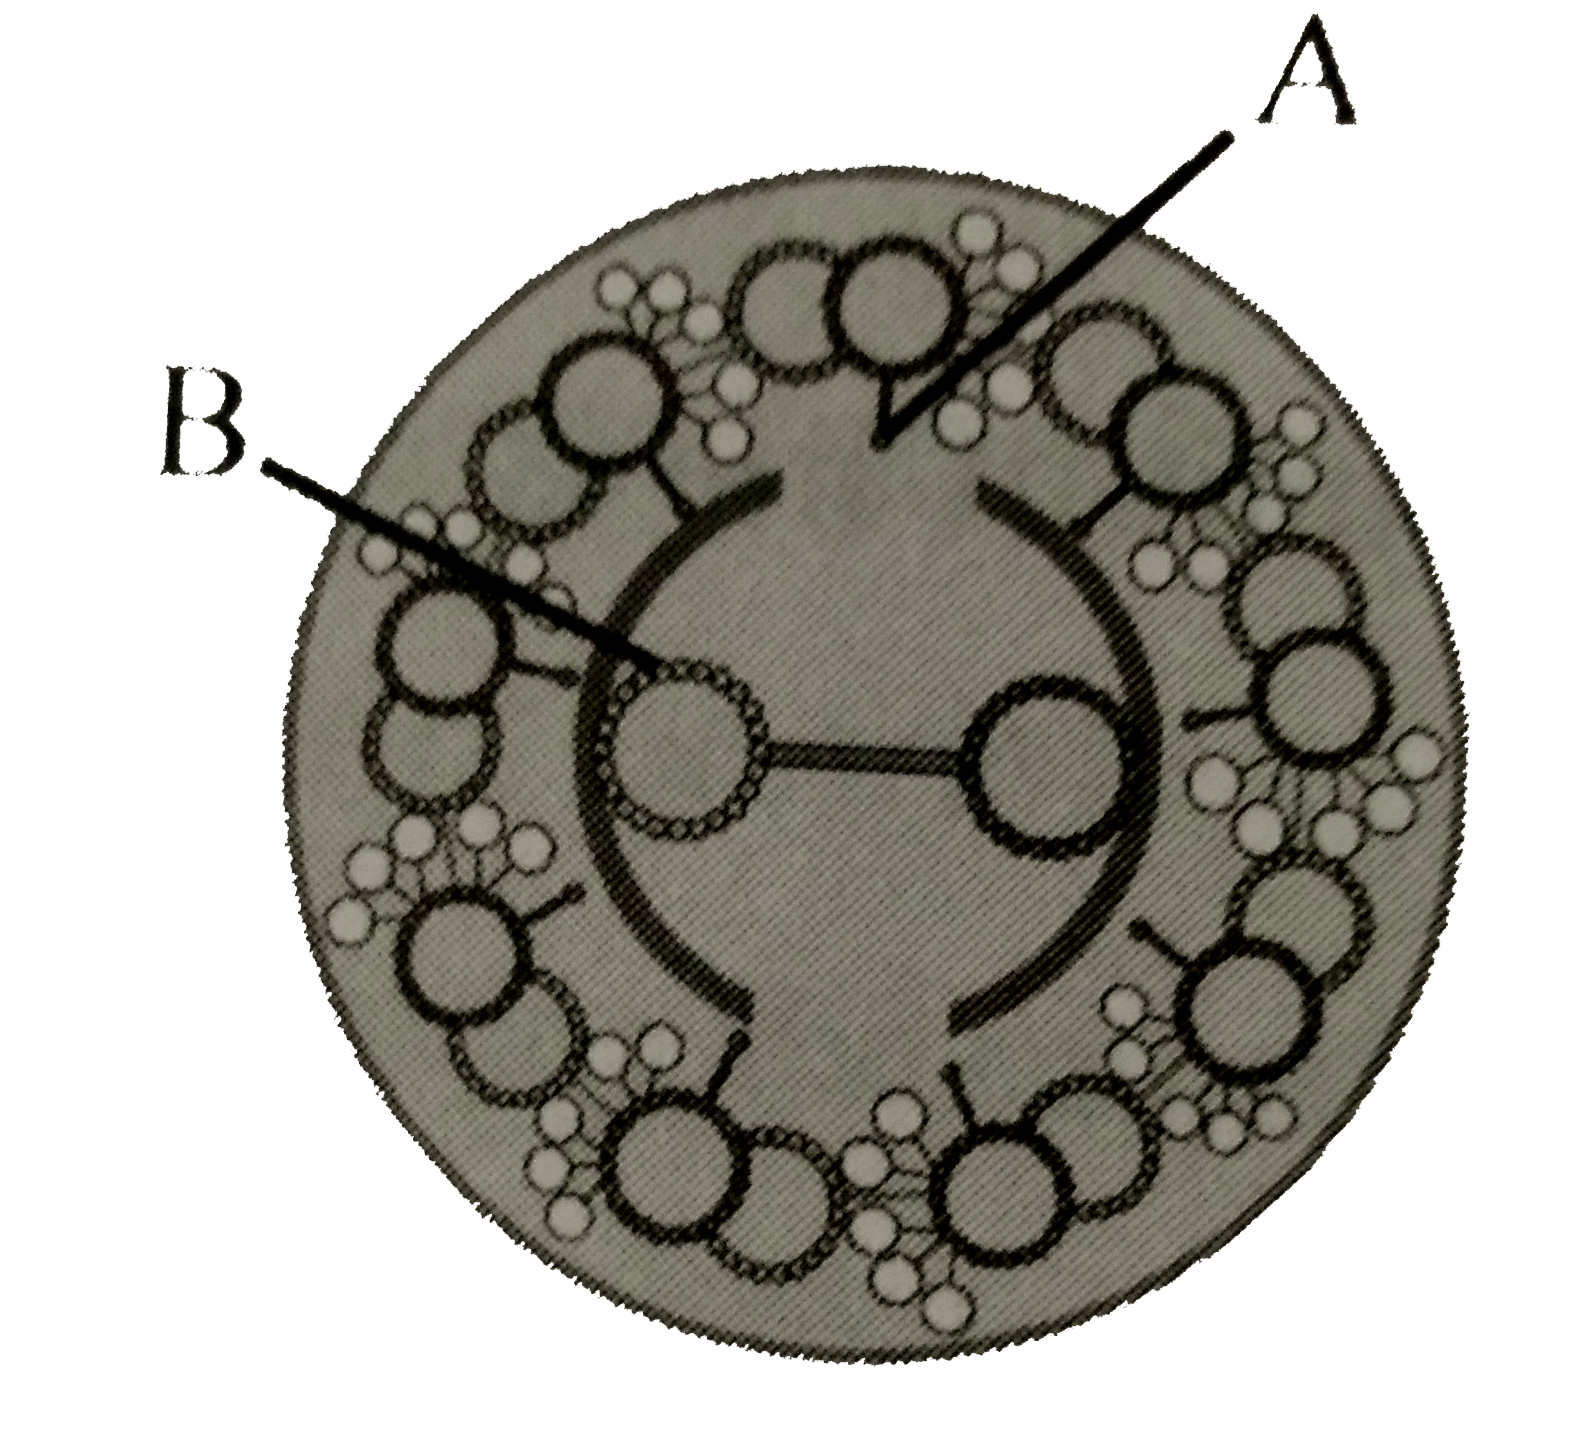
View SolutionThe figure below shows the section of a cillia/flagella showing different parts labelled A and B select the correct labelled name ?
View SolutionMany population colonising a new habitat show a logistic population growth pattern over time, as shown in the figure below.
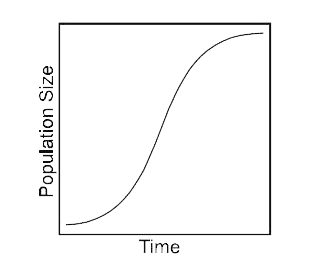
In such a population, the POPULATION growth rate
View SolutionRead the following text and answer the following question on the basis of the same :
Growth of population with time shows specific and predictable patters. Two types of growth patter of populaiton are exponetial and logistic growth . When resource in the habitat are unlimited each species has the ability to relize fully its innate potential to grow in number . Then the population gorws in exponential fashion . When the resource are limited growth curve shows an inital slow rate and then it accelerates and finally slows giving the gorwth curve which is sigmoid .
Study the population growth curves (A and B) in the given graph and select the incorrect statement :
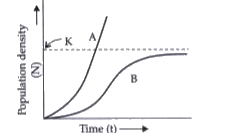
View SolutionRead the following text and answer the following question on the basis of the same :
Growth of population with time shows specific and predictable patters. Two types of growth patter of populaiton are exponetial and logistic growth . When resource in the habitat are unlimited each species has the ability to relize fully its innate potential to grow in number . Then the population gorws in exponential fashion . When the resource are limited growth curve shows an inital slow rate and then it accelerates and finally slows giving the gorwth curve which is sigmoid .
Identify the correct equation that represents the exponential population growth curve:
View Solution

