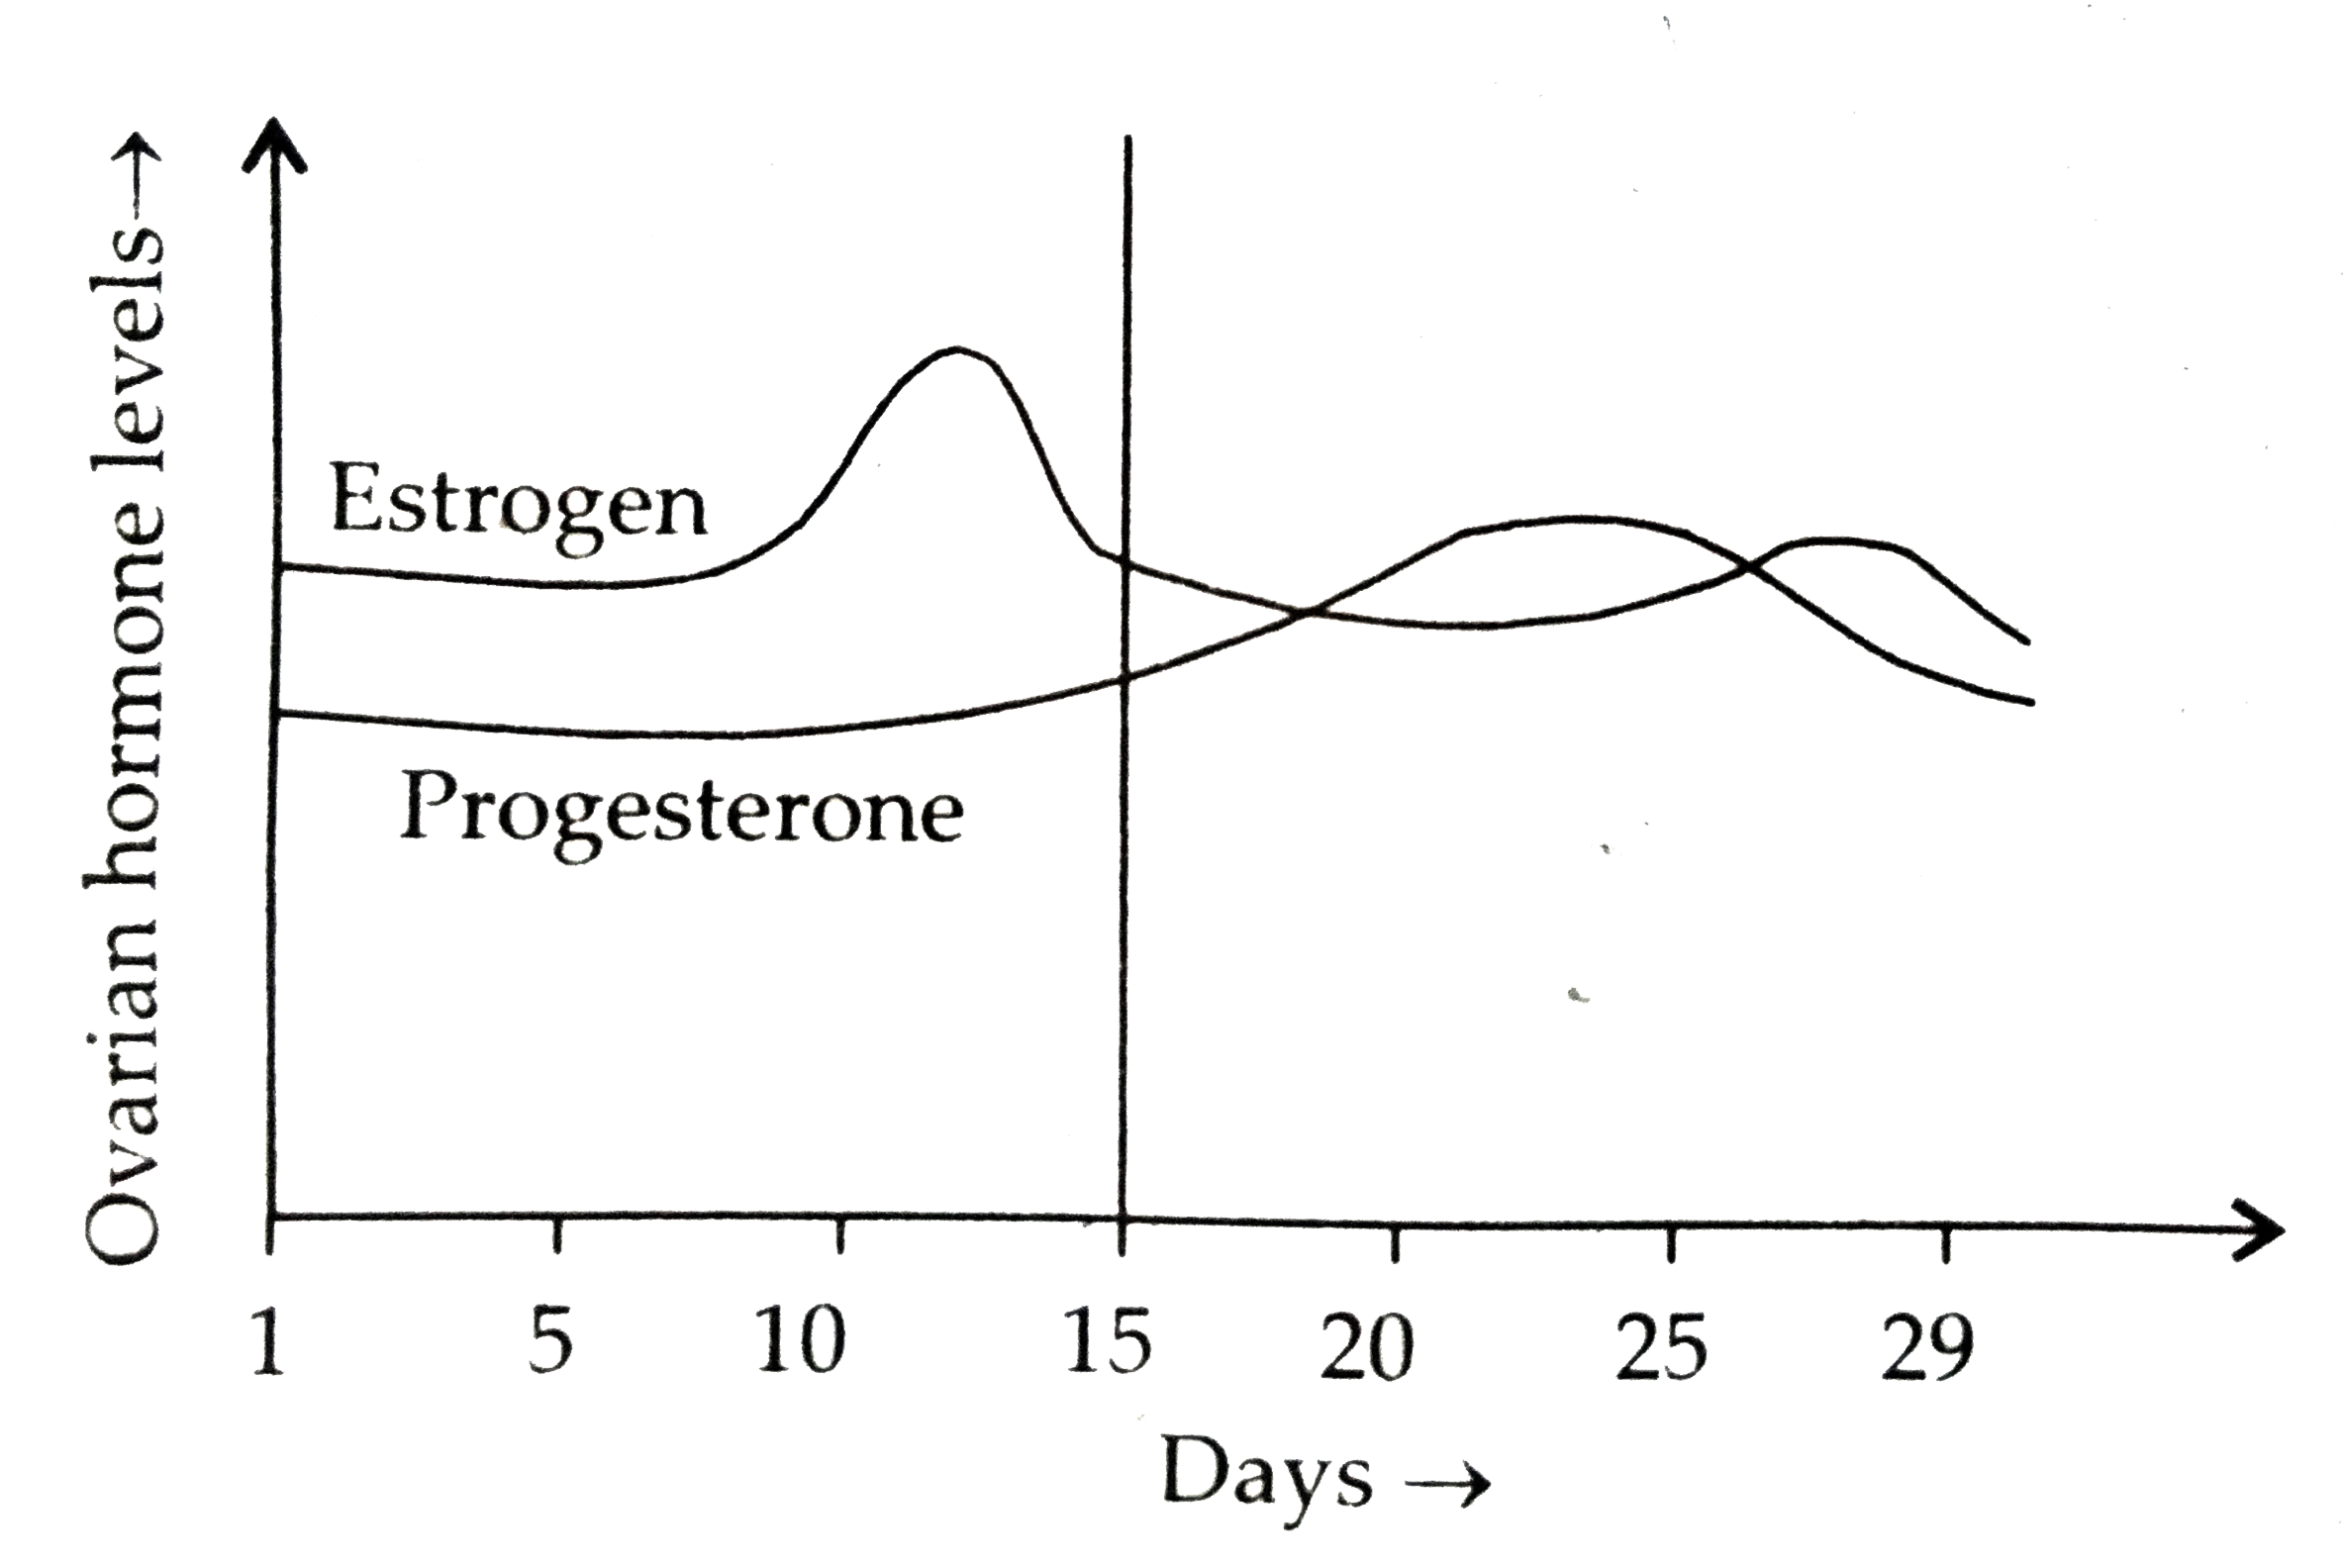
 Read the graph given above and correlate the uterine events that take place according to the hormonal levels on
(i) 6 - 15 days
(ii) 16 - 25 days
(iii) 26 - 28 days (if the ovum is not fertilised )
(b) Specify the sources of the hormones mentioned in the graph.
Step by step video & image solution for Read the graph given above and correlate the uterine events that take place according to the hormonal levels on (i) 6 - 15 days (ii) 16 - 25 days (iii) 26 - 28 days (if the ovum is not fertilised ) (b) Specify the sources of the hormones mentioned in the graph. by Biology experts to help you in doubts & scoring excellent marks in Class 12 exams.
Topper's Solved these Questions
- BOOK - PRADEEPCHAPTER - BIODIVERSITY AND CONSERVATION EXERCISE - PRACTICE QUESTION (ASSERTION REASON TYPE QUESTIONS )10videos
BIODIVERSITY AND CONSERVATION
- BOOK - PRADEEPCHAPTER - BIOTECHNOLOGY AND ITS APPLICATIONS EXERCISE - NCERT EXERCISES PRACTICE QUESTION (II. Assertion Reason Type Question)14videos
BIOTECHNOLOGY AND ITS APPLICATIONS
Similar Questions
Study the graph given below related with menstrual cycle in females:
a. Identify ovarian hormones X and Y mentioned in the graph and specify their source.

Corelate and describe the uterine events that take place according to the ovarian hormone levels X and Y mentioned in the graph on -
i. 6 – 15 days
ii. 16 – 25 days
iii. 26 – 28 days (when ovum is not fertilized)View SolutionRead the graph given beow. Correlate the ovarian events that take place in the human femaek according to the level of the pituitary hormone during the following day.

(i) 10th - 14th days (ii) 14th - 15th days (iii) 16th - 23th days (iv) 25th - 29th days
(If the ovum is not fertilised)View Solution
Knowledge Check
- Question 1 - Select One
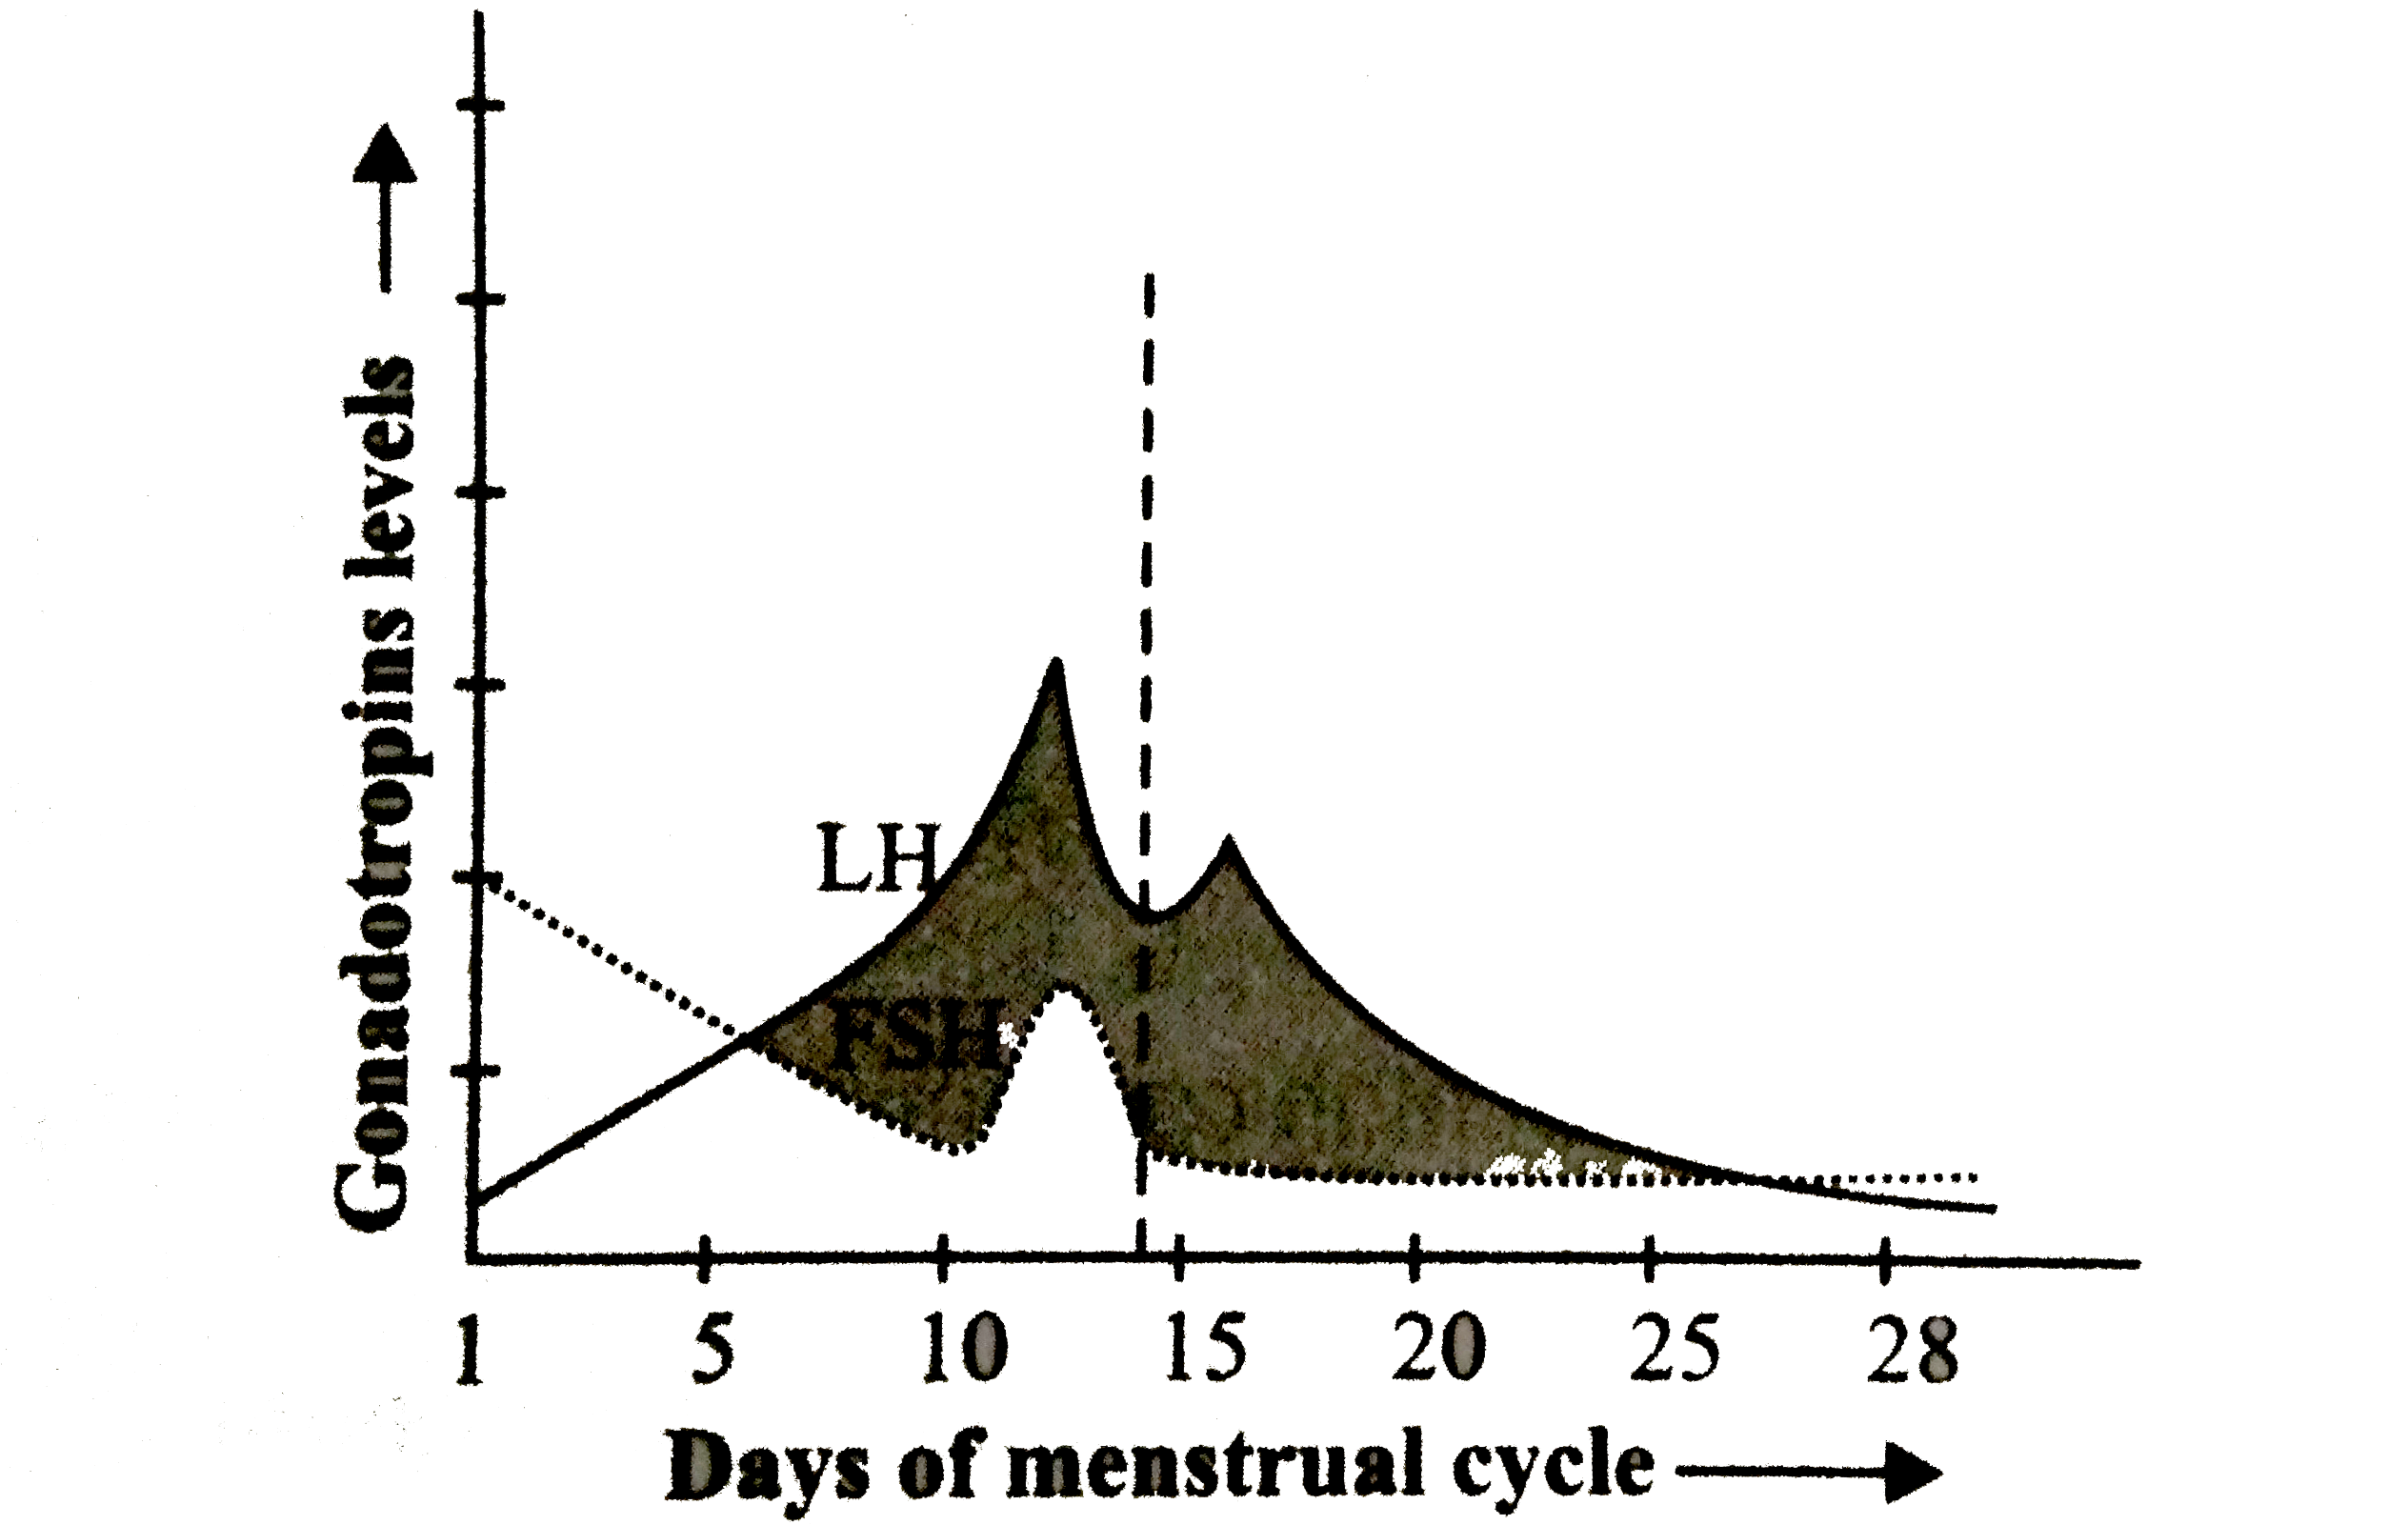
Study the garaph carefully and correlate the hormone levels on
(i) 1-5 days
(ii). 12-14 days
(iii). 25-28 days (if the ovum is not fertilised)A(i) LH decreases and FSH increases
(ii). LH increases and FSH decreases
(iii). LH level maintained and FSH level increasesB(i). LH increases and FSH decreases
(ii). LH decreases and FSH increases
(iii). LH level increases and FSH level maintainedC(i). LH increases and FSH decreases
(ii). LH peaks and FSH peaks
(iii). LH level decreases and FSH level maintainedD(i). LH peaks and FSH peaks
(ii). LH increases and FSH decreases
(iii). LF level decreases and FSH level maintained.
(a) Specify the events which occur in the reproductive system of human female:
(i) If egg is fertilised.
(ii) If egg is not fertilised.
(b) Mention the changes that take place in uterus in both the above events.View SolutionA courter-person cycles from a town to a neighbouring suburban area to deliver a parcel to a merchant. His distances from the twon at different times are shown by the given graph.
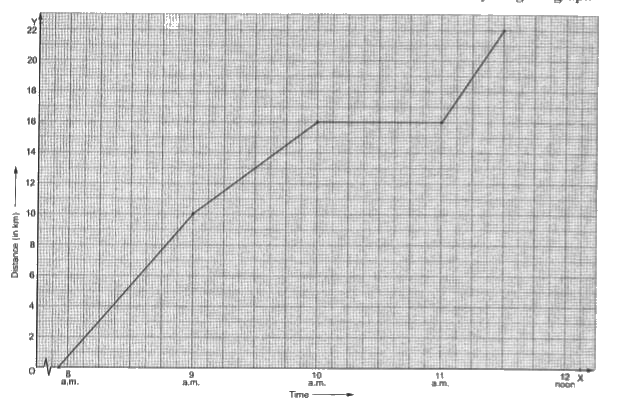
Study the above graph carefully and answer the questions given below:
(i) What is the scale taken for the time-axis?
(ii) How much time did the person take for the travel ?
(iii) How far is the place of the merchant from the town ?
(iv) Did the person stop on his way ? Explain.
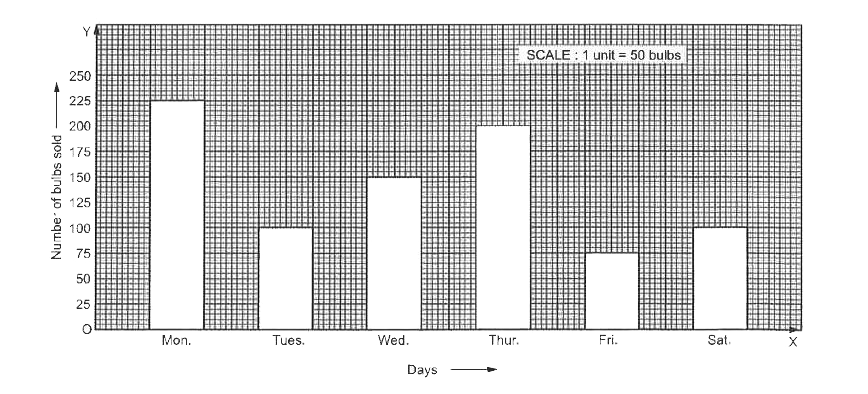
(v) During which period did he ride fastest ?View SolutionGiven below is a graph showing the number of electric bulbs sold in a shop during a week
Read the bar graph carefully and answer the following questions
(i) On which day of the week was the sale minimum?
(ii) On which day of the week was the sale maximum
(iiI) What was the total sale during the week
(lv) What is the ratio between the minimum sale and the maximum sale
 View Solution
It was a bright, sunny day in the morning when the classes started in the school. Suddenly dark clouds appeared in the sky. Due to this the classroom became quite dark. The teacher asked a student to switch on all the lights in the classroom.
(a) Why did the teacher ask for all the lights to be switched on ?
(b) What was the size of the pupil of the eyes of the students :
(i) before the clouds appeared ?
(ii) when classroom became quite dark ?
(iii) when the lights were switched on ?
(c) In which of the above mentioned three situations, the students will feel glare in their eyes and why ?
(d) What values are exhibited by the teacher in this case ?View SolutionA car is travelling from city P to city Q which are 350 km apart. The line graph given below describes the distances of the car from the city P at different times .
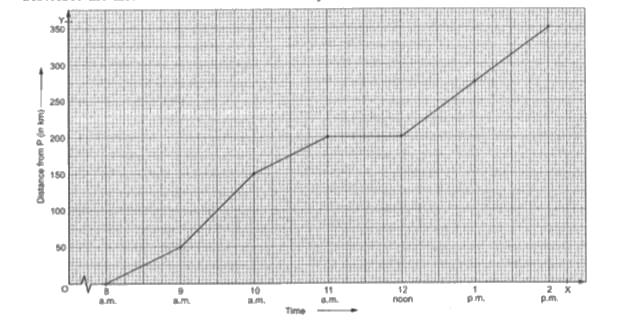
Study the above graph and answer the questions given below.
(i) What information is given on the two axes ?
(ii) From where and when did the car begin its journey ?
(iii) How far did the car go in the first hour ?
(iv) How far did the car go during (a) the 2nd hour and (b) the 3rd hour?
(v) Was the speed same during first three hours? How do you know it ?
(vi) Did the car stop for some duration at any place ? Justify your answer.
(vii) When did the car reach city Q ?View SolutionExplain the events in a normal woman during her menstrual cycle on the following days :
(a) Pituitary hormone levels from 8 to 12 days.
(b) Uterine events from 13 to 15 days.
(c) Ovarian events from 16 to 23 days.View SolutionNatural radioactivity is a spontaneous and self disruptive activity exhibated by a number of heavy elements in nature. Thus a heavy element disintegrates by itself without being forced by any external agent to do so. According to radioactive decay law, the number of atoms disintegrated per second (i.e., rate of disintegration of radioactive atoms) at any instant is directly propotional to the number of radioactive atoms actually in the sample at that instant, i.e., −dNdt∝NorR=−dNdt=λN, where λ is decay constant. Read the above passage and answer the following questions:
(i) The count rate form a radioactive sample containing 1016 atoms is 4×10⁶ per second. What is the value of decay constant?
(ii) Name the three types of radiactive radiations. Which one of them is most penetrating?
(iii) What does radioactive decay law imply in day to day life?View Solution

