Given below is a graph showing the number of electric bulbs sold in a shop during a week
Read the bar graph carefully and answer the following questions
(i) On which day of the week was the sale minimum?
(ii) On which day of the week was the sale maximum
(iiI) What was the total sale during the week
(lv) What is the ratio between the minimum sale and the maximum sale
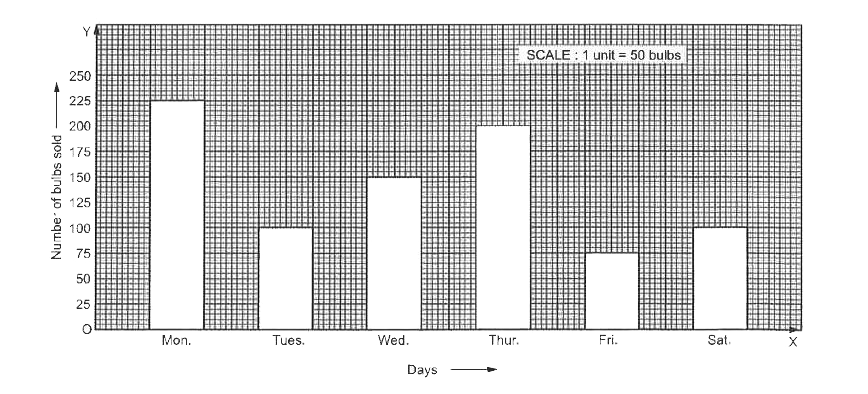
The correct Answer is:(iii) 850bulbs
(iv) 1:3
Step by step video, text & image solution for Given below is a graph showing the number of electric bulbs sold in a shop during a weekRead the bar graph carefully and answer the following questions(i) On which day of the week was the sale minimum? (ii) On which day of the week was the sale maximum (iiI) What was the total sale during the week (lv) What is the ratio between the minimum sale and the maximum sale by Maths experts to help you in doubts & scoring excellent marks in Class 7 exams.
Updated on:21/07/2023Topper's Solved these Questions
- BAR GRAPHSBOOK - RS AGGARWALCHAPTER - BAR GRAPHSEXERCISE - EXERCISE 22
22 Videos
- ALGEBRAIC EXPRESSION BOOK - RS AGGARWALCHAPTER - ALGEBRAIC EXPRESSION EXERCISE - EXERCISE 6D
31 Videos
- COLLECTION AND ORGANISATION OF DATA (MEAN, MEDIAN AND MODE)BOOK - RS AGGARWALCHAPTER - COLLECTION AND ORGANISATION OF DATA (MEAN, MEDIAN AND MODE)EXERCISE - EXERCISE 21C
5 Videos
Similar Questions
Knowledge Check
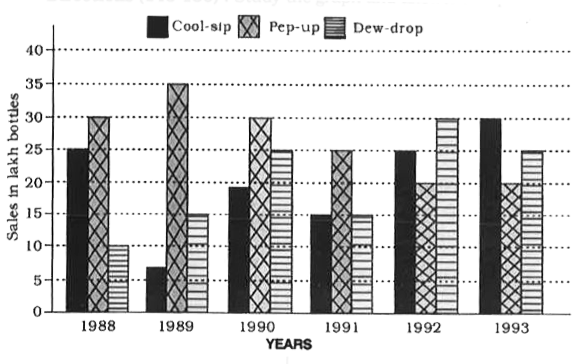
Study the graph and answer the questions.
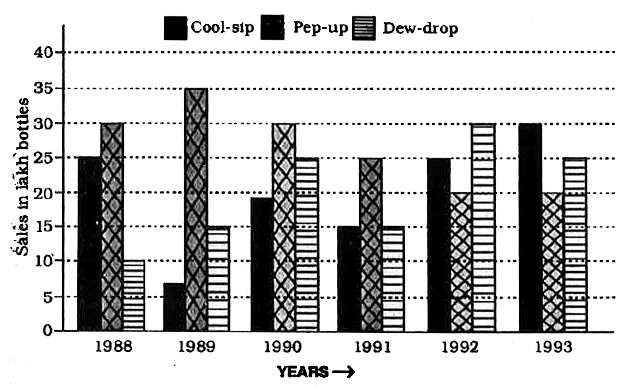
In which year the sale of cool-sip is minimum ?A1990B1992C1993DNone of the aboveStudy the graph and answer the questions.
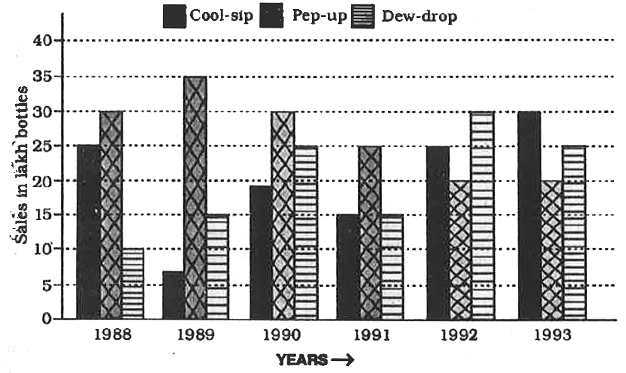
In which year sale of Drew-drop is maximum ?A1998B1992C1989D1993
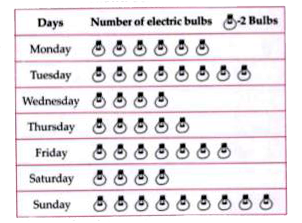
The sale of electric bulbs on different days of week is shown below :
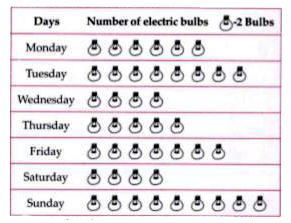
Observe the pictograph and answer the following questions :
On which of the days minimum number of bulbs were sold ?
View SolutionThe sale of electric bulbs on different days of week is shown below :
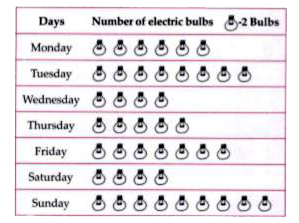
Observe the pictograph and answer the following questions :
On which of the days same number of bulbs were sold ?
View SolutionThe sale of electric bulbs on different days of week is shown below :
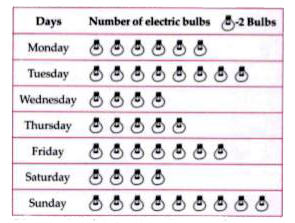
Observe the pictograph and answer the following questions :
How many bubls were sold on Friday ?
View SolutionStudy the graph and answer the questions.
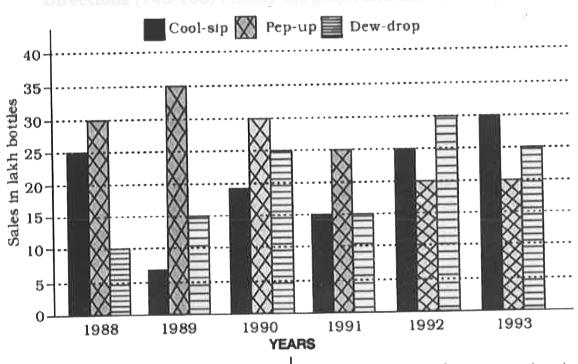
In which year sale of Dew -drop is maximum ?
View SolutionObserve the given data:

(a) Draw a bar graph to represent the above given information.
(b) On which day of the week was the sales maximum?
(c) Find the total sales during the week.
(d) Find the ratio of the minimum sale to the maximum sale.
(e) Calculate the average sale during the week.
(f) On how many days of the week was the sale above the average sales?
View SolutionObserve this bar graph which is showing the sale of shirts in a ready made shop from Monday to Saturday.
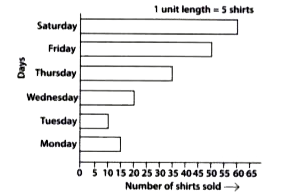
Now answer the following questions :
On which day were the minimum number of shirts sold ?
View Solution

