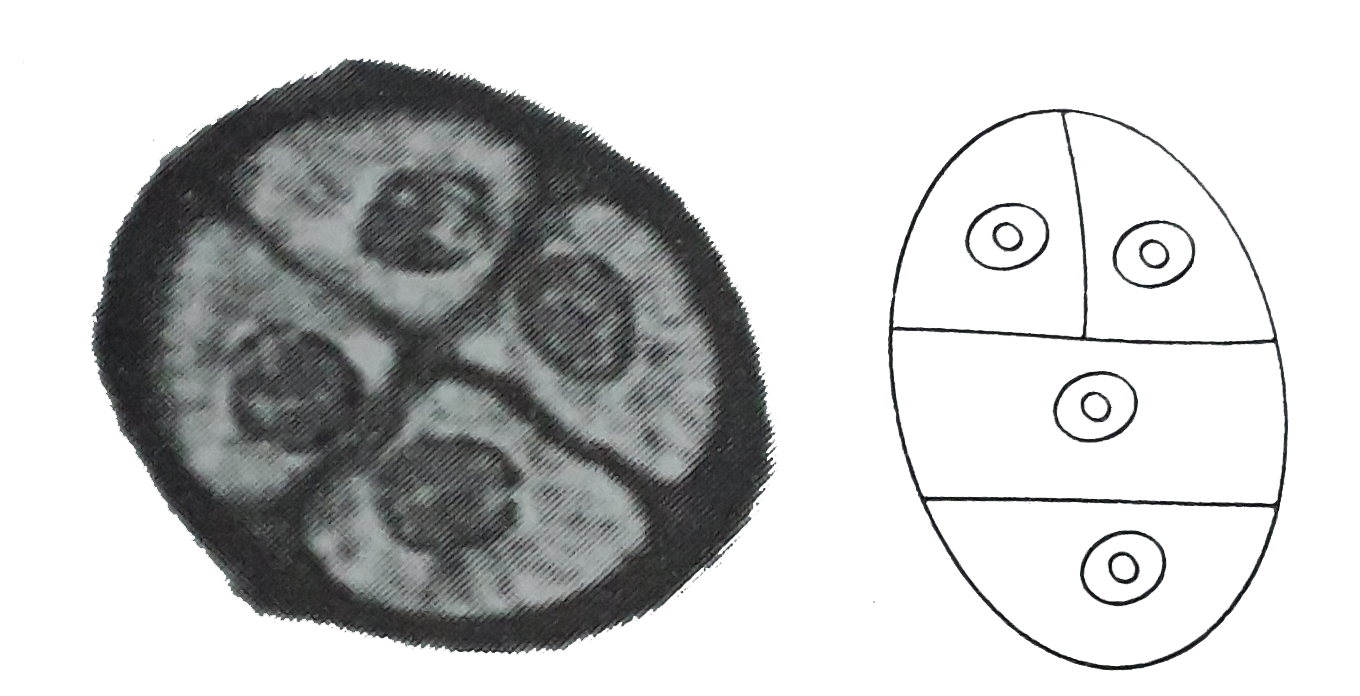
The following figure show
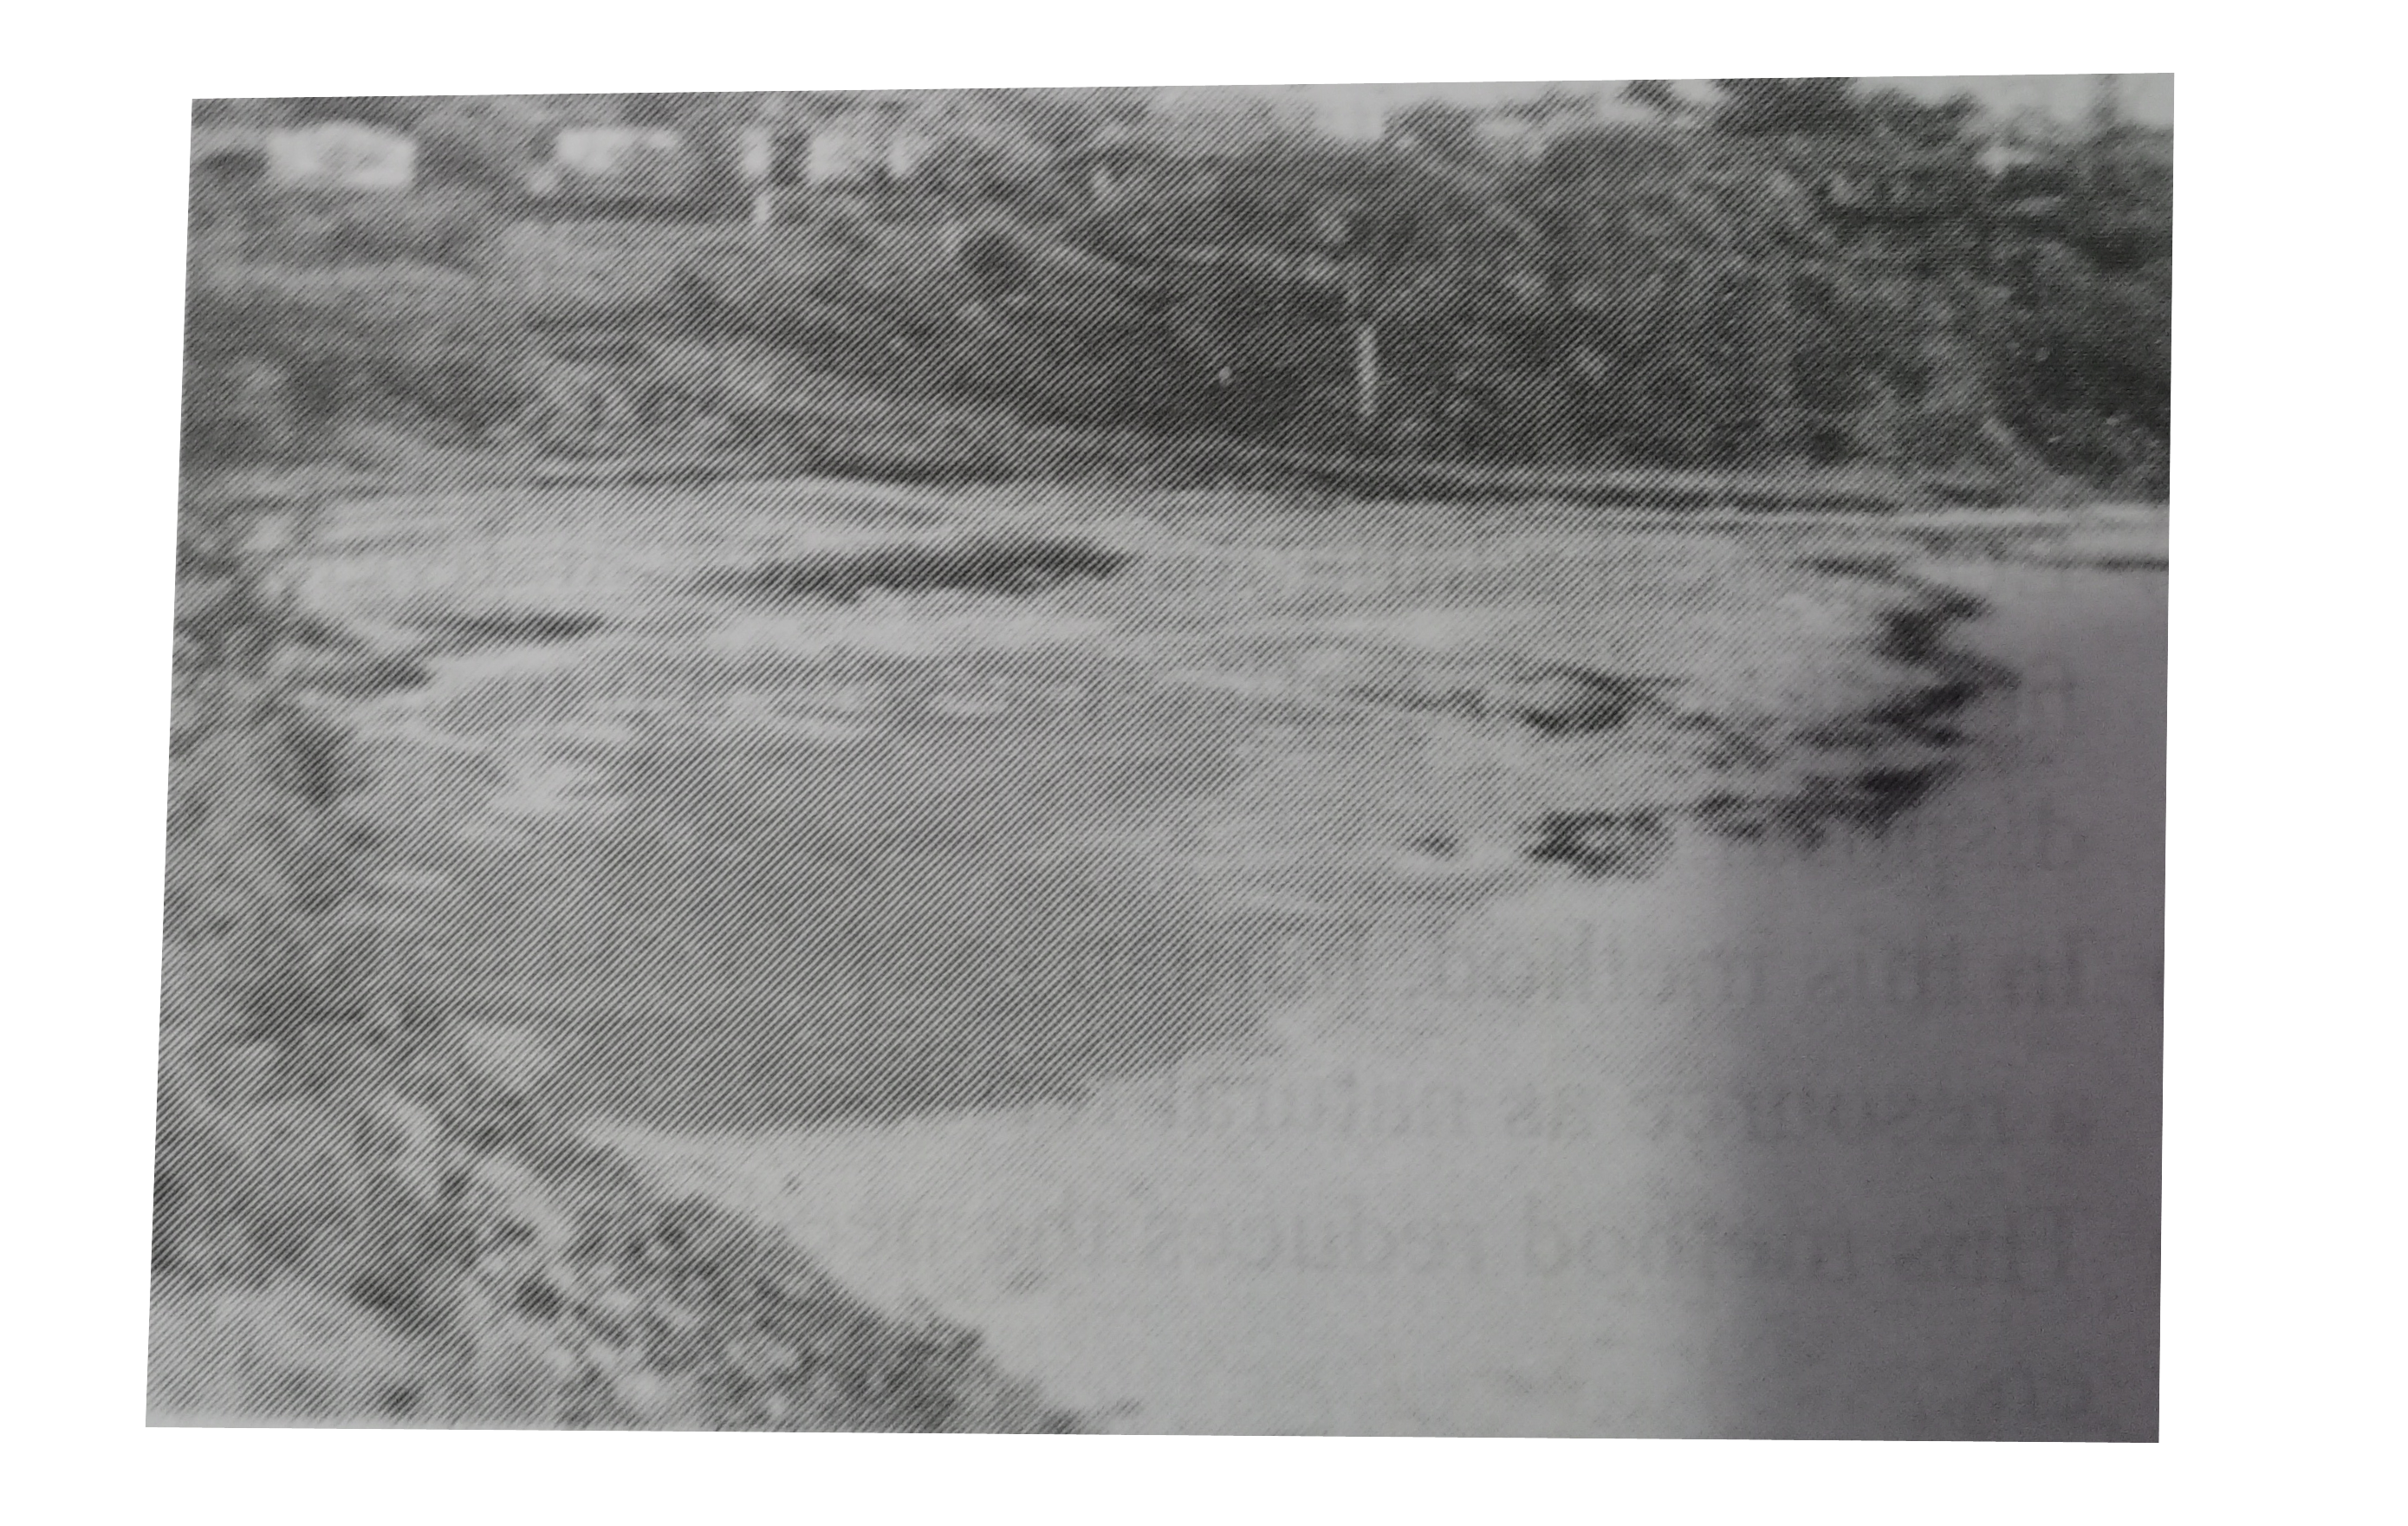
Algal bloom
Biomagnification
Nitrification
BOD
The correct Answer is:A
Step by step video & image solution for The following figure show by Biology experts to help you in doubts & scoring excellent marks in Class 12 exams.
Updated on:21/07/2023Topper's Solved these Questions
- ENVIRONMENTAL ISSUESBOOK - A2ZCHAPTER - ENVIRONMENTAL ISSUESEXERCISE - Section A: Topicwise Questions (topic 3: Solid, Wastes, Agro-chemicals And Their Effects, Radioactiv
23 Videos
- ENVIRONMENTAL ISSUESBOOK - A2ZCHAPTER - ENVIRONMENTAL ISSUESEXERCISE - Section A: Topicwise Questions (topic 4:green House Effect And Global Warming )
26 Videos
- ENVIRONMENTAL ISSUESBOOK - A2ZCHAPTER - ENVIRONMENTAL ISSUESEXERCISE - Section A: Topicwise Questions (topic 1: Air Pollution And Its Control) Controlling Vehicular Air Po
54 Videos
- ECOSYSTEMBOOK - A2ZCHAPTER - ECOSYSTEMEXERCISE - Section-d Chapter-end Test
50 Videos
- EVOLUTIONBOOK - A2ZCHAPTER - EVOLUTIONEXERCISE - Section D : Chapter-end Test
50 Videos
Similar Questions
Knowledge Check
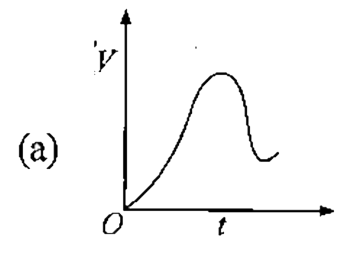
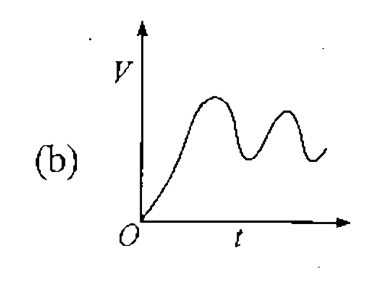
The following figures show some velocity versus time curves. But only some of these can be realised in practice. These are:
 ,
,  ,
, 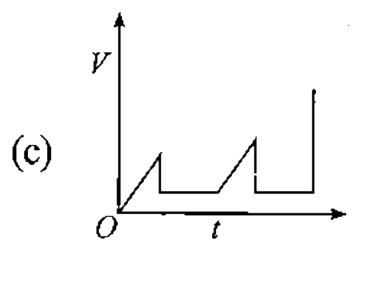 ,
, 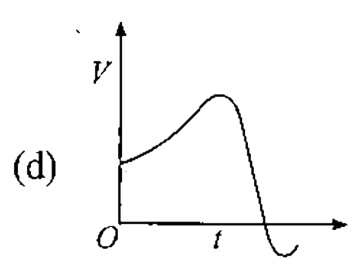 AOnly a, b and dBOnly a, b, cCOnly b and cDAll of them
Which of the following figures shows tubectomy ?
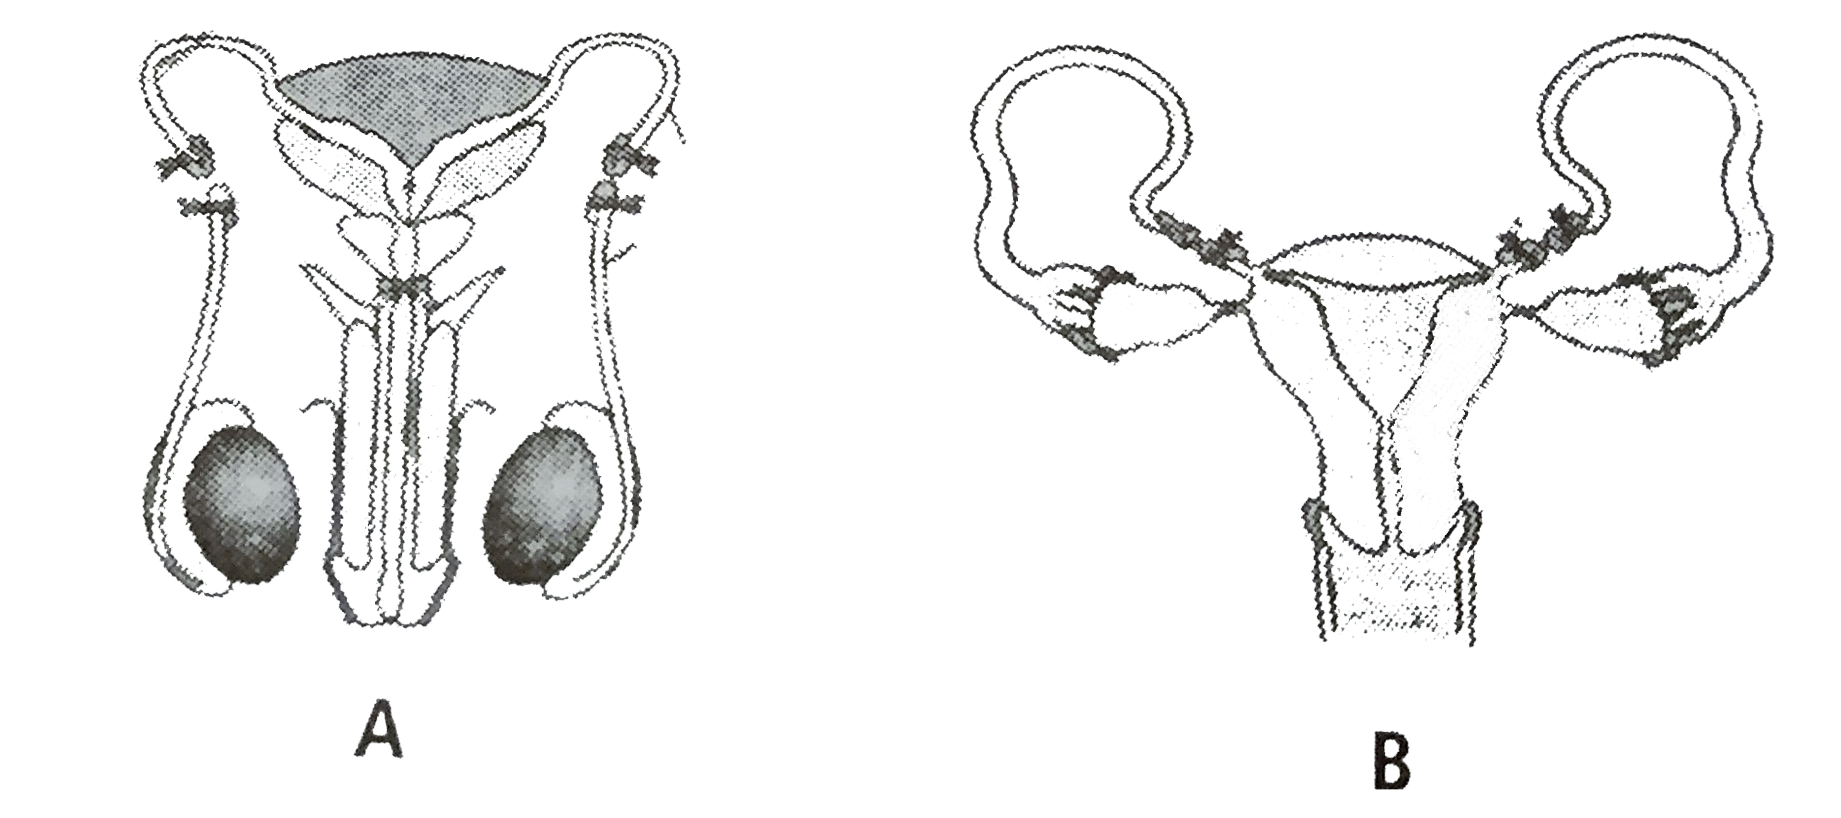 AA onlyBB onlyCEither A or BDNone of these
Which of the following figures show(s) the bonding in diborane ?
A B
B CBoth (1) and (2)DNone of the above
Each of the following figures shows paper cuttings with punched holes. Copy these figures on a plane sheet and mark the axis of symmetry so that paper is folded along it, then the wholes on one side of it coincide with the holes on the other side.
View SolutionWhich of the following figures shows the stages of development of the bean plant in correct order ?
View SolutionWhich of the following figures shows a correct representations of deviation and dispersion of light by a prism?
View SolutionWhich of the following figures shows correct relative contribution of greenhouse gases to global warming?
View SolutionThe variation of displacement with respect to time is depicted in the following figure. The figure shows that
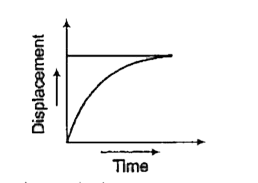
View Solution

