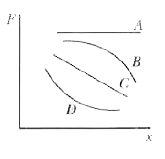
Which of the following graph in the following figure correctly represents the force between plates of an isolated charged parallel plate capacitor with distance x between them.

A
B
C
D
The correct Answer is:A
Step by step video, text & image solution for Which of the following graph in the following figure correctly represents the force between plates of an isolated charged parallel plate capacitor with distance x between them. by Physics experts to help you in doubts & scoring excellent marks in Class 12 exams.
Topper's Solved these Questions
- BOOK - RESNICK AND HALLIDAYCHAPTER - CAPACITANCEEXERCISE - PRACTICE QUESTIONS (MORE THAN ONE CORRECT CHOICE TYPE)12videos
CAPACITANCE
- BOOK - RESNICK AND HALLIDAYCHAPTER - CAPACITANCEEXERCISE - PRACTICE QUESTIONS (LINKED COMPREHENSION)8videos
CAPACITANCE
- BOOK - RESNICK AND HALLIDAYCHAPTER - CAPACITANCEEXERCISE - PROBLEMS48videos
CAPACITANCE
- BOOK - RESNICK AND HALLIDAYCHAPTER - ALL ABOUT ATOMS EXERCISE - CHECKPOINT1videos
ALL ABOUT ATOMS
- BOOK - RESNICK AND HALLIDAYCHAPTER - CENTER OF MASS EXERCISE - Practice Questions (Integer )4videos
CENTER OF MASS
Similar Questions
Knowledge Check
- Question 1 - Select One
Force of attraction between the plates of a parallel plate capacitor is
Aq22ε0AKBq2ε0AKCq2ε0ADq22ε0A2K - Question 2 - Select One
The separation between the plates of a charged parallel-plate capacitor is increased. The force between the plates
AincreasesBdecreasesCremains sameDfirst increases then decreases - Question 3 - Select One
As the distance between the plates of a parallel plate capacitor decreased
Achances of electrical break down will increases if potential difference between the plates is kept constant.Bchance of electrical break down will decreases if potential difference between the plates is kept constant.Cchance of electric break down will increases if charge on the plates is kept constantDchance of electrical break down will decrease if charge on the plate is kept constant.
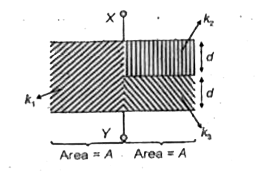
Calculate the capacitance of the parallel plate capacitor shown in the following figure between point X and Y.
 View Solution
The electrostatic force between the metal plate of an isolated parallel plate capacitro C having charge Q and area A, is
View SolutionThe electrostatic force between the metal plate of an isolated parallel plate capacitro C having charge Q and area A, is
View SolutionWhen a dielectric is introduced between the plates of a charged parallel plate capacitor, whichi one of the following will not change?
View SolutionWhen a dielectric is inserted in the space between parallel plates of a charged capacitor, then
View Solution
