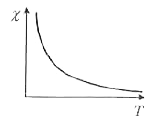
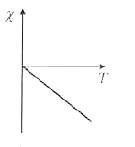
Which among the four χ versus T graphs shown in the following figure is the correct one for a paramagnetic substsnace will look like ?
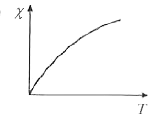
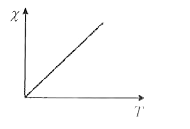
The correct Answer is:C
To determine the correct graph of magnetic susceptibility (χ) versus temperature (T) for a paramagnetic substance, we need to understand the behavior of paramagnetic materials with respect to temperature.
1. Understand Paramagnetism:
- Paramagnetic substances have unpaired electrons, which give rise to a net magnetic moment. This means that they are attracted to magnetic fields.
2. Behavior with Temperature:
- The magnetic susceptibility (χ) of paramagnetic materials is inversely proportional to temperature (T). As temperature increases, the thermal agitation causes the alignment of magnetic moments to decrease, leading to a decrease in susceptibility.
3. Mathematical Representation:
- The relationship can be expressed as:
χ=CT
where C is the Curie constant. This indicates that as T increases, χ decreases.
4. Graph Characteristics:
- The graph of χ versus T for a paramagnetic substance will show a hyperbolic decline. It will start from a positive value at low temperatures and approach zero as the temperature increases.
5. Identifying the Correct Graph:
- Look for a graph that starts at a certain positive value on the y-axis (χ) when T is low and slopes downwards towards the x-axis (T) as T increases. This behavior is characteristic of paramagnetic substances.
Conclusion:
The correct graph for the magnetic susceptibility (χ) versus temperature (T) of a paramagnetic substance will show a hyperbolic decline, starting from a positive value and approaching zero as temperature increases.
- Paramagnetic substances have unpaired electrons, which give rise to a net magnetic moment. This means that they are attracted to magnetic fields.
- The magnetic susceptibility (χ) of paramagnetic materials is inversely proportional to temperature (T). As temperature increases, the thermal agitation causes the alignment of magnetic moments to decrease, leading to a decrease in susceptibility.
- The relationship can be expressed as:
χ=CT
where C is the Curie constant. This indicates that as T increases, χ decreases.
- The graph of χ versus T for a paramagnetic substance will show a hyperbolic decline. It will start from a positive value at low temperatures and approach zero as the temperature increases.
- Look for a graph that starts at a certain positive value on the y-axis (χ) when T is low and slopes downwards towards the x-axis (T) as T increases. This behavior is characteristic of paramagnetic substances.
The correct graph for the magnetic susceptibility (χ) versus temperature (T) of a paramagnetic substance will show a hyperbolic decline, starting from a positive value and approaching zero as temperature increases.
Topper's Solved these Questions
- MAGNETIC FORCEBOOK - RESNICK AND HALLIDAYCHAPTER - MAGNETIC FORCEEXERCISE - Practice Questions (More than one correct choice Type)
11 Videos
- MAGNETIC FORCEBOOK - RESNICK AND HALLIDAYCHAPTER - MAGNETIC FORCEEXERCISE - Practice Questions (Linked Comprehension)
2 Videos
- MAGNETIC FORCEBOOK - RESNICK AND HALLIDAYCHAPTER - MAGNETIC FORCEEXERCISE - Problems
49 Videos
- MAGNETIC FIELDS DUE TO CURRENTSBOOK - RESNICK AND HALLIDAYCHAPTER - MAGNETIC FIELDS DUE TO CURRENTSEXERCISE - Practice Question (Integer Type)
4 Videos
- MOTION ALONG A STRAIGHT LINEBOOK - RESNICK AND HALLIDAYCHAPTER - MOTION ALONG A STRAIGHT LINEEXERCISE - PRACTICE QUESTIONS ( Integer Type )
3 Videos
Similar Questions
Knowledge Check
Which among the four χ versus T graphs shown in the following figure is the correct one for a paramagnetic substsnace will look like ?
A B
B C
C D
D
The correct I - H graph for a paramagnetic material will look like .
A B
B C
C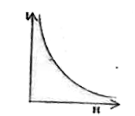 D
D
Among the following ions which one has the highest paramagnetism?
A(a) [Cr(H2O)6]3+B(b) [Cu(H2O)6]2+C(c) [Fe(H2O)6]2+D(d) [Zn(H2O)6]2+
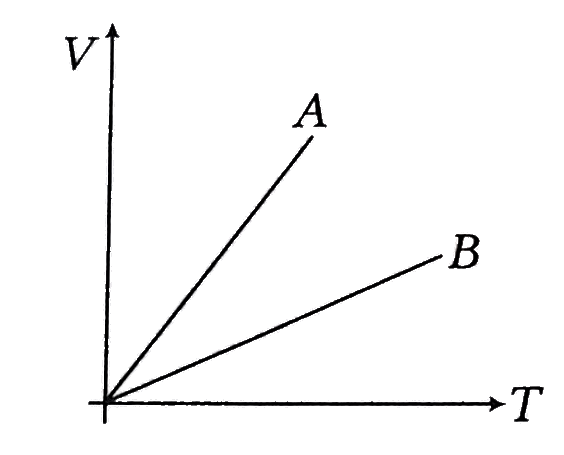
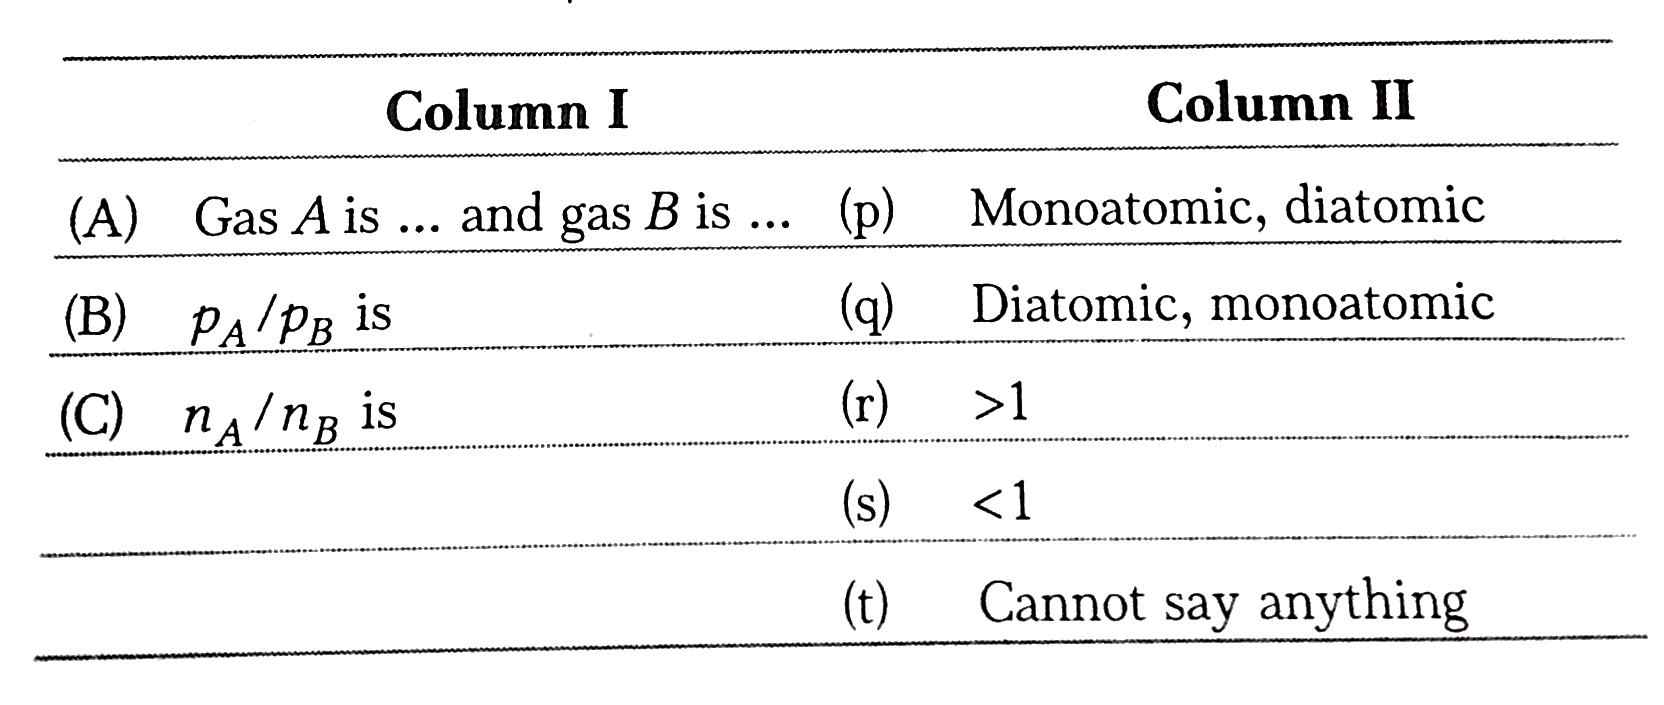
In the V-T graph shown in the figure match the following columns.
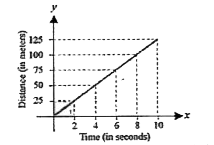
View SolutionThe distance versus time graph of a car is shown in the given figure.
View SolutionAmong the following ions, which one has the highest paramagnetism?
View SolutionAmong the following ions, which one has the highest paramagnetism ?
View SolutionAmong the following ions, which one has the highest paramagnetism ?
View Solution
