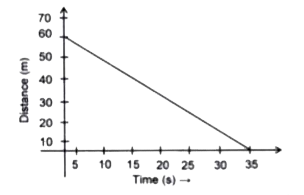
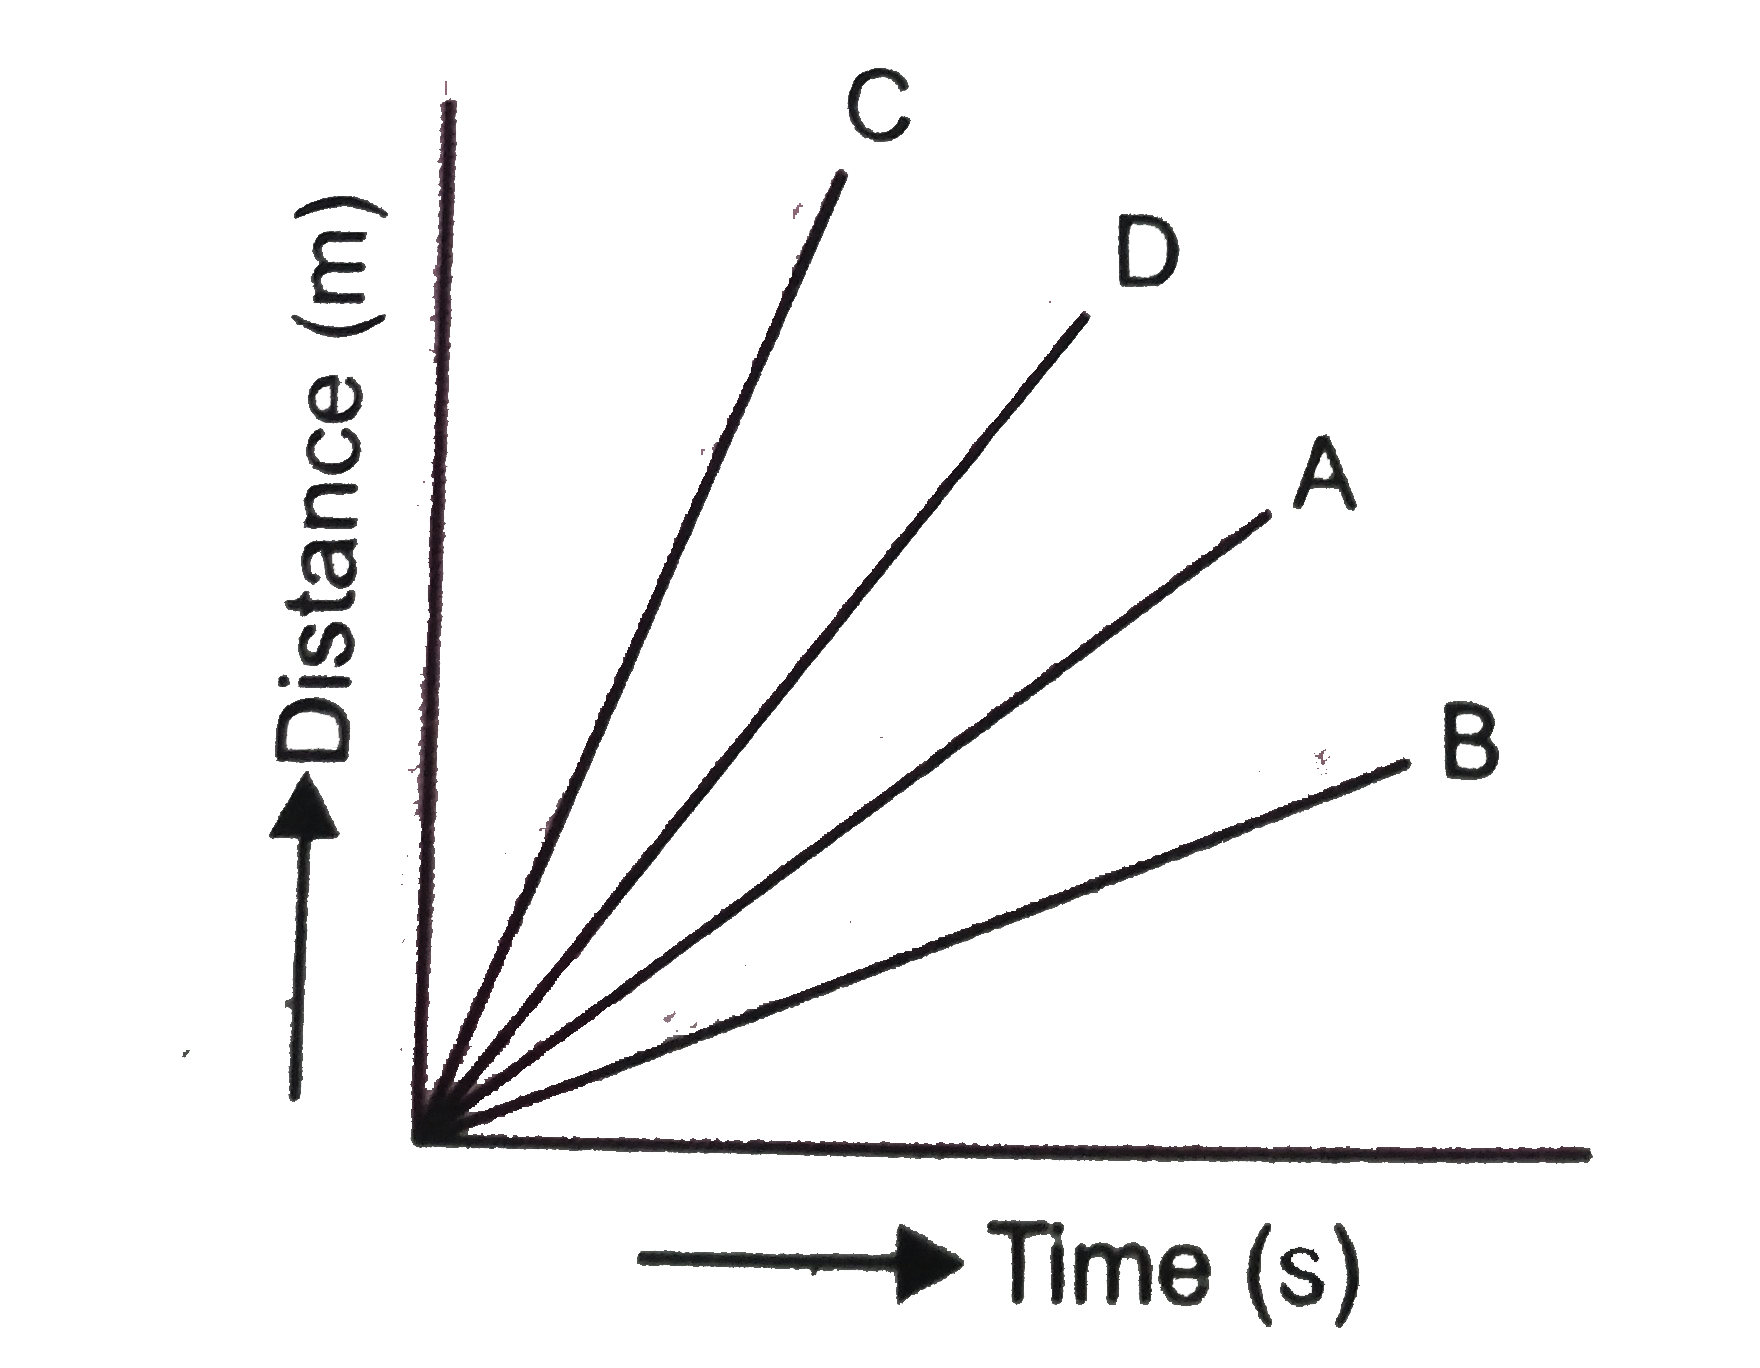
The distance versus time graph of a car is shown in the given figure.
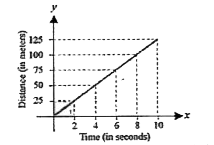
car is moving at a uniform speed
speed of the car is increasing uniformly
car travels a distance of 25 m in each second
distance traveled by the car is inversely proportion to time
Step by step video & image solution for The distance versus time graph of a car is shown in the given figure. by Physics experts to help you in doubts & scoring excellent marks in Class 7 exams.
Updated on:21/07/2023Topper's Solved these Questions
- MOTIONBOOK - BEIITIANSCHAPTER - MOTIONEXERCISE - CONCEPTIVE WORKSHEET
20 Videos
- MOTIONBOOK - BEIITIANSCHAPTER - MOTIONEXERCISE - SUMMATIVE WORKSHEET
2 Videos
- MEASUREMENTBOOK - BEIITIANSCHAPTER - MEASUREMENTEXERCISE - IIT JEE WORKSHEET (IV INTEGER TYPE)
1 Videos
- SOUNDBOOK - BEIITIANSCHAPTER - SOUNDEXERCISE - IIT JEE Worksheet (V. Matrix Matching)
5 Videos
Similar Questions
Knowledge Check
Distance versus time graph of an object is as shown in the figure. The average speed of the object is _____ ms−1
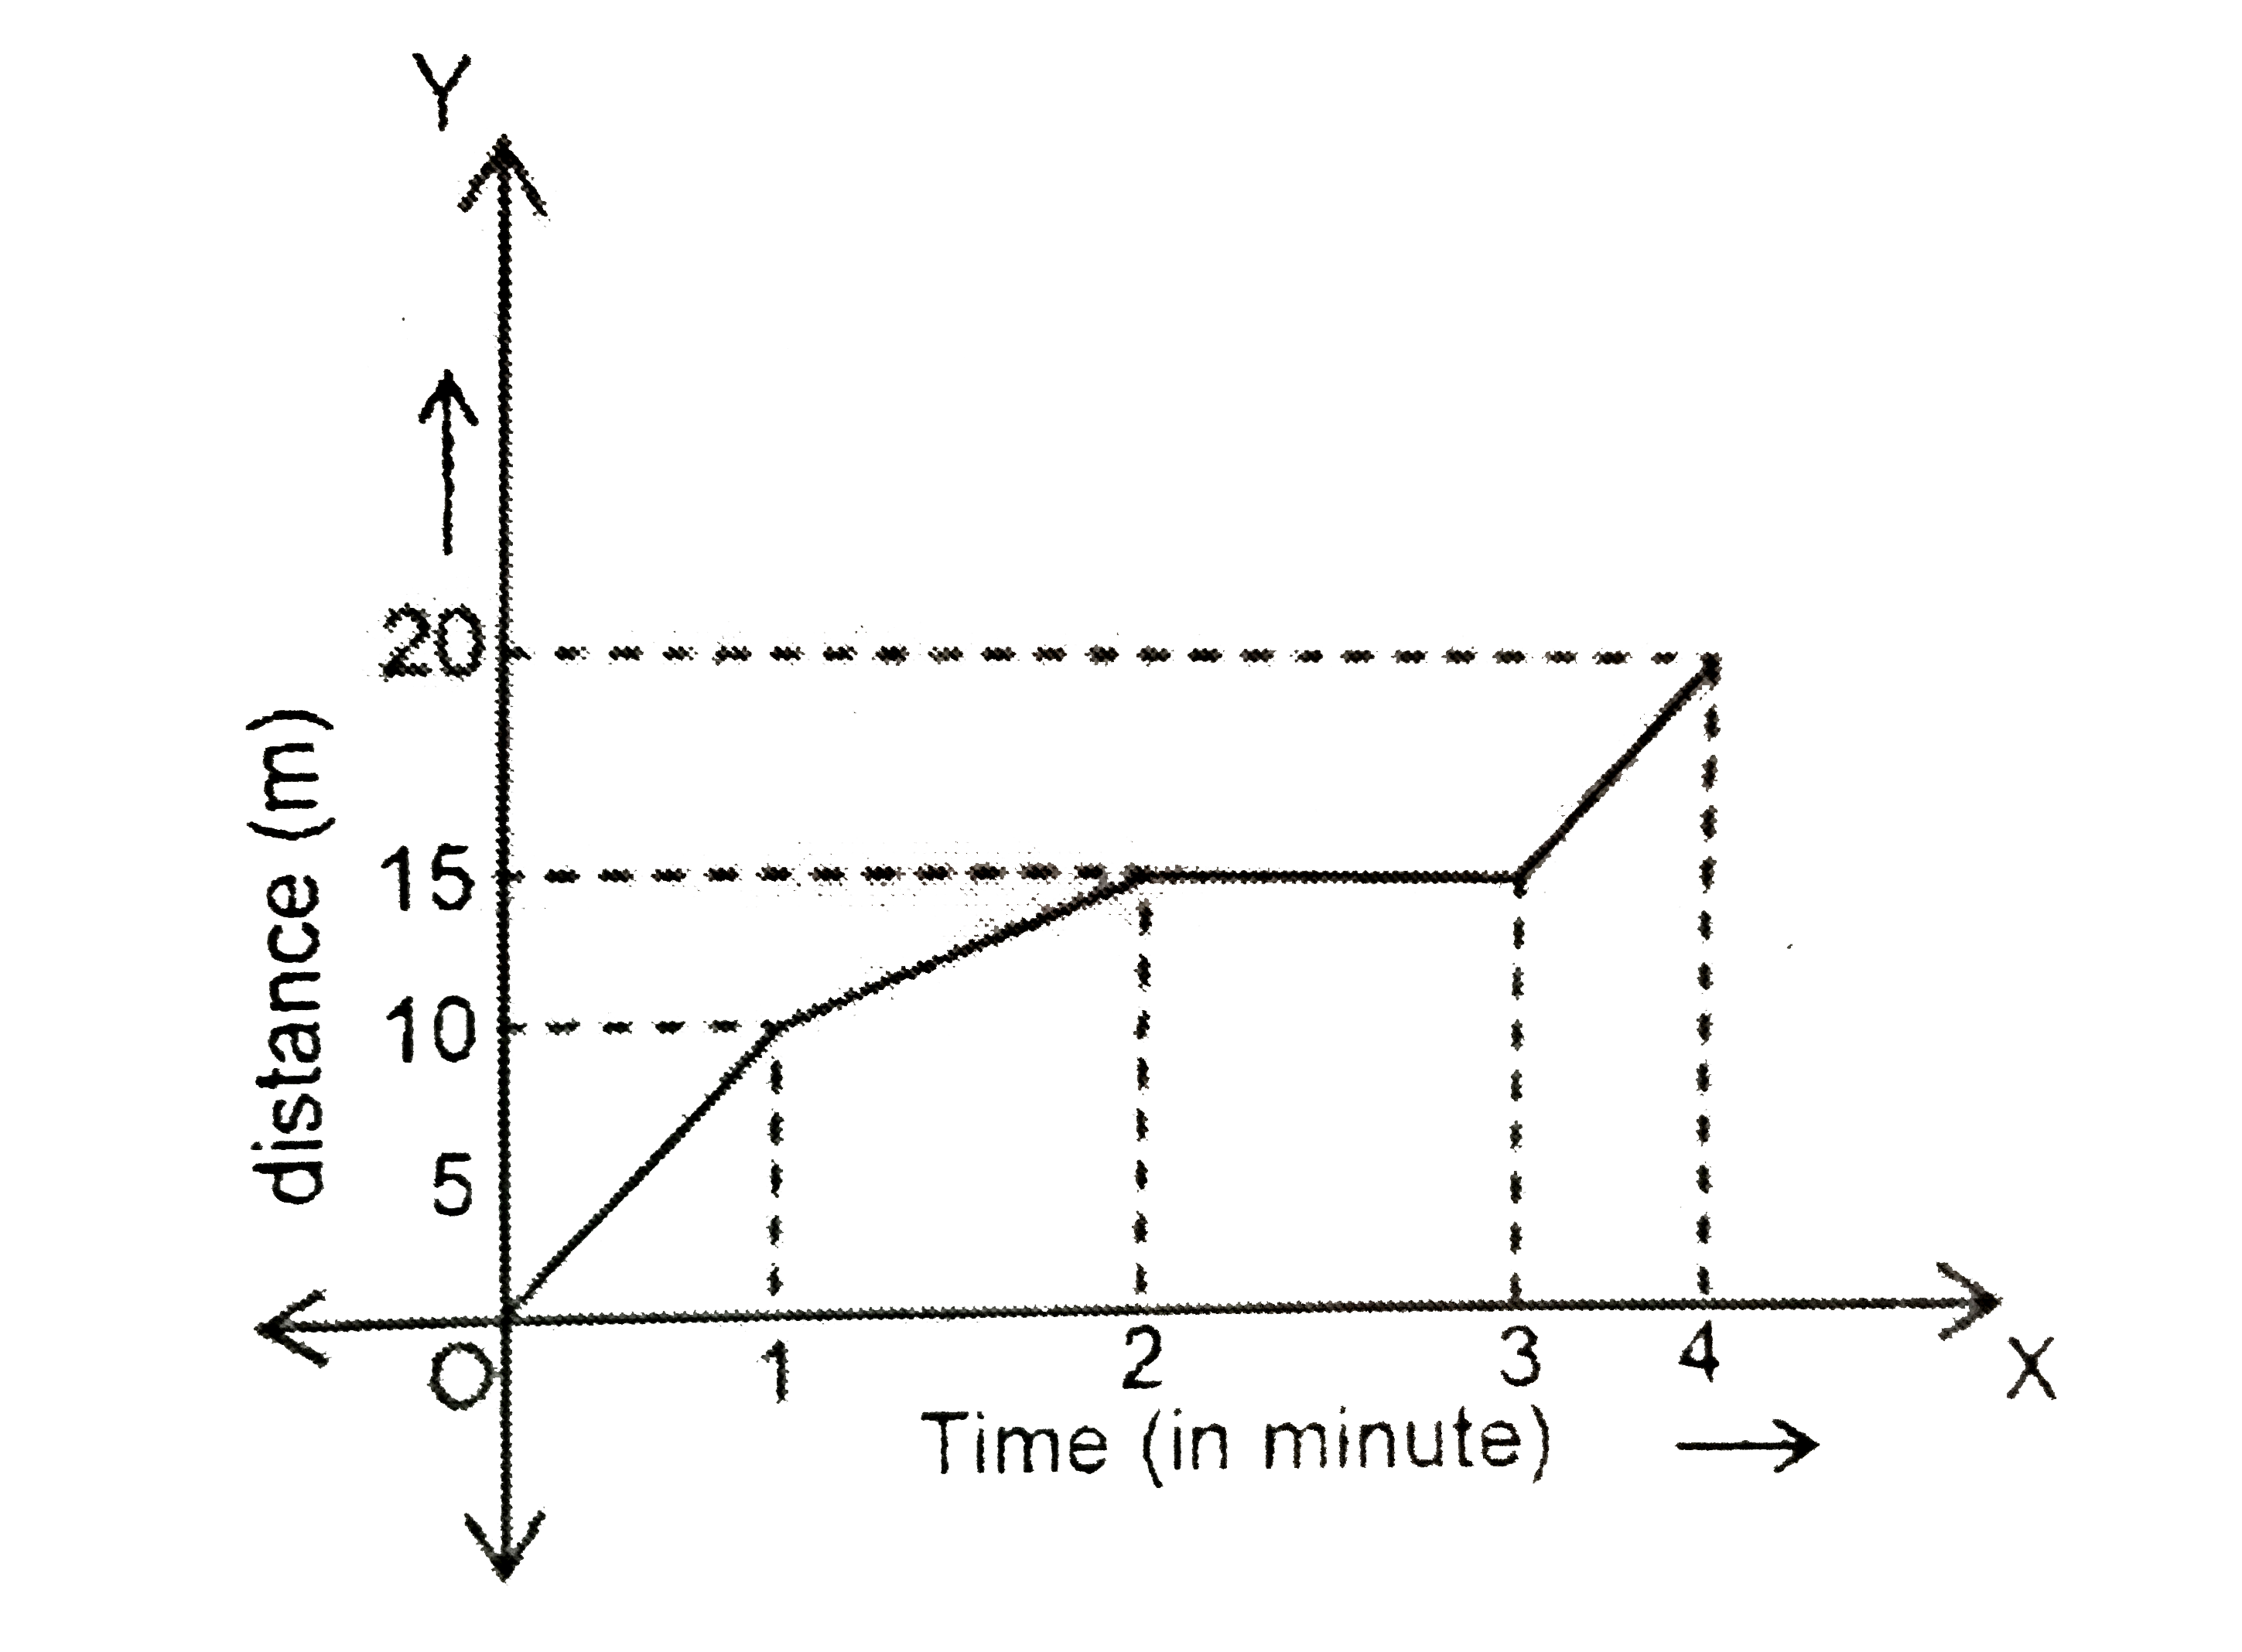 A0.08B0.5C1D2
Distance versus time graph of an object is as shown in the figure. The average speed of the object is _____ ms−1
 A0.08B0.5C1D2
The acceleration versus time graph of a particle is shown in the figure. The respective v−t graph of the particle is .
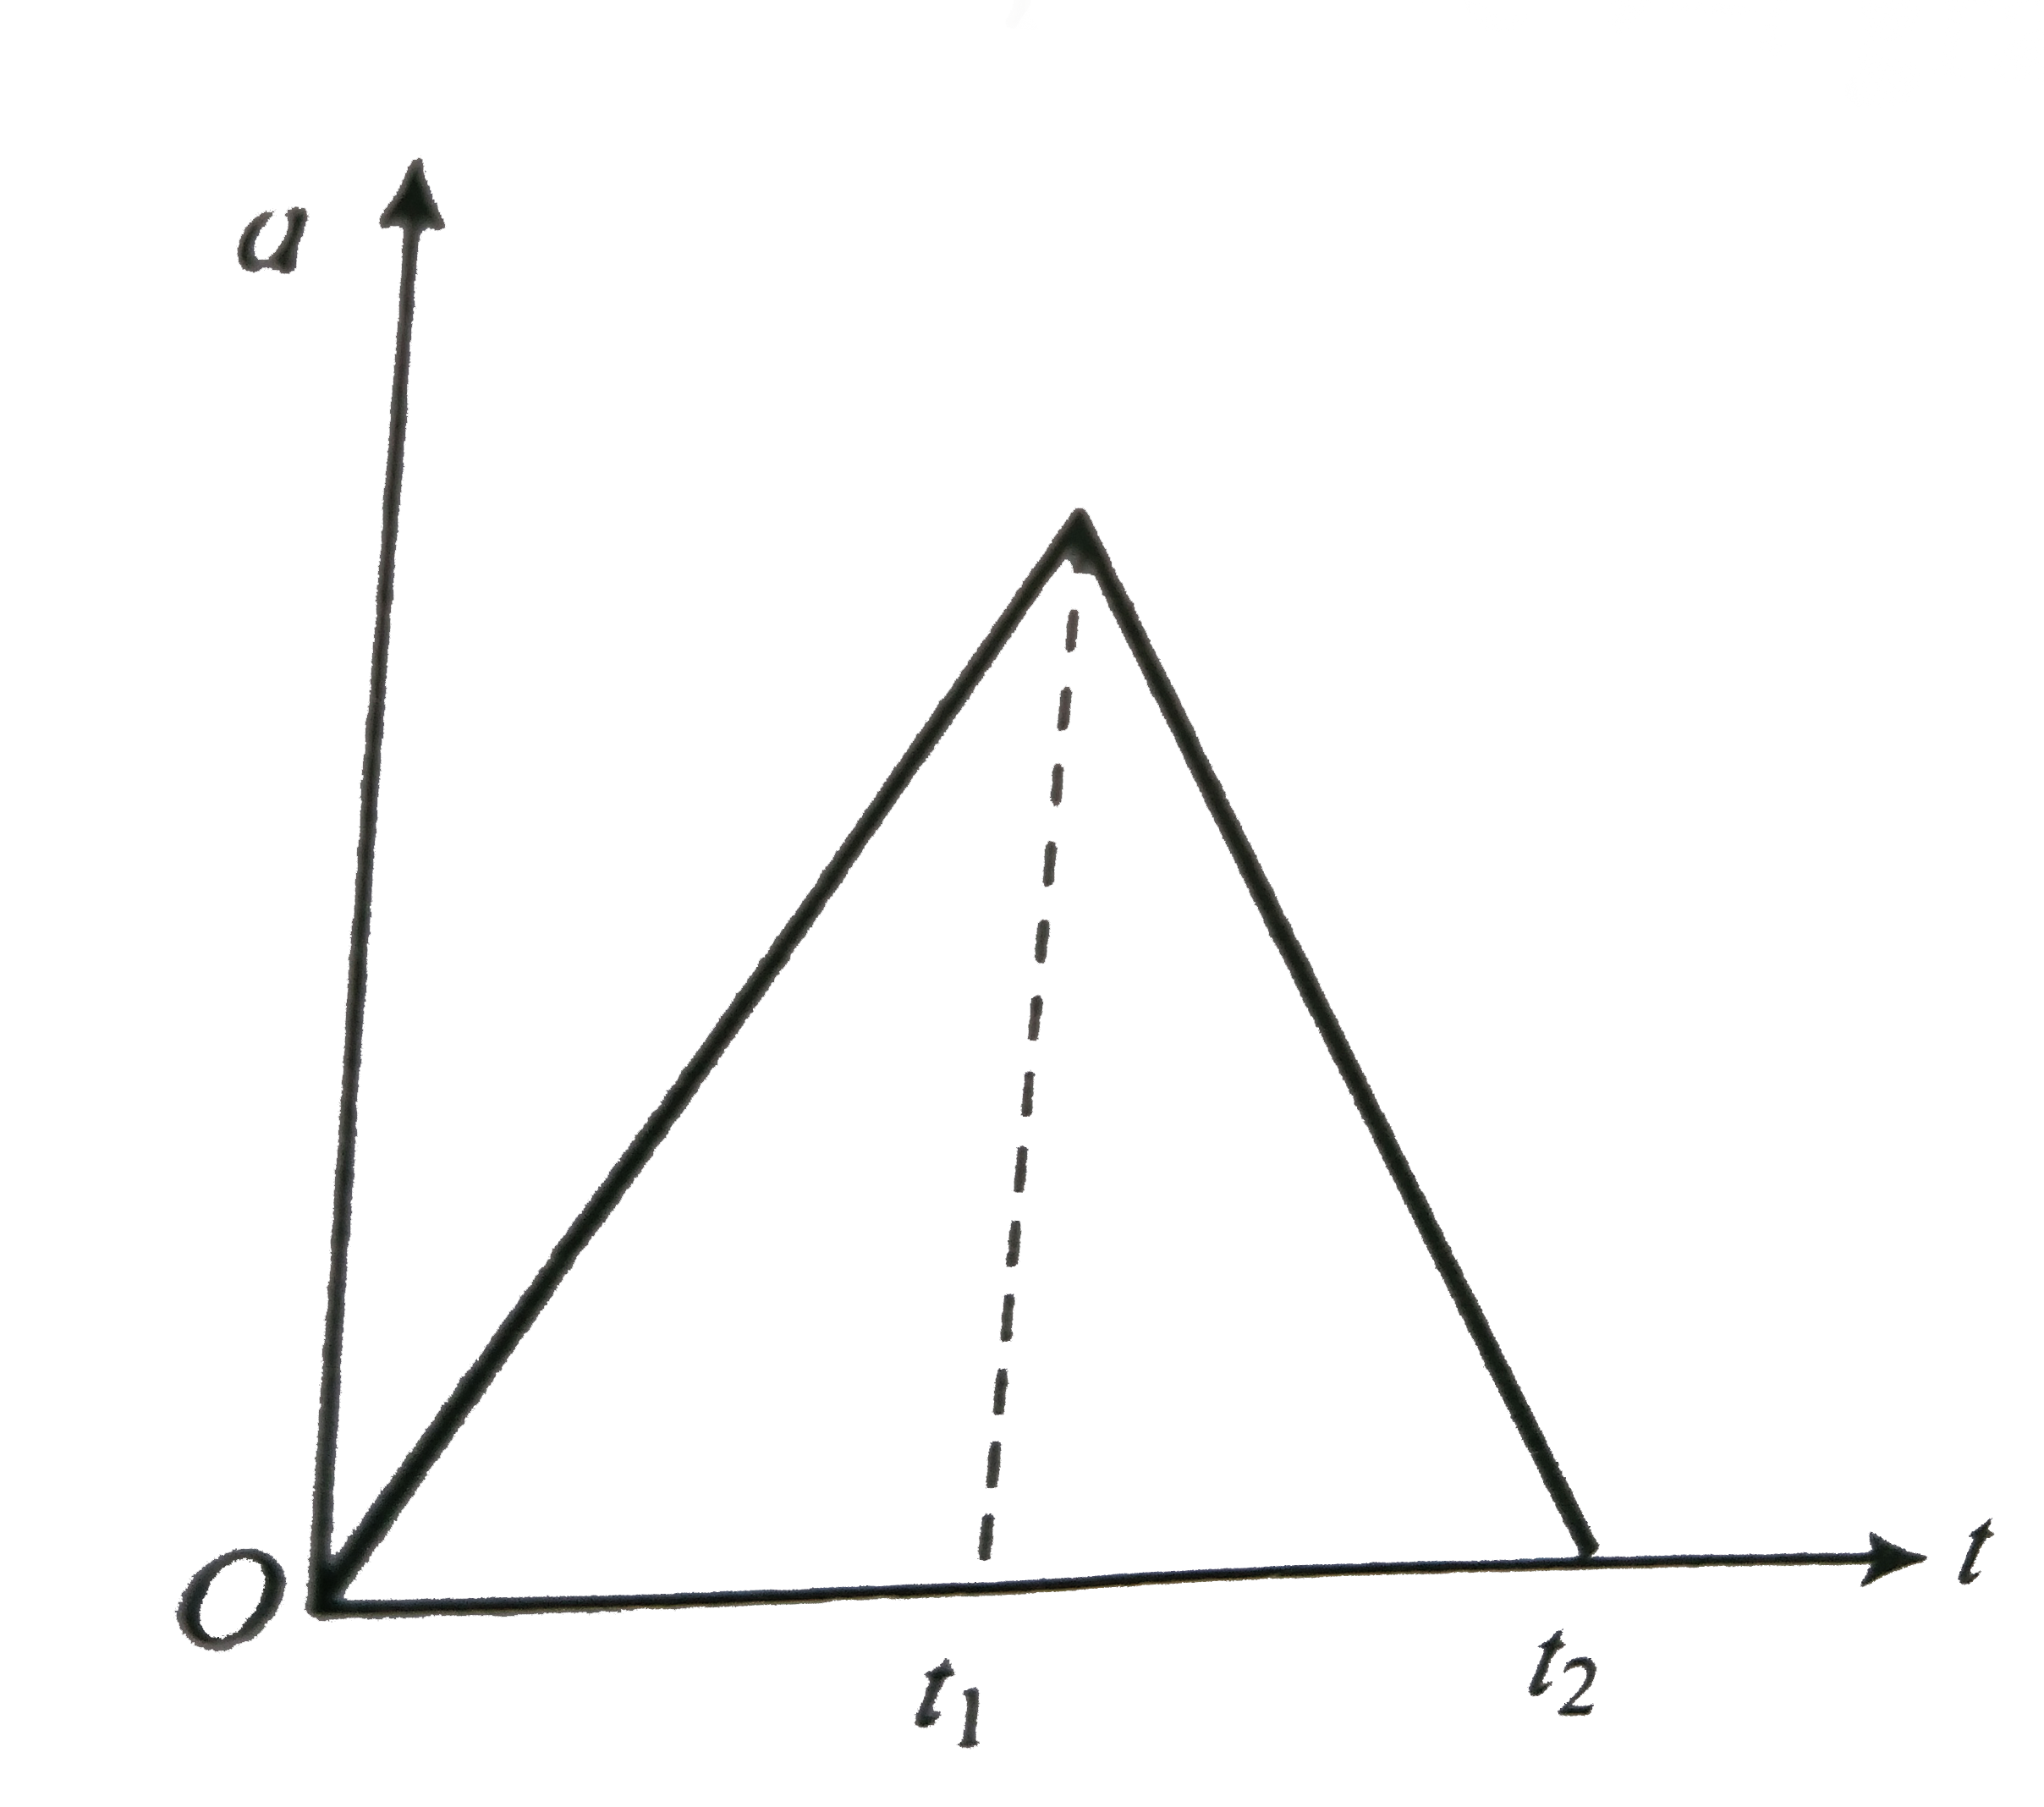 .A
.A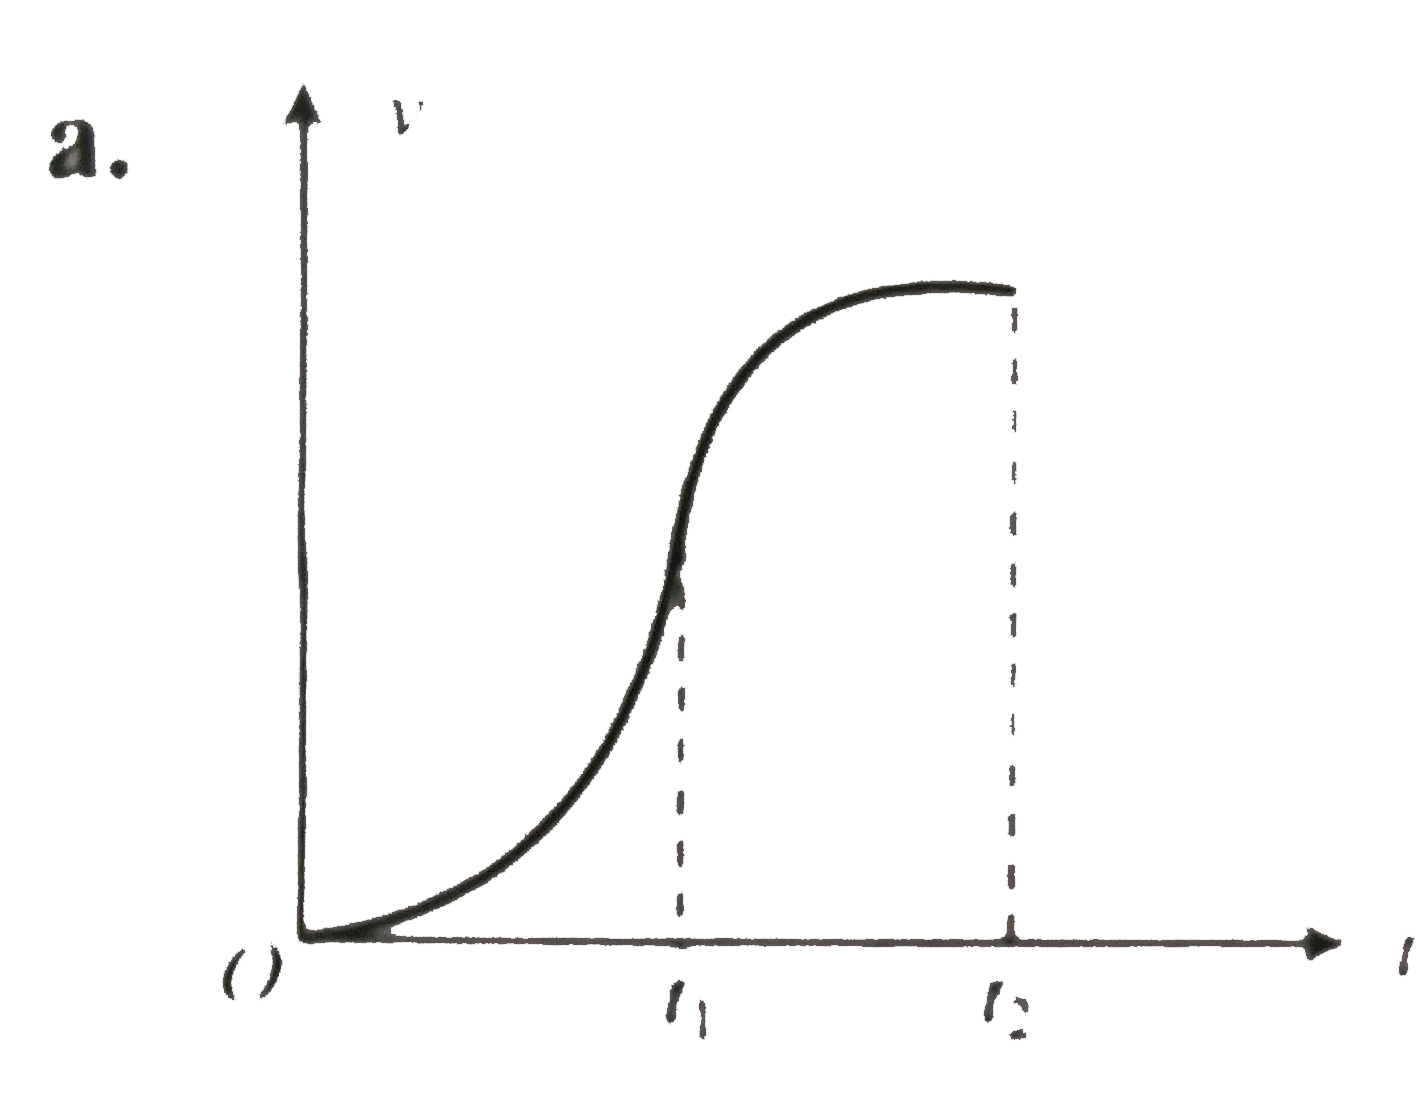 .B
.B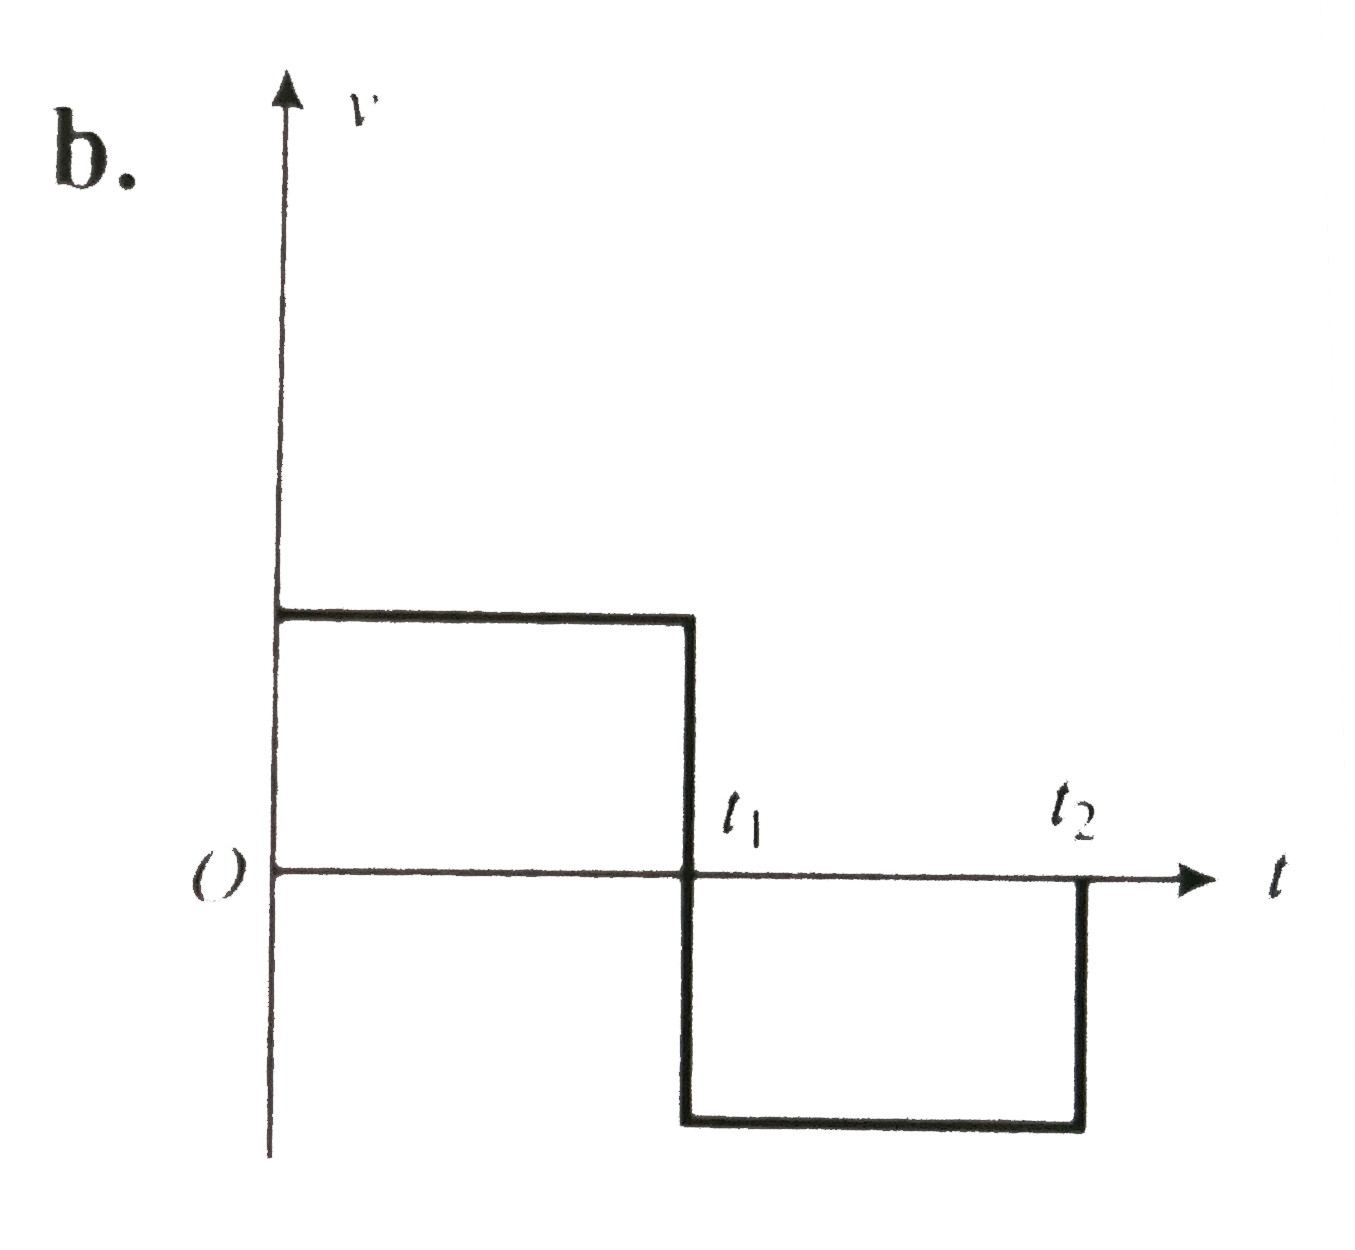 .C
.C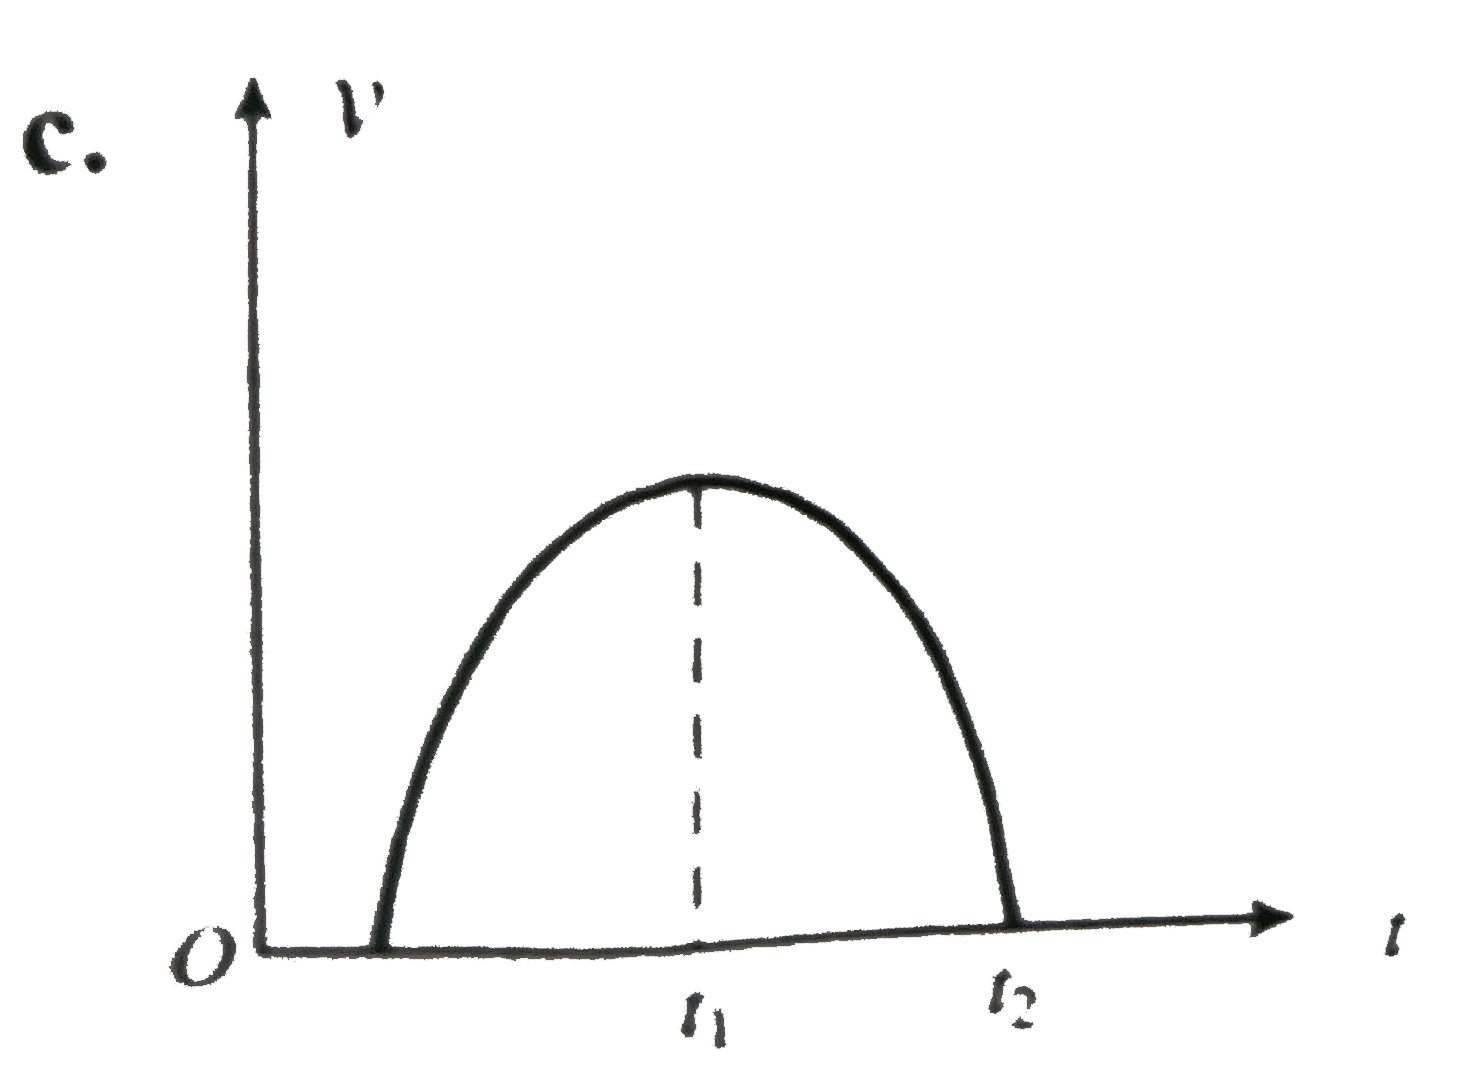 .D
.D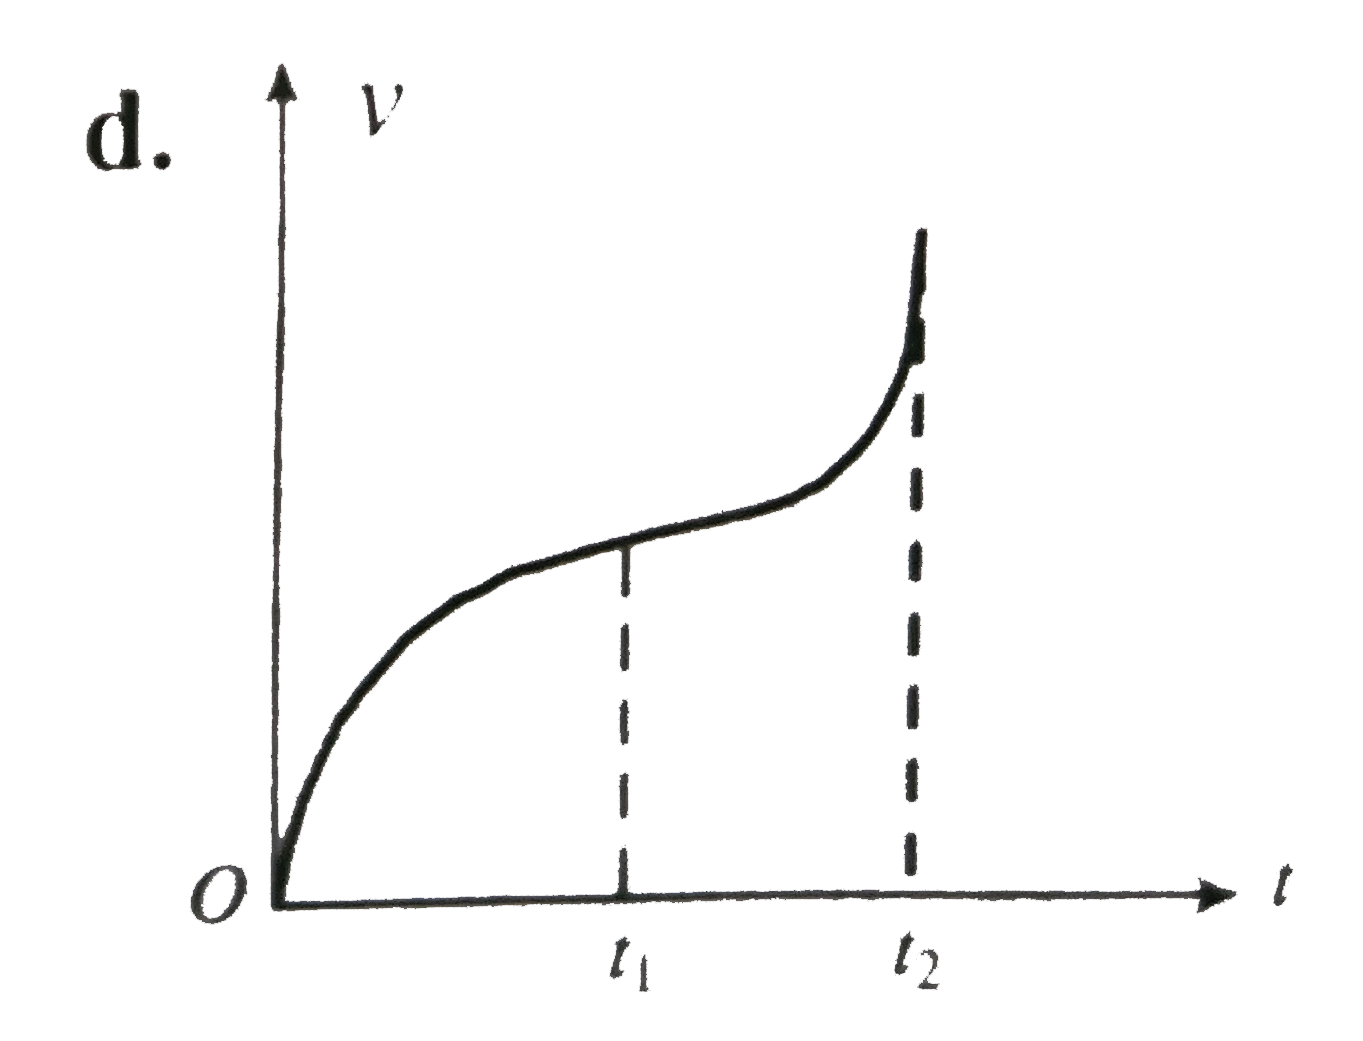 .
.
The distance-time graph of a moving vehicle is as shown in the figure.
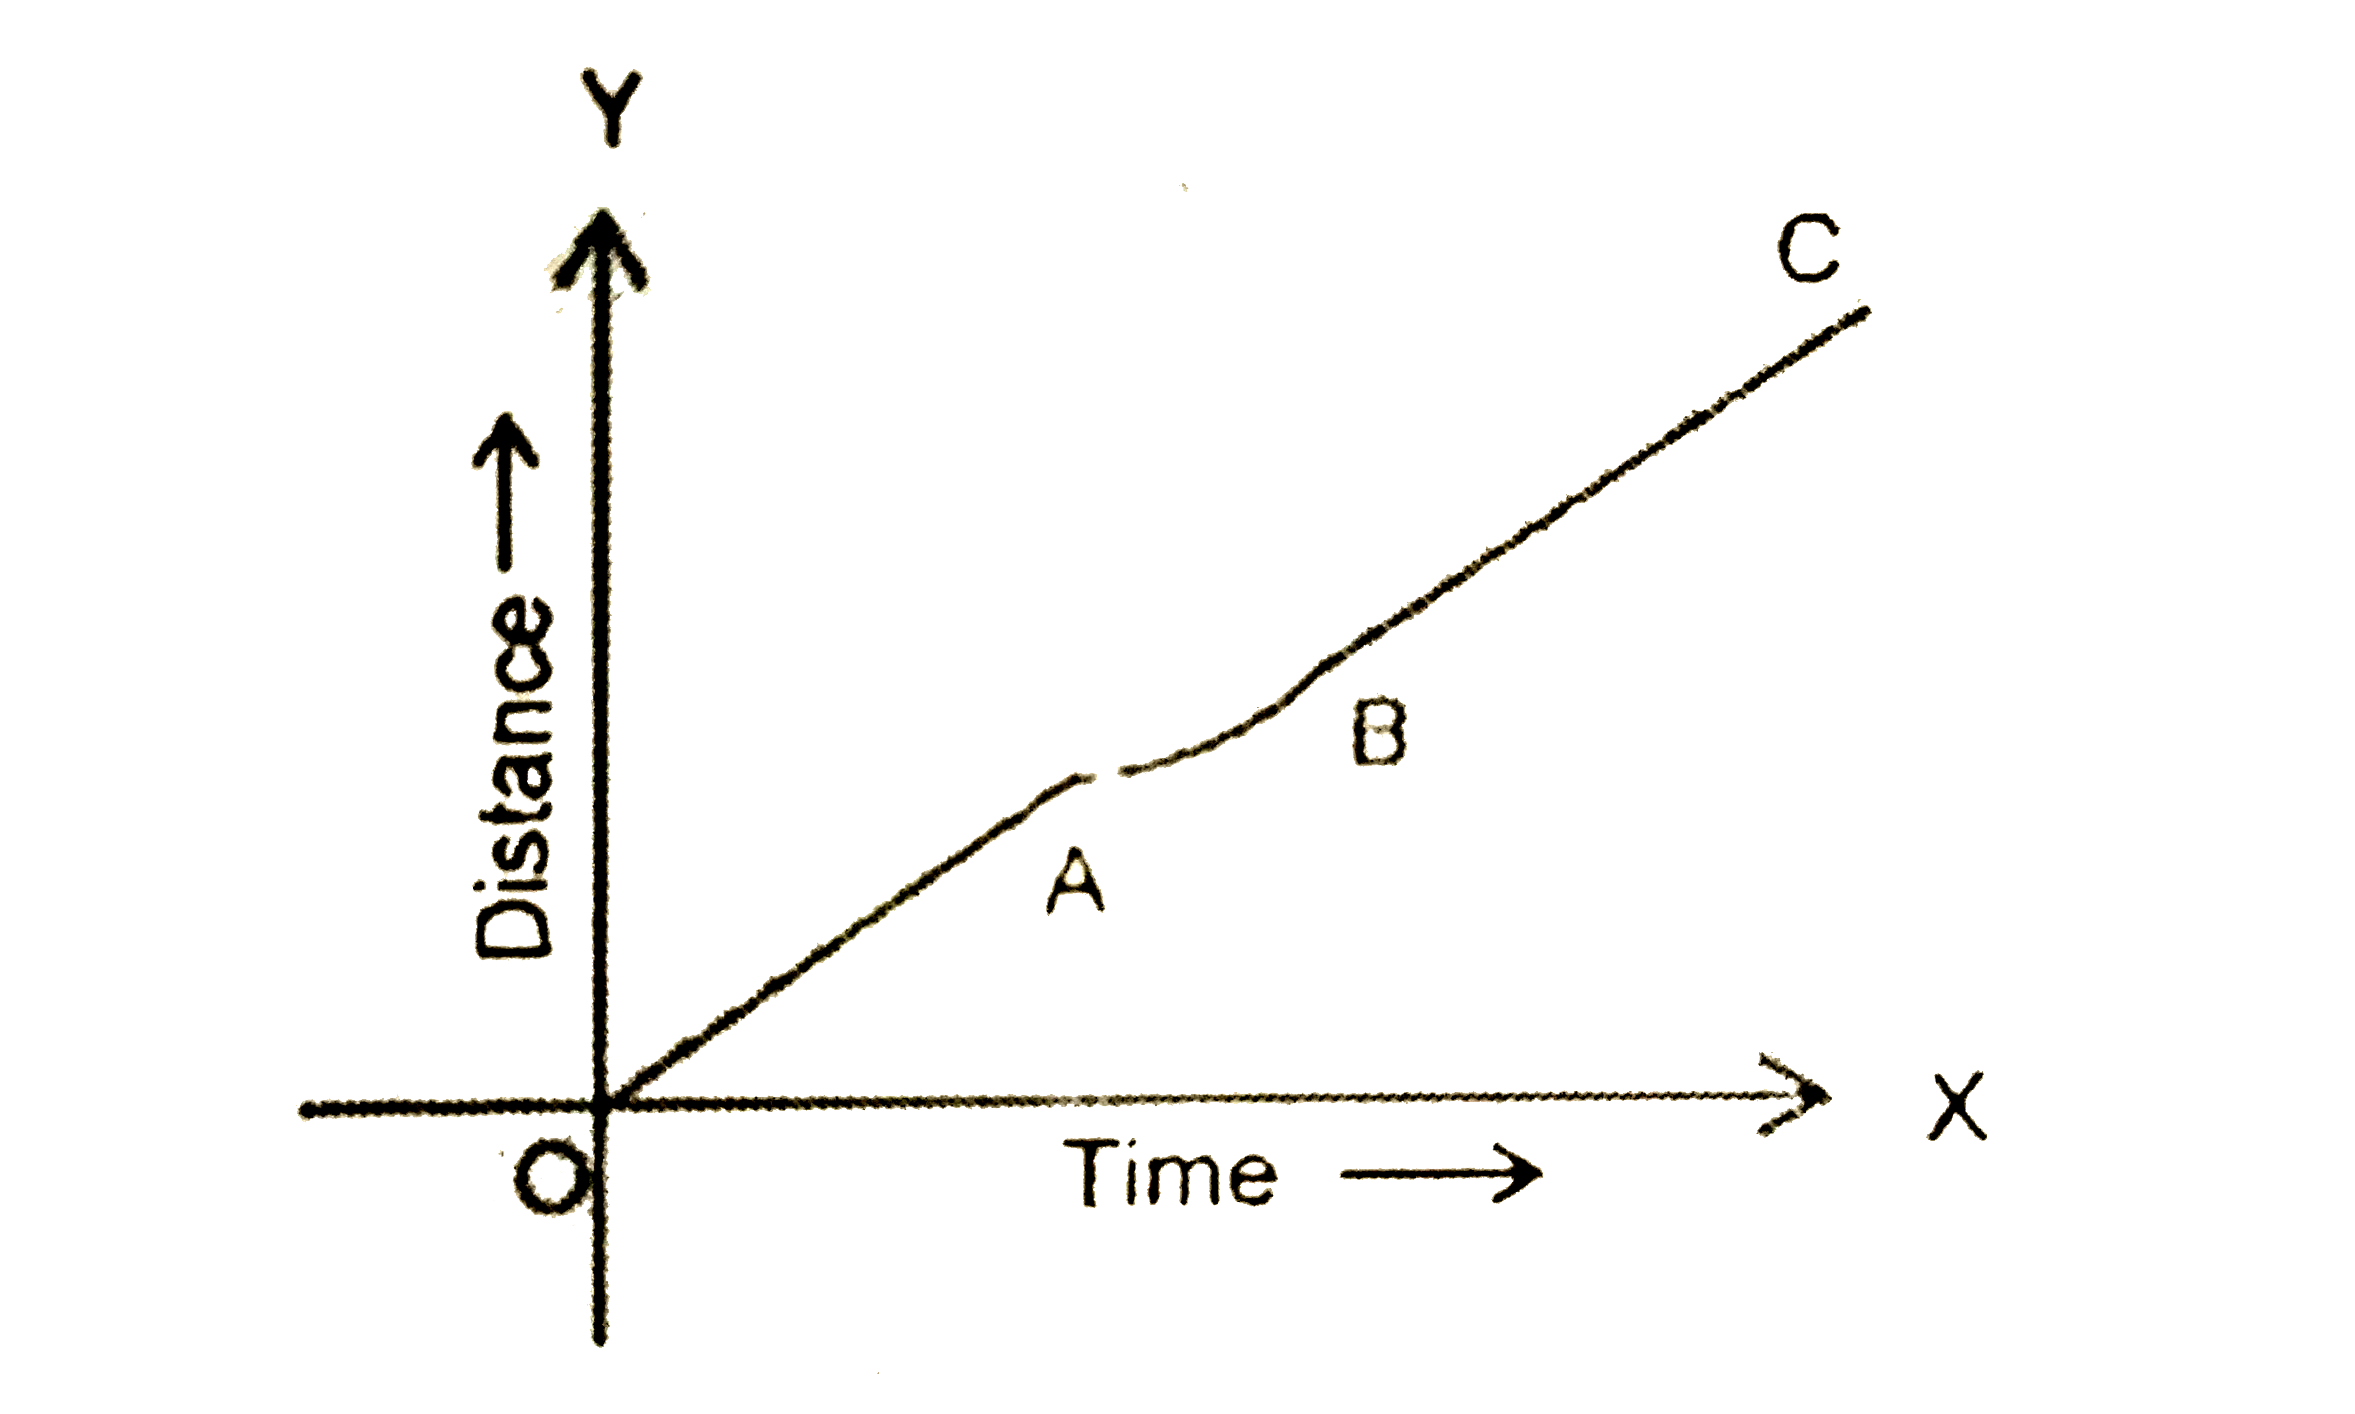
View SolutionThe distance- time graph of a body is as shown in the figure. The part of the graph that represent the unifrom speed of the body is
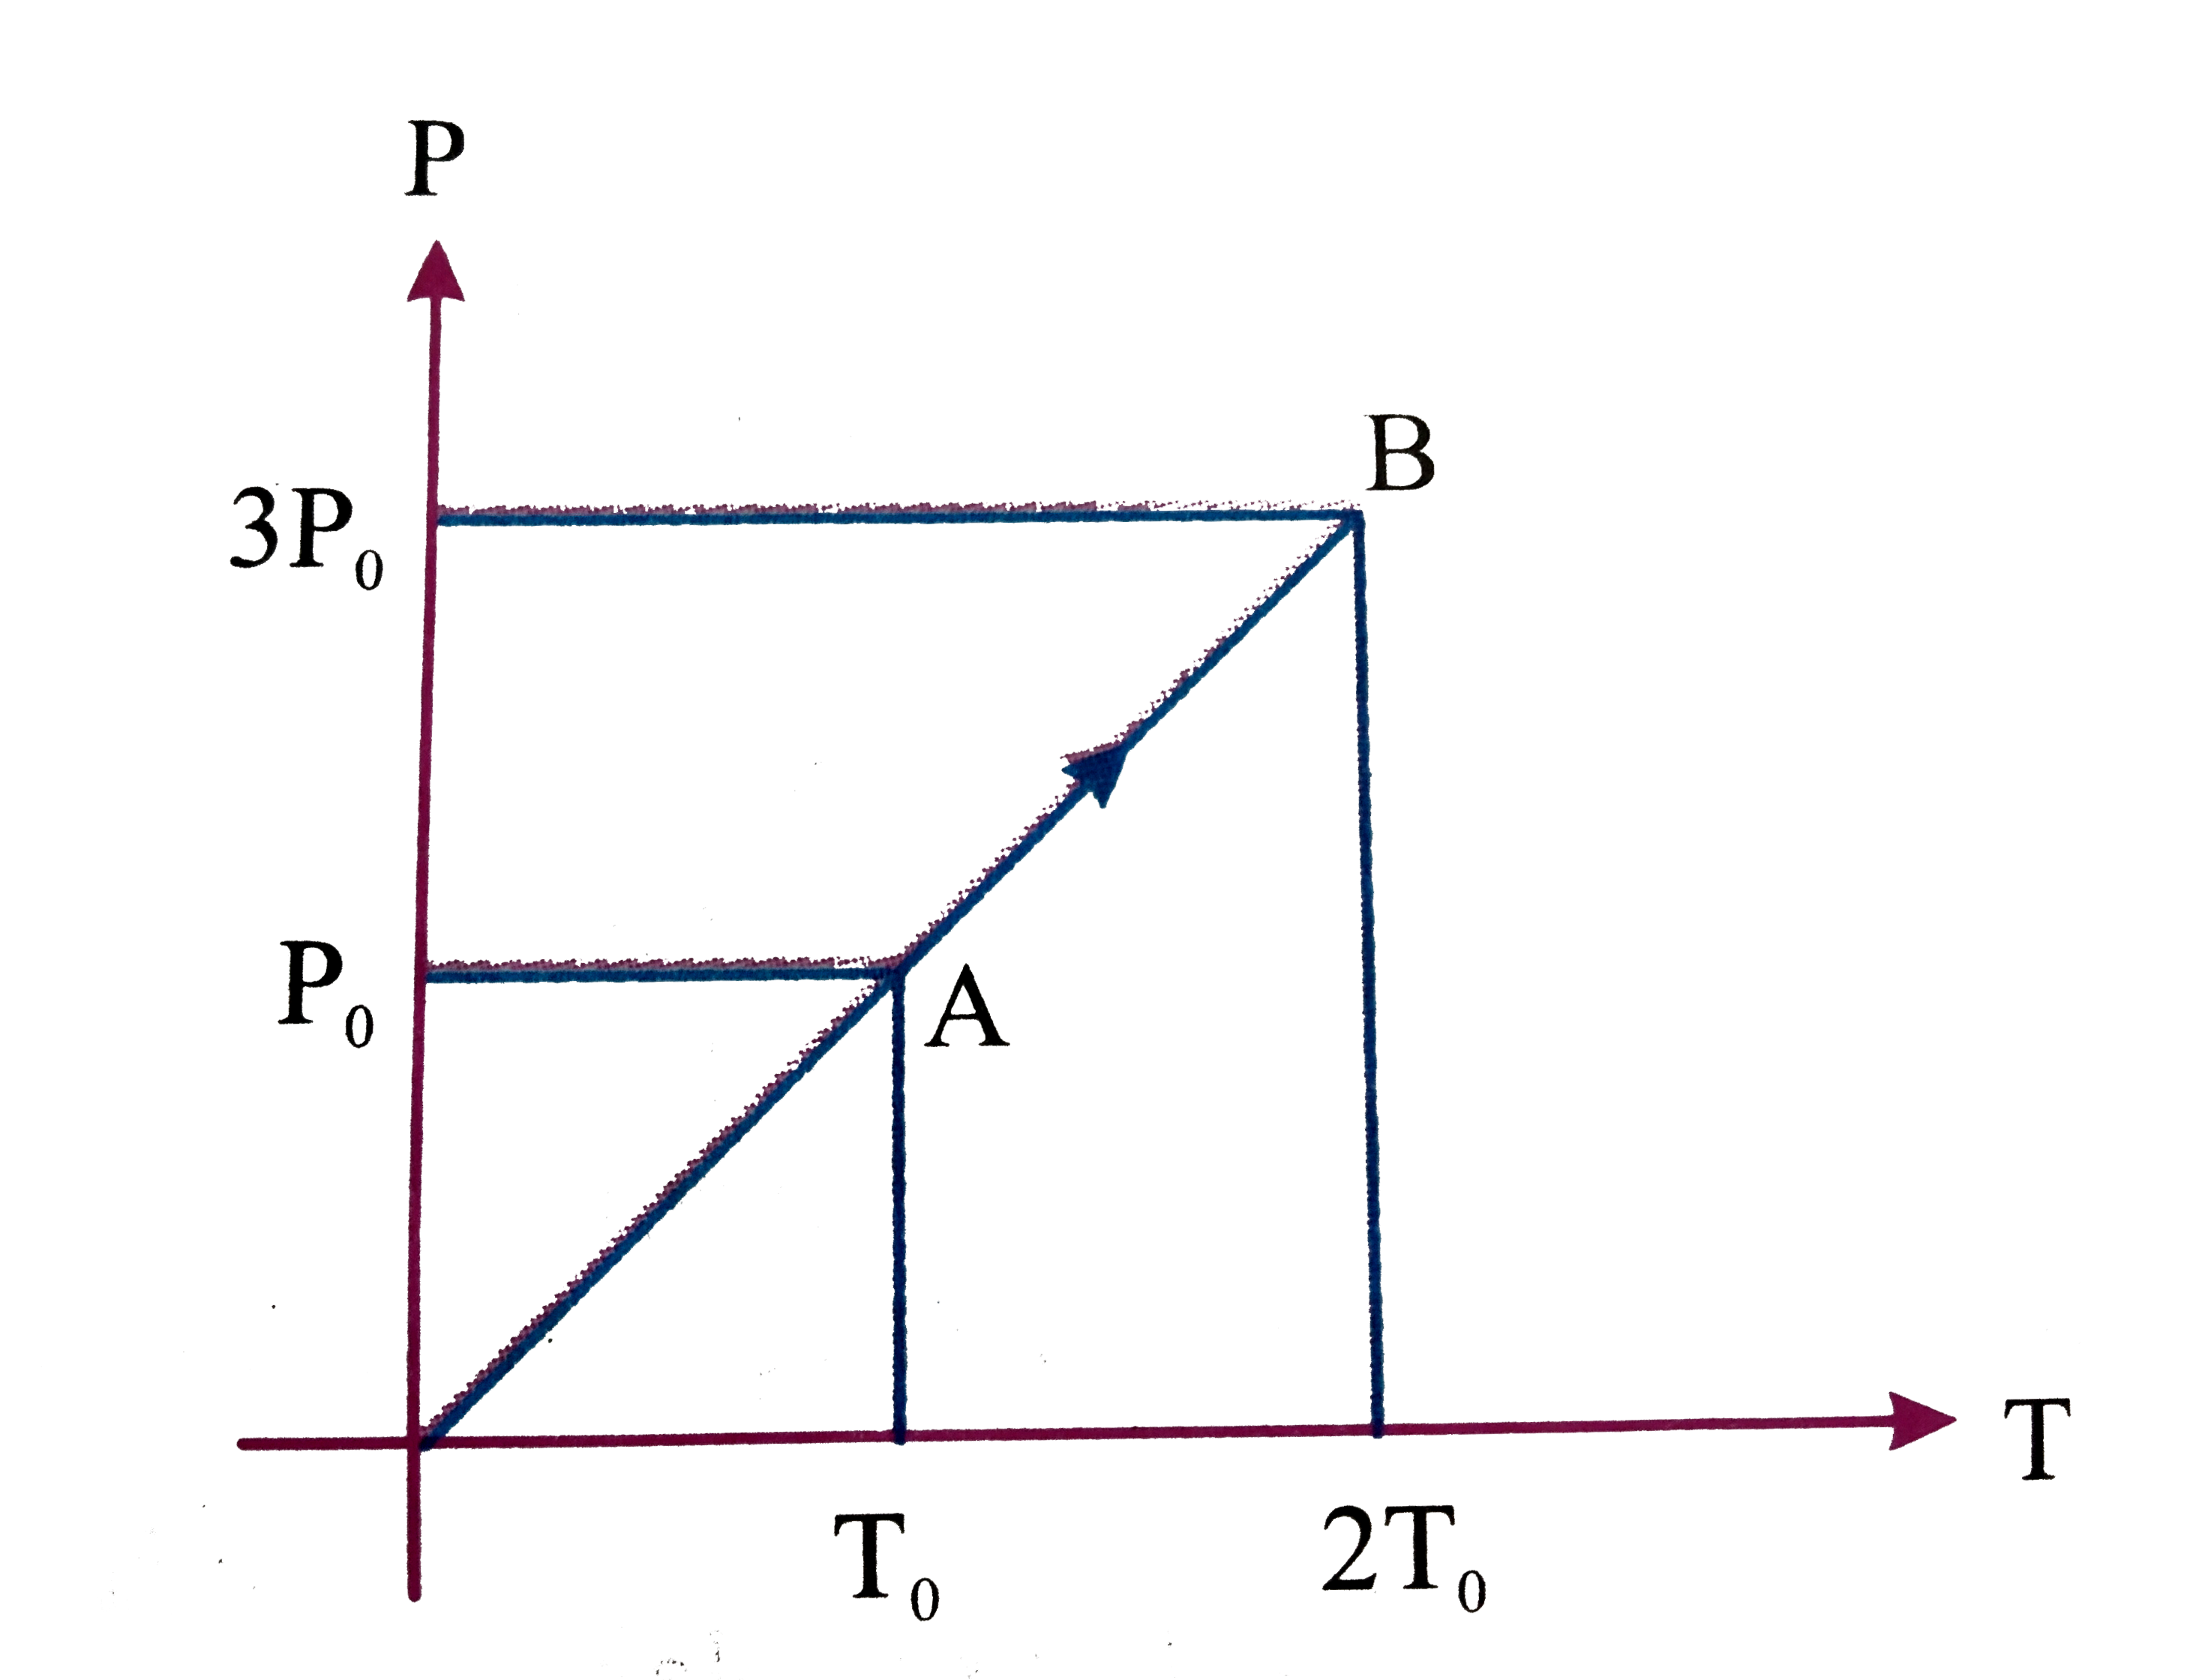
View SolutionPressure versus temperature graph of an ideal gas is shown in figure. Density of the gas at point A is ρ0. Density at B will be
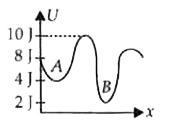
View SolutionA particle moves along x-axis whose potential energy versus x-coordinate graph is shown in the given figure. At x = 0, the particle is released form rest. Two potential wells A and B are shown in the figure. Then,
View SolutionFour cars A,B and C are moving on a levelled road. Their distance versus time graphs are shown in Fig. Choose the correct statement
View Solution

