Different hydrogen spectral series have different wave- lengths. In the given table, Column I shows the values of energy levels between which electronic transition takes place, Column II shows the formula of maximum wave- length of different spectral series and Column III shows the formula of minimum wavelength of different spectral series
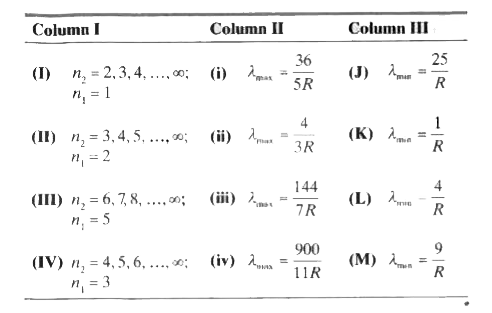
Determine the wavelengths λmaxandλmin for Pfund series.
(I)(ii)(M)
(III)(iv)(J)
(II)(ii)(K)
(II)(iv)(M)
The correct Answer is:A, B
Topper's Solved these Questions
- HYDROGEN ATOMBOOK - RESNICK AND HALLIDAYCHAPTER - HYDROGEN ATOMEXERCISE - PRACTICE QUESTIONS(Integer Type)
6 Videos
- HYDROGEN ATOMBOOK - RESNICK AND HALLIDAYCHAPTER - HYDROGEN ATOMEXERCISE - PRACTICE QUESTIONS (Linked Comprehension)
9 Videos
- HEAT-MEASUREMENT AND TRANSFERBOOK - RESNICK AND HALLIDAYCHAPTER - HEAT-MEASUREMENT AND TRANSFEREXERCISE - PRACTICE QUESTIONS( INTEGER TYPE)
5 Videos
- INTERFERENCE AND DIFFRACTION BOOK - RESNICK AND HALLIDAYCHAPTER - INTERFERENCE AND DIFFRACTION EXERCISE - PRACTICE QUESTIONS (Integer Type)
6 Videos
Similar Questions
There are different types of radioactive series that radioactivie decay follows. In the given table, Column I shows the end or stable nuclei which any one of the radioactive series produces, Column II shows the mass number of different tpes of ratioactive series and Column III shows different values of n different radioactive sereis.
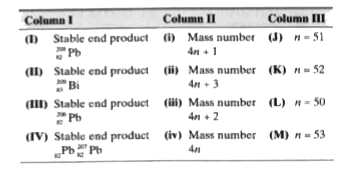
Determine the characteristics of neptunium.
View SolutionThere are different types of radioactive series that radioactivie decay follows. In the given table, Column I shows the end or stable nuclei which any one of the radioactive series produces, Column II shows the mass number of different tpes of ratioactive series and Column III shows different values of n different radioactive sereis.
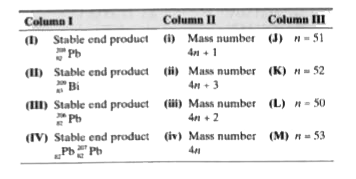
Determine the characteristics of actinium.
View Solution
Knowledge Check
Different hydrogen spectral series have different wave- lengths. In the given table, Column I shows the values of energy levels between which electronic transition takes place, Column II shows the formula of maximum wave- length of different spectral series and Column III shows the formula of minimum wavelength of different spectral series
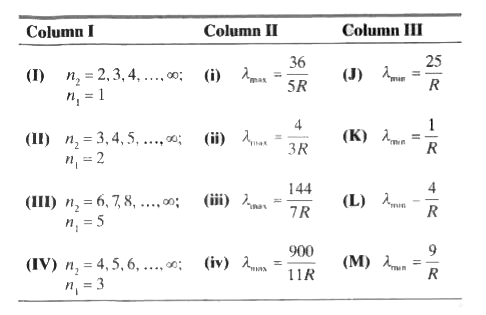
Determine the wavelengths, λmaxandλmin for Balmer series.A(II)(i)(L)B(III)(ii)(K)C(I)(i)(L)D(I)(iii)(J)Different hydrogen spectral series have different wave- lengths. In the given table, Column I shows the values of energy levels between which electronic transition takes place, Column II shows the formula of maximum wave- length of different spectral series and Column III shows the formula of minimum wavelength of different spectral series
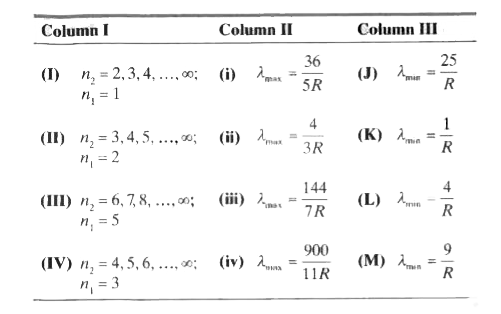
Determine the wavelength, λmaxandλmin for Paschen series.A(III)(i)(L)B(IV)(i)(J)C(III)(iv)(J)D(IV)(iii)(M)There are different types of radioactive series that radioactivie decay follows. In the given table, Column I shows the end or stable nuclei which any one of the radioactive series produces, Column II shows the mass number of different tpes of ratioactive series and Column III shows different values of n different radioactive sereis.
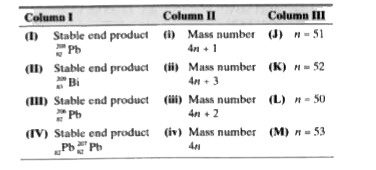
Determine the characteristics of thorium.A(III)(ii)(L)B(I)(iv)(K)C(II)(i)(M)D(II)(i)(K)
The amplitudes of two coherent waves are vector quanti- ties. In the given table, Column I shows the phase differ ence between two coherent waves, Column II shows the path difference between them and Column III shows their resultant amplitudes.
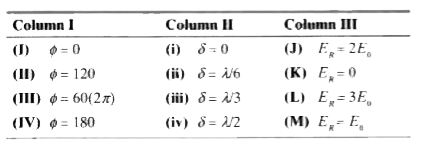
When is ER maximum?
View SolutionThe amplitudes of two coherent waves are vector quanti- ties. In the given table, Column I shows the phase differ ence between two coherent waves, Column II shows the path difference between them and Column III shows their resultant amplitudes.

When is the phasor diagram at secondary maxima?
View SolutionThe amplitudes of two coherent waves are vector quanti- ties. In the given table, Column I shows the phase differ ence between two coherent waves, Column II shows the path difference between them and Column III shows their resultant amplitudes.
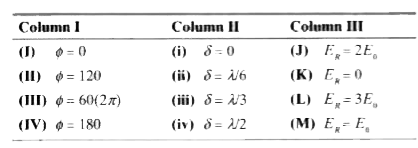
When is the phasor diagram at primary maxima?
View SolutionInterference is an important property of light. In the given table, Column I shows the properties of interfering waves, Column II shows the phase difference, and Column III shows the path difference between two interfering waves
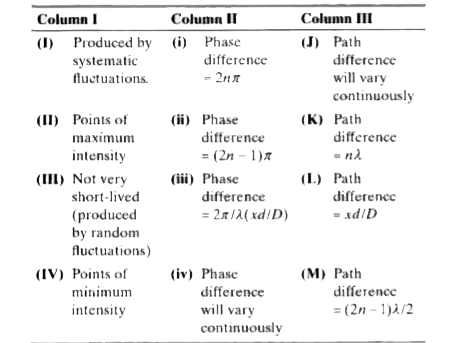
What are the conditions for sustained interference?
View SolutionInterference is an important property of light. In the given table, Column I shows the properties of interfering waves, Column II shows the phase difference, and Column III shows the path difference between two interfering waves
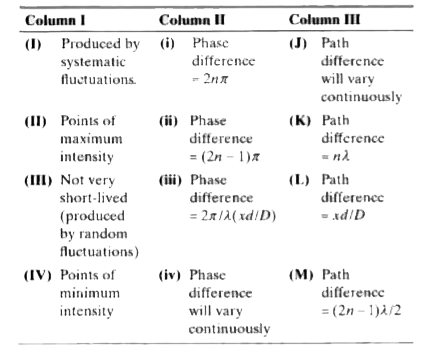
What are the conditions for destructive interference?
View Solution
