In a hydrogen atom, whenever there is transition of electron between different energy levels, energy is emitted or absorbed, and hydrogen spectrum is obtained. In the given table, Column I shows the names of the different series of hydrogen atom spectrum, Column II shows the energy levels from where electron transition takes place and Column III shows the EM wave region where these different series exists.
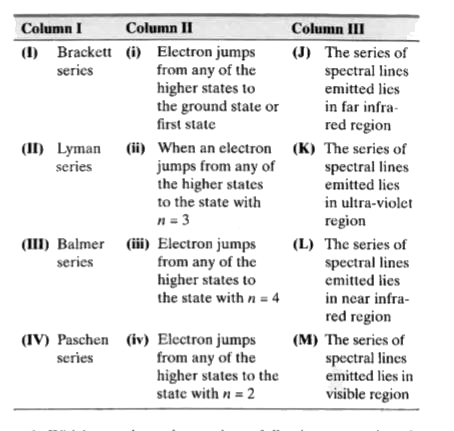
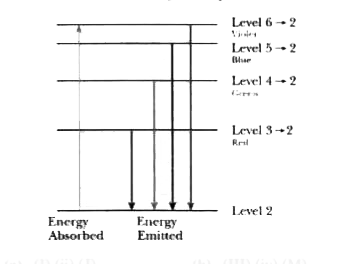
Which series does the diagram depict?
(I)(ii)(J)
(III)(iv)(M)
(II)(iii)(L)
(I)(i)(M)
The correct Answer is:A, B
Topper's Solved these Questions
- HYDROGEN ATOMBOOK - RESNICK AND HALLIDAYCHAPTER - HYDROGEN ATOMEXERCISE - PRACTICE QUESTIONS(Integer Type)
6 Videos
- HYDROGEN ATOMBOOK - RESNICK AND HALLIDAYCHAPTER - HYDROGEN ATOMEXERCISE - PRACTICE QUESTIONS (Linked Comprehension)
9 Videos
- HEAT-MEASUREMENT AND TRANSFERBOOK - RESNICK AND HALLIDAYCHAPTER - HEAT-MEASUREMENT AND TRANSFEREXERCISE - PRACTICE QUESTIONS( INTEGER TYPE)
5 Videos
- INTERFERENCE AND DIFFRACTION BOOK - RESNICK AND HALLIDAYCHAPTER - INTERFERENCE AND DIFFRACTION EXERCISE - PRACTICE QUESTIONS (Integer Type)
6 Videos
Similar Questions
Knowledge Check
In a hydrogen atom, whenever there is transition of electron between different energy levels, energy is emitted or absorbed, and hydrogen spectrum is obtained. In the given table, Column I shows the names of the different series of hydrogen atom spectrum, Column II shows the energy levels from where electron transition takes place and Column III shows the EM wave region where these different series exists.
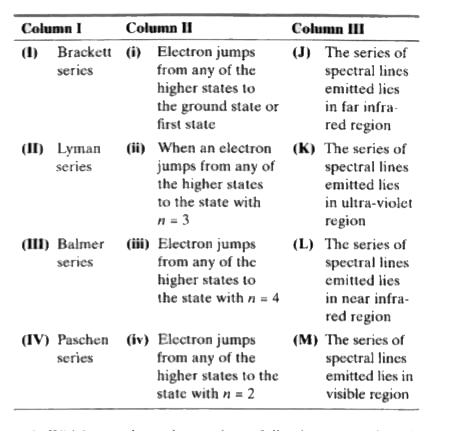
Which series has the following wavelength v=RZ2(142−1n22)?A(II)(ii)(J)B(I)(iii)(J)C(IV)(i)(L)D(II)(iii)(M)In a hydrogen atom, whenever there is transition of electron between different energy levels, energy is emitted or absorbed, and hydrogen spectrum is obtained. In the given table, Column I shows the names of the different series of hydrogen atom spectrum, Column II shows the energy levels from where electron transition takes place and Column III shows the EM wave region where these different series exists.
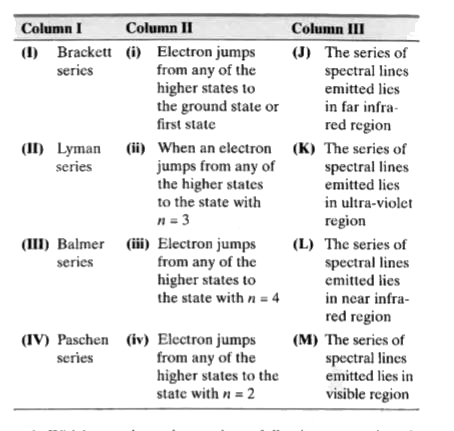
Which series has the following wavelength v=RZ2(112−1n22),n2=2,3,4,5,....?A(I)(iv)(M)B(IV)(ii)(L)C(II)(i)(K)D(II)(i)(K)In Hydrogen atom, electron is present in 6th energy level , which is / are correct about the Hydrogen spectrum?
ATotal 15 emission lines are observed in spectrumB4 emission lines belong to Lyman series and 5 emission lines belong to Balmer series.C2 emission lines belong to Brackett series and 3 emission lines belong to Paschen seriesDOne emission line belong to Humphry series
The shortest wavelength of the spectrum for transition of an electron to n=4energy level of a hydrogen like atom(atomic number = Z) is the same as the shortest wavelength of the Balmer series of hydrogen atom.The value of Z is:
View SolutionDifferent hydrogen spectral series have different wave- lengths. In the given table, Column I shows the values of energy levels between which electronic transition takes place, Column II shows the formula of maximum wave- length of different spectral series and Column III shows the formula of minimum wavelength of different spectral series
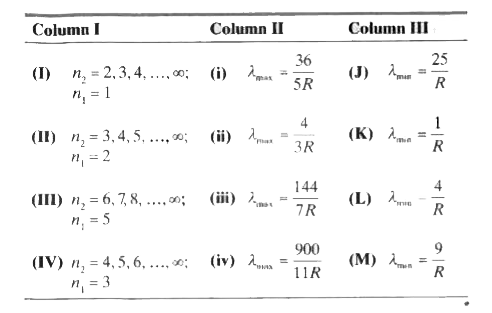
Determine the wavelengths λmaxandλmin for Pfund series.
View SolutionDifferent hydrogen spectral series have different wave- lengths. In the given table, Column I shows the values of energy levels between which electronic transition takes place, Column II shows the formula of maximum wave- length of different spectral series and Column III shows the formula of minimum wavelength of different spectral series
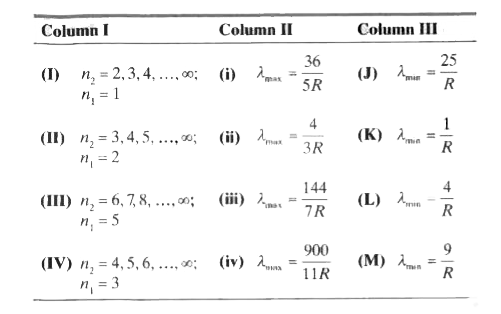
Determine the wavelength, λmaxandλmin for Paschen series.
View SolutionDifferent hydrogen spectral series have different wave- lengths. In the given table, Column I shows the values of energy levels between which electronic transition takes place, Column II shows the formula of maximum wave- length of different spectral series and Column III shows the formula of minimum wavelength of different spectral series
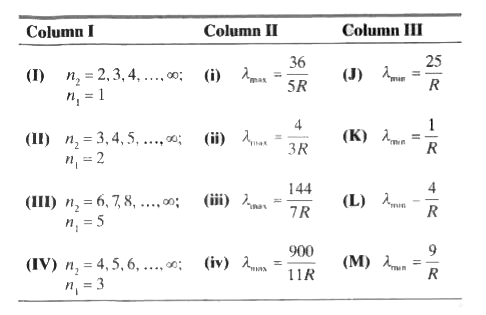
Determine the wavelengths, λmaxandλmin for Balmer series.
View SolutionThe wavelengths of the lines emitted in the Lyman series of the spectrum of hydrogen atom correspond to transitions between energy levels with total quantum numbers
View Solution
