Is the graph showing variation of current versus voltage for a diode linear or non-linear?
To determine whether the graph showing the variation of current (I) versus voltage (V) for a diode is linear or non-linear, we can analyze the behavior of the diode in both forward and reverse bias conditions.
1. Understanding the Diode Characteristics:
- A diode is a semiconductor device that allows current to flow in one direction (forward bias) and blocks it in the opposite direction (reverse bias).
2. Forward Bias Condition:
- In forward bias, when a small voltage is applied to the diode, initially, the current remains at zero until a certain threshold voltage (known as the forward voltage) is reached.
- Once this threshold is surpassed, the current increases rapidly with a small increase in voltage. This indicates a non-linear relationship because the current does not increase proportionally with voltage until the threshold is reached.
3. Reverse Bias Condition:
- In reverse bias, when the voltage is applied in the opposite direction, the current is very small (almost negligible) until a breakdown voltage is reached.
- After this breakdown voltage, the current can increase significantly, but this is not the normal operating condition for a diode and can lead to damage.
4. Graph Analysis:
- The graph of current versus voltage for a diode typically shows a flat region (zero current) until the forward voltage is reached, followed by a steep rise in current. In reverse bias, the current remains low until breakdown occurs.
- This behavior does not produce a straight line; instead, it creates a curve that indicates a non-linear relationship.
5. Conclusion:
- Therefore, the graph showing the variation of current versus voltage for a diode is non-linear. The current does not change uniformly with voltage, which is characteristic of a non-linear device.
Final Answer:
The graph showing the variation of current versus voltage for a diode is non-linear.
---
- A diode is a semiconductor device that allows current to flow in one direction (forward bias) and blocks it in the opposite direction (reverse bias).
- In forward bias, when a small voltage is applied to the diode, initially, the current remains at zero until a certain threshold voltage (known as the forward voltage) is reached.
- Once this threshold is surpassed, the current increases rapidly with a small increase in voltage. This indicates a non-linear relationship because the current does not increase proportionally with voltage until the threshold is reached.
- In reverse bias, when the voltage is applied in the opposite direction, the current is very small (almost negligible) until a breakdown voltage is reached.
- After this breakdown voltage, the current can increase significantly, but this is not the normal operating condition for a diode and can lead to damage.
- The graph of current versus voltage for a diode typically shows a flat region (zero current) until the forward voltage is reached, followed by a steep rise in current. In reverse bias, the current remains low until breakdown occurs.
- This behavior does not produce a straight line; instead, it creates a curve that indicates a non-linear relationship.
- Therefore, the graph showing the variation of current versus voltage for a diode is non-linear. The current does not change uniformly with voltage, which is characteristic of a non-linear device.
The graph showing the variation of current versus voltage for a diode is non-linear.
Topper's Solved these Questions
- CURRENT ELECTRICITYBOOK - MODERN PUBLICATIONCHAPTER - CURRENT ELECTRICITYEXERCISE - Objective Type Questions (MULTIPLE CHOICE QUESTIONS) (NCERT EXEMPLAR PROBLEMS)
11 Videos
- ATOMS BOOK - MODERN PUBLICATIONCHAPTER - ATOMS EXERCISE - Chapter Practice Test
16 Videos
- DUAL NATURE OF RADIATION AND MATTER BOOK - MODERN PUBLICATIONCHAPTER - DUAL NATURE OF RADIATION AND MATTER EXERCISE - CHAPTER PRACTICE TEST
15 Videos
Similar Questions
Knowledge Check
For a photoelectric cell the graph showing the variation of cut of voltage (V) with frequency (v) of incident light is best represented by
A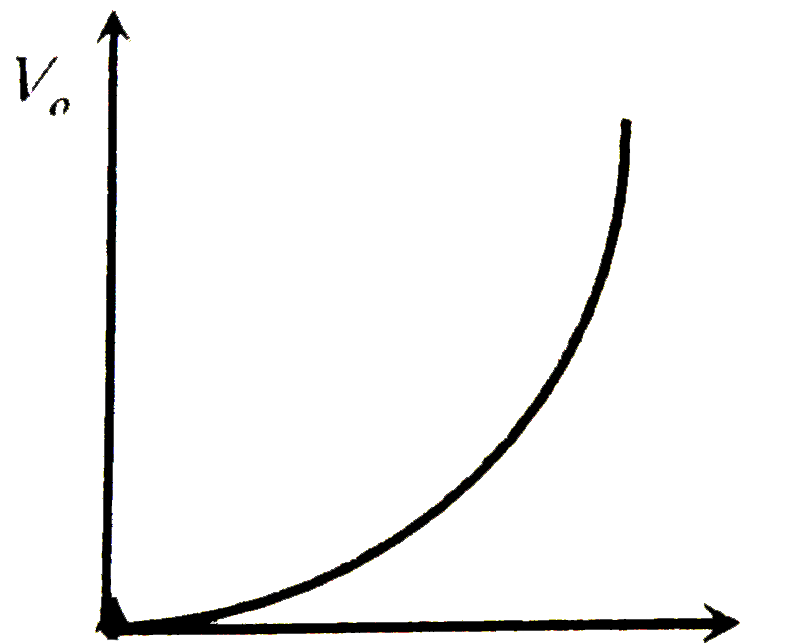 B
B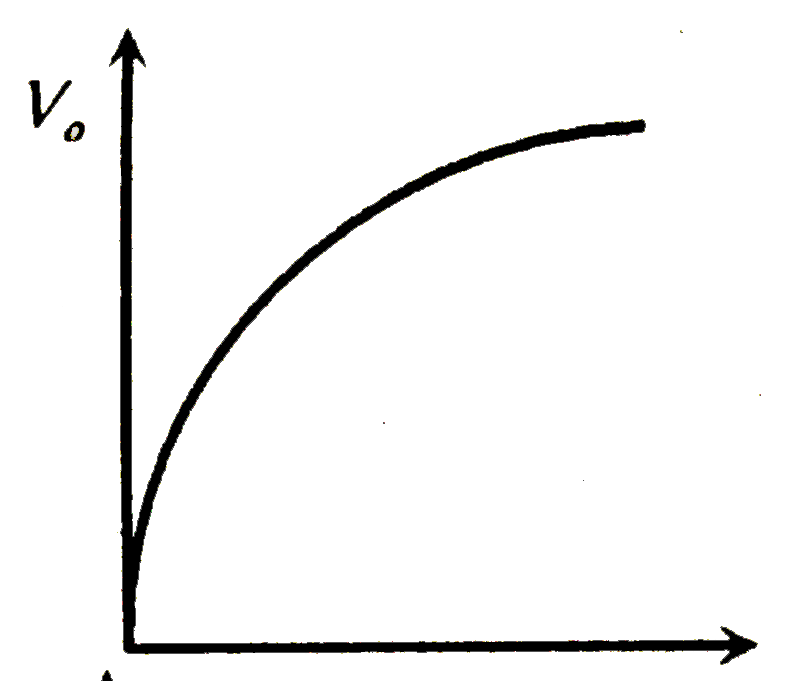 C
C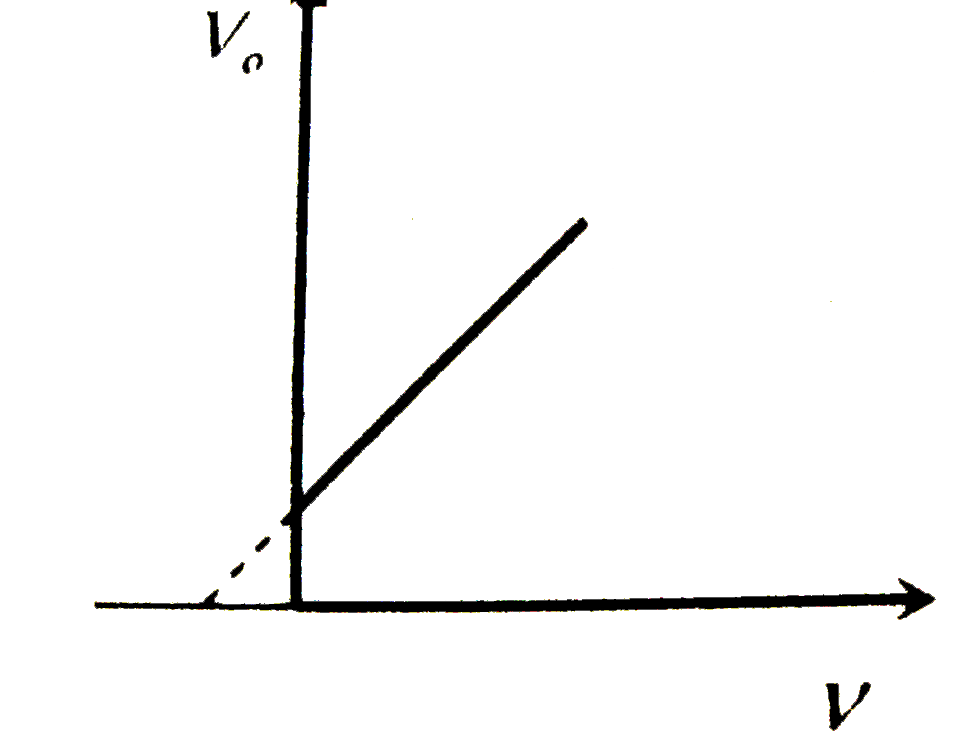 D
D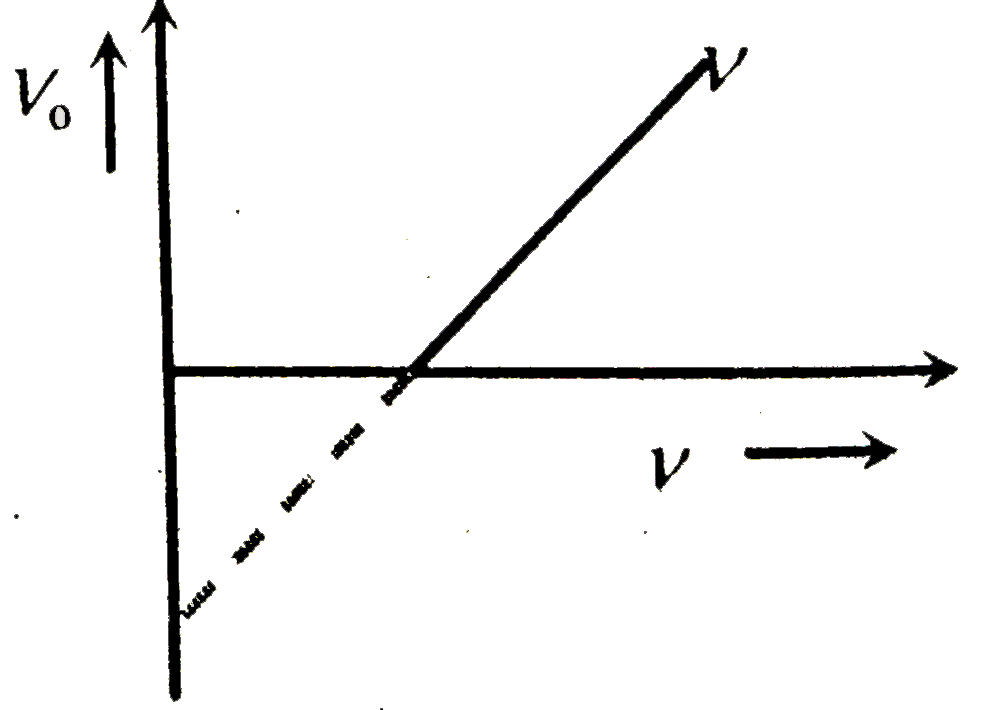
Draw the graph showing the variation of current with voltage for a p-n junction diode in forward bias as well as revese bias arrangements.
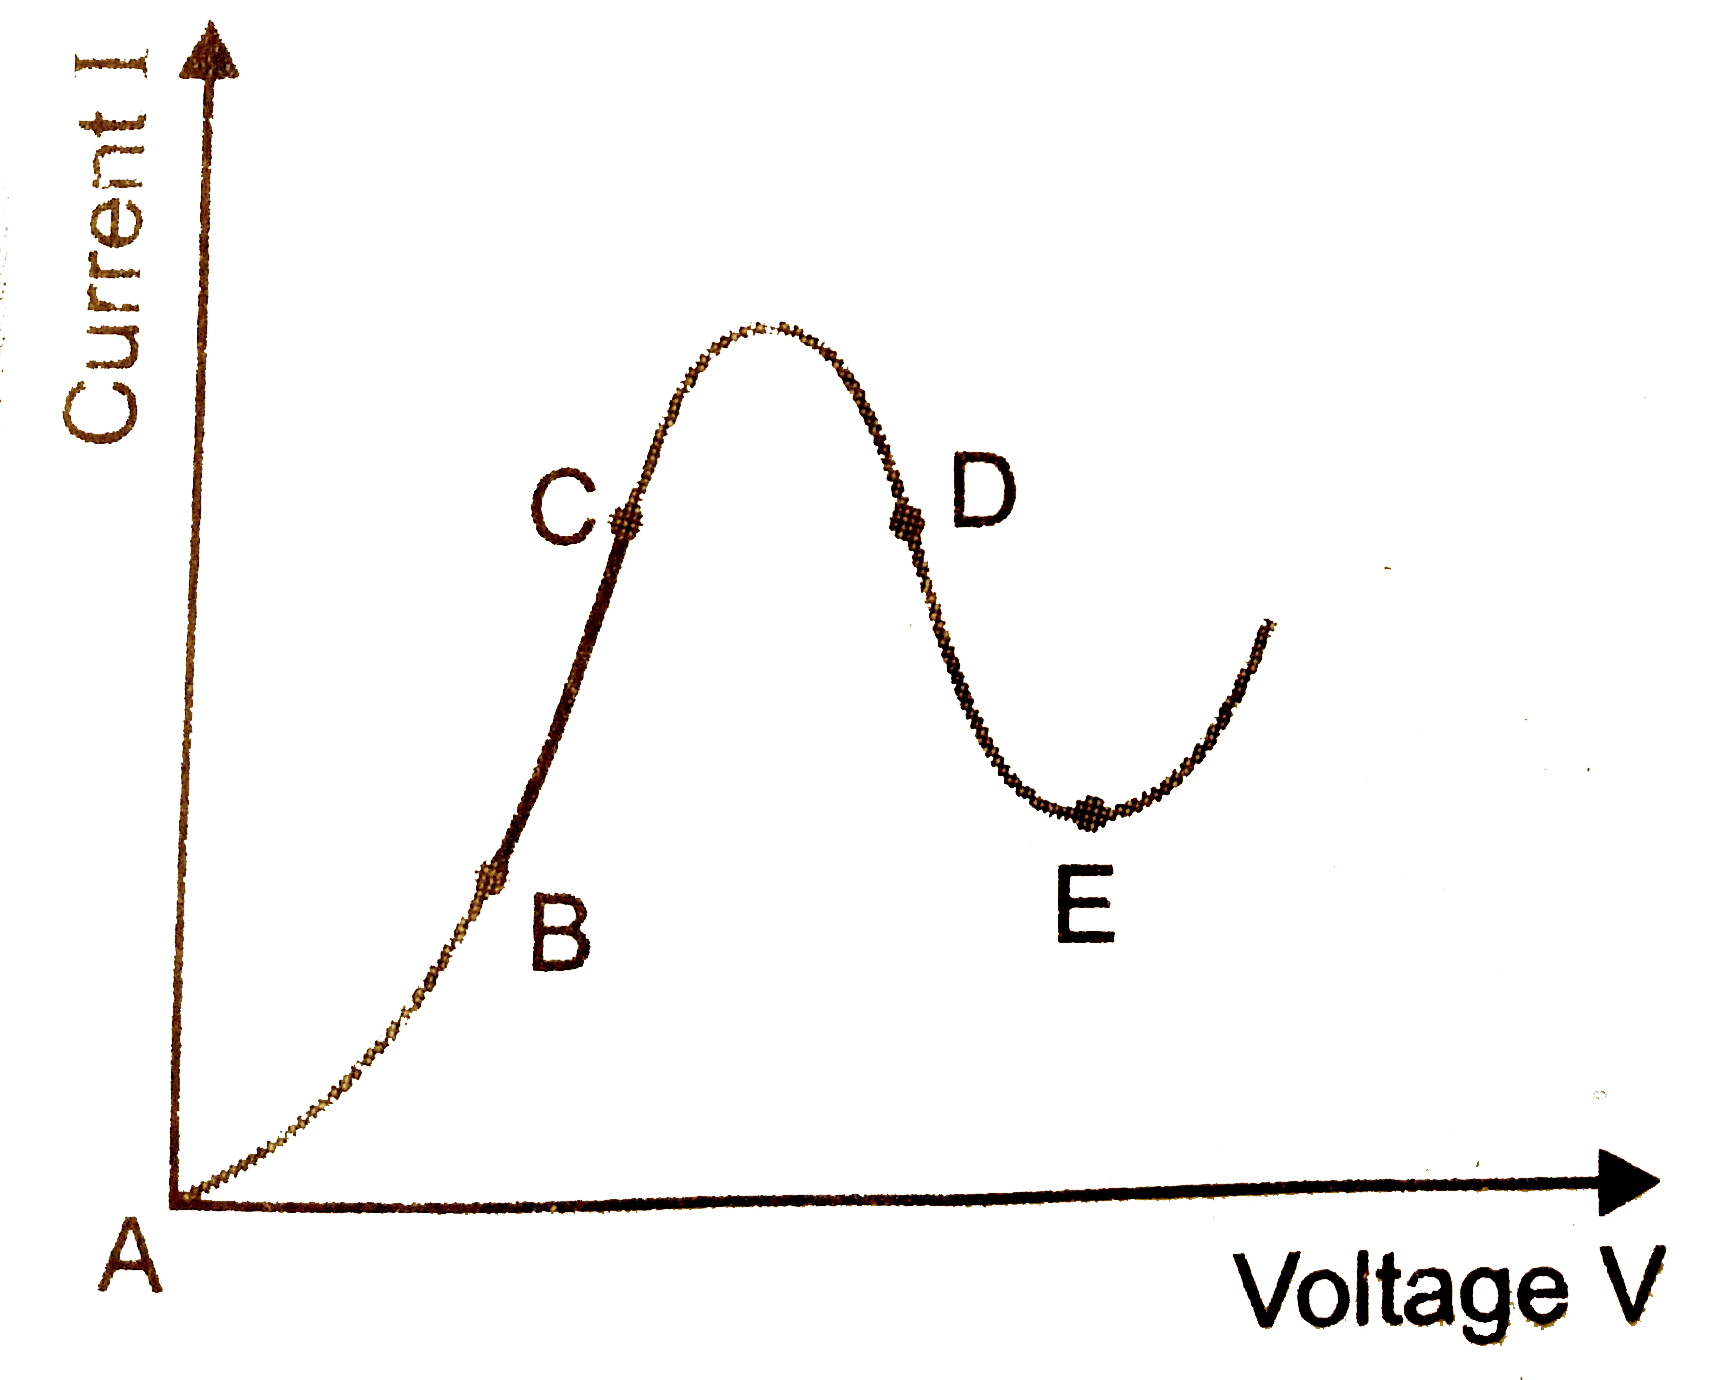
View SolutionGraph showing the variation of current versus voltage for a material GaAs is shown in figure. Identify the region of (i) negative resistance (ii) where Ohm's law is obeyed.
View SolutionDraw the graph showing the variation of current with voltage for a p-n junctin diode when the diode is (i) forward biased and (ii) reyerse biased
View Solution(a) Draw graph showing the variation of current versus voltage in an electroyte when an external resistance is also connceted.
(b) (i) The graph between resistance (R ) and temperature (T) for Hg is shown in the figure (a). Explain the behaviour of Hg near 4k.
(ii) In which region of the graph shown in the figure (b) is the resistance negative and why?

View SolutionGraph showing the variation of current versus voltage for a material GaAs is shown in figure. Identify the region of (i) negative resistance (ii) where Ohm's law is obeyed.

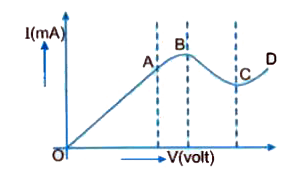
View SolutionGraph showing the variation of current versus voltage for a material Ga As (a semiconductor) is shown in the Fig. Identify the region of (i) negative resistance, (ii) where Ohm's law is obeyed.
View SolutionDarw graphs showing variation of photoelctric current with applied voltage for two incident radiations of equal frequecny and different intensities. Mark the graph for the radiaiton of higher intensity.
View Solution
