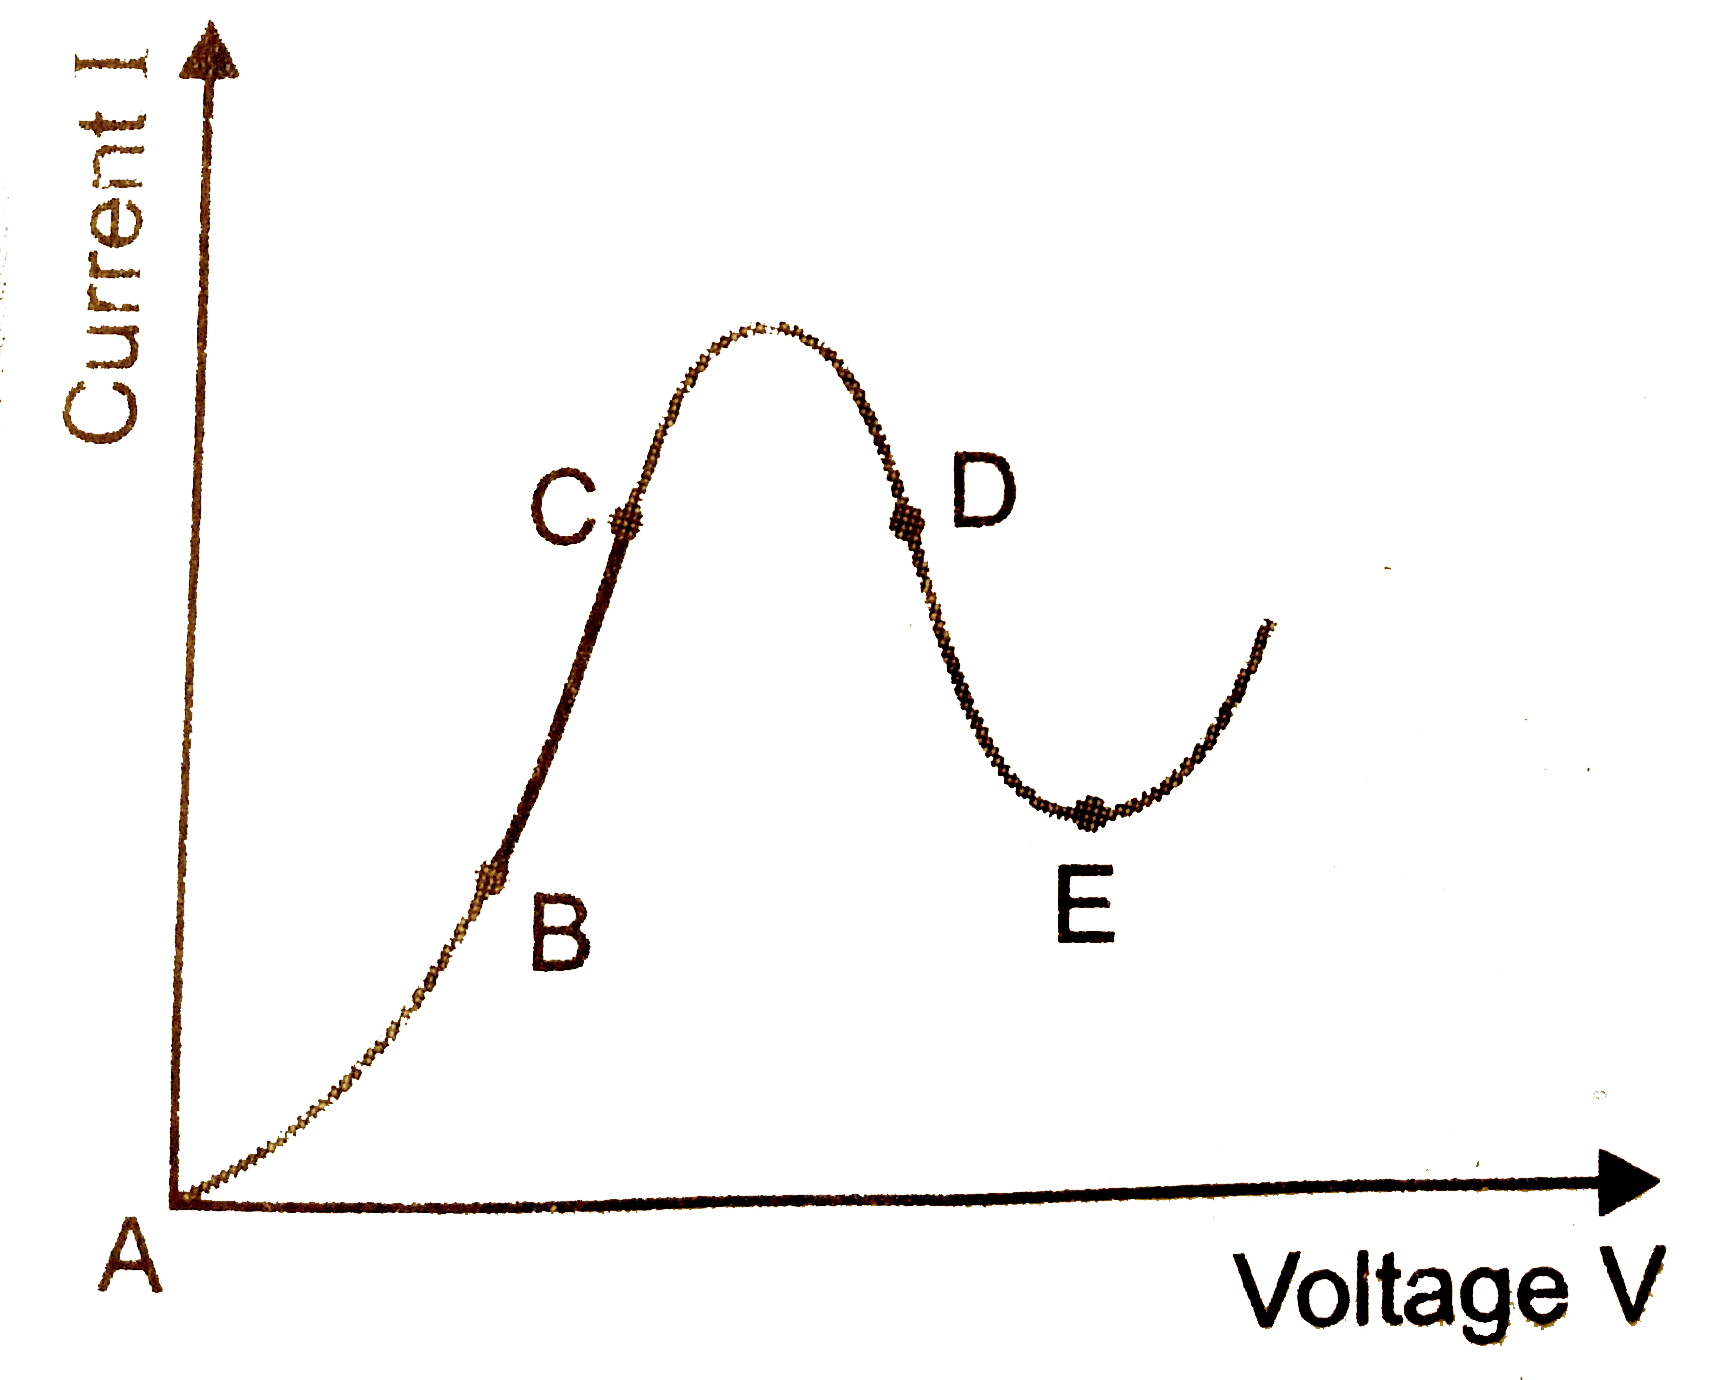
Graph showing the variation of current versus voltage for a material GaAs is shown in figure. Identify the region of (i) negative resistance (ii) where Ohm's law is obeyed.
Side bands (Lower side band and upper side band) are produced due to superposition of low frequency modulating signals on high frequency carrier waves.
Reason: The frequency of lower side band is ωc−ωm and of upper side band is ωc−ωm.
Topper's Solved these Questions
- CBSE EXAMINATION PAPER, DELHI REGION - 2015 (CODE NO. 55/1/1/D)BOOK - CBSE COMPLEMENTARY MATERIALCHAPTER - CBSE EXAMINATION PAPER, DELHI REGION - 2015 (CODE NO. 55/1/1/D)EXERCISE - SECTION B
6 Videos
- CBSE EXAMINATION PAPER, DELHI REGION - 2015 (CODE NO. 55/1/1/D)BOOK - CBSE COMPLEMENTARY MATERIALCHAPTER - CBSE EXAMINATION PAPER, DELHI REGION - 2015 (CODE NO. 55/1/1/D)EXERCISE - SECTION C
15 Videos
- CBSE Examination Paper Delhi–2014BOOK - CBSE COMPLEMENTARY MATERIALCHAPTER - CBSE Examination Paper Delhi–2014EXERCISE - SET-III (Questions Uncommon to set-I and II)
9 Videos
- DUAL NATURE OF MATTER AND RADIATION & ATOMS AND NUCLEIBOOK - CBSE COMPLEMENTARY MATERIALCHAPTER - DUAL NATURE OF MATTER AND RADIATION & ATOMS AND NUCLEIEXERCISE - Long Answer Question
22 Videos
Similar Questions
Graph showing the variation of current versus voltage for a material GaAs is shown in figure. Identify the region of (i) negative resistance (ii) where Ohm's law is obeyed.

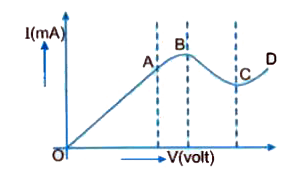
View SolutionGraph showing the variation of current versus voltage for a material Ga As (a semiconductor) is shown in the Fig. Identify the region of (i) negative resistance, (ii) where Ohm's law is obeyed.
View Solution
Knowledge Check
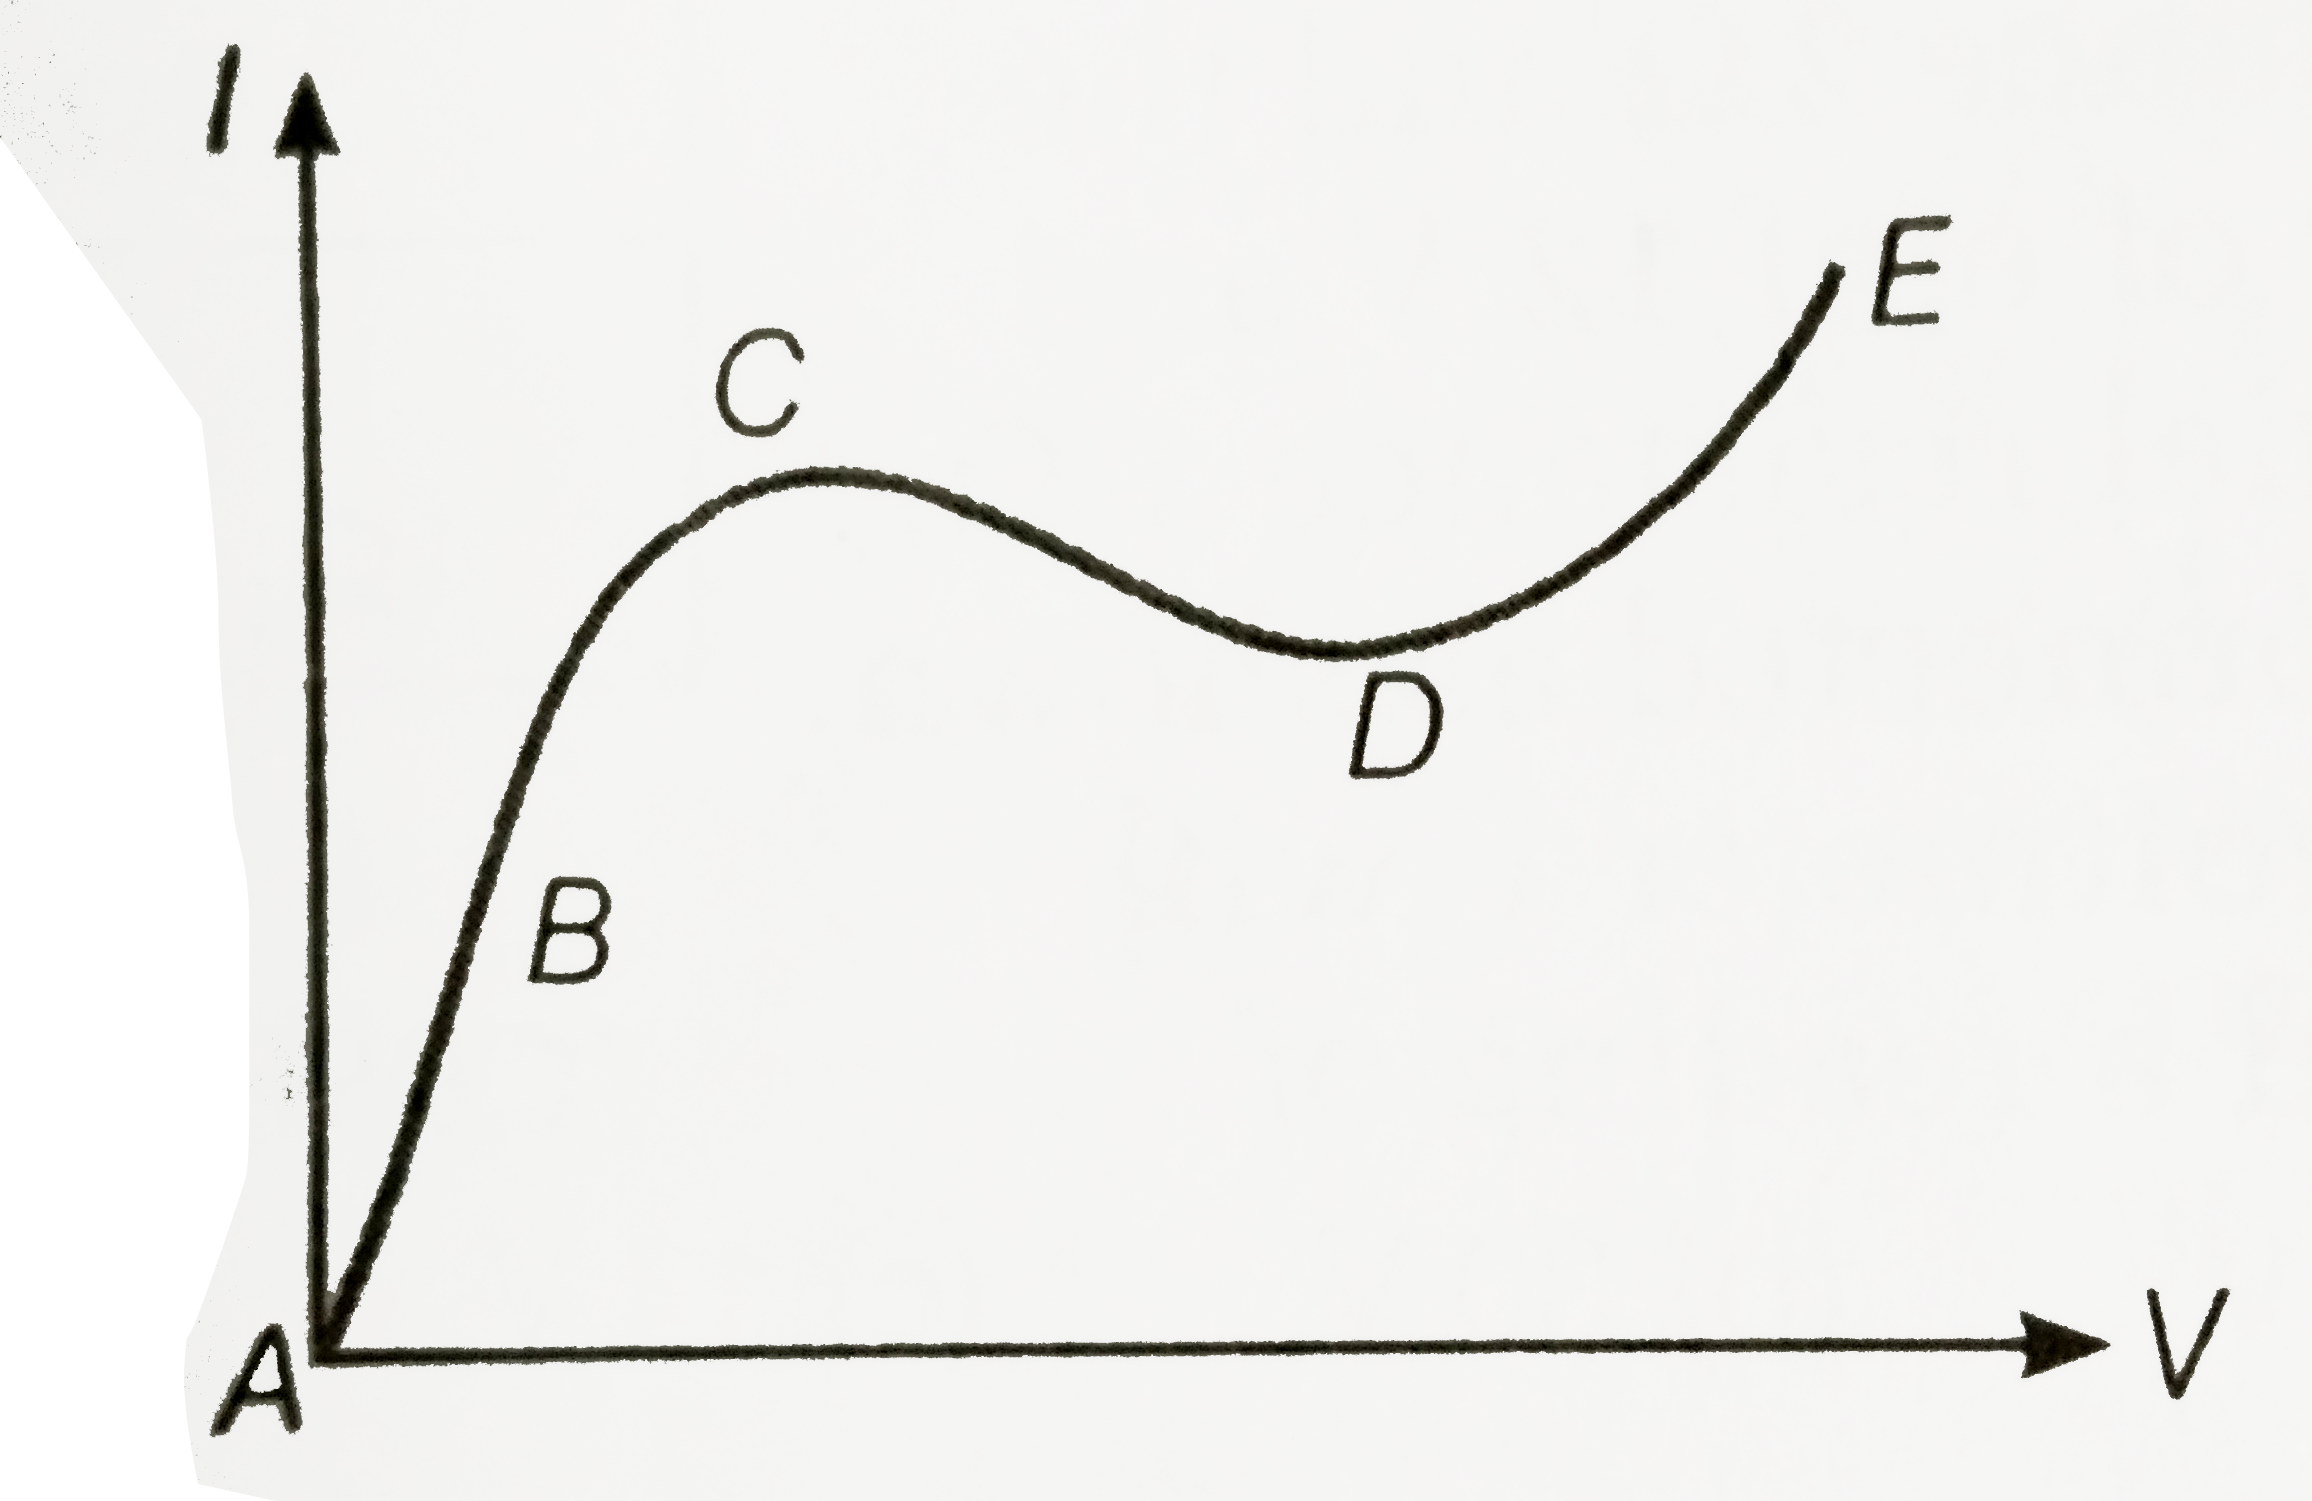
From the given between current I and voltage V shown in figure , indentify the portion corresponding to negative resistance
 ADEBCDCBCDAB
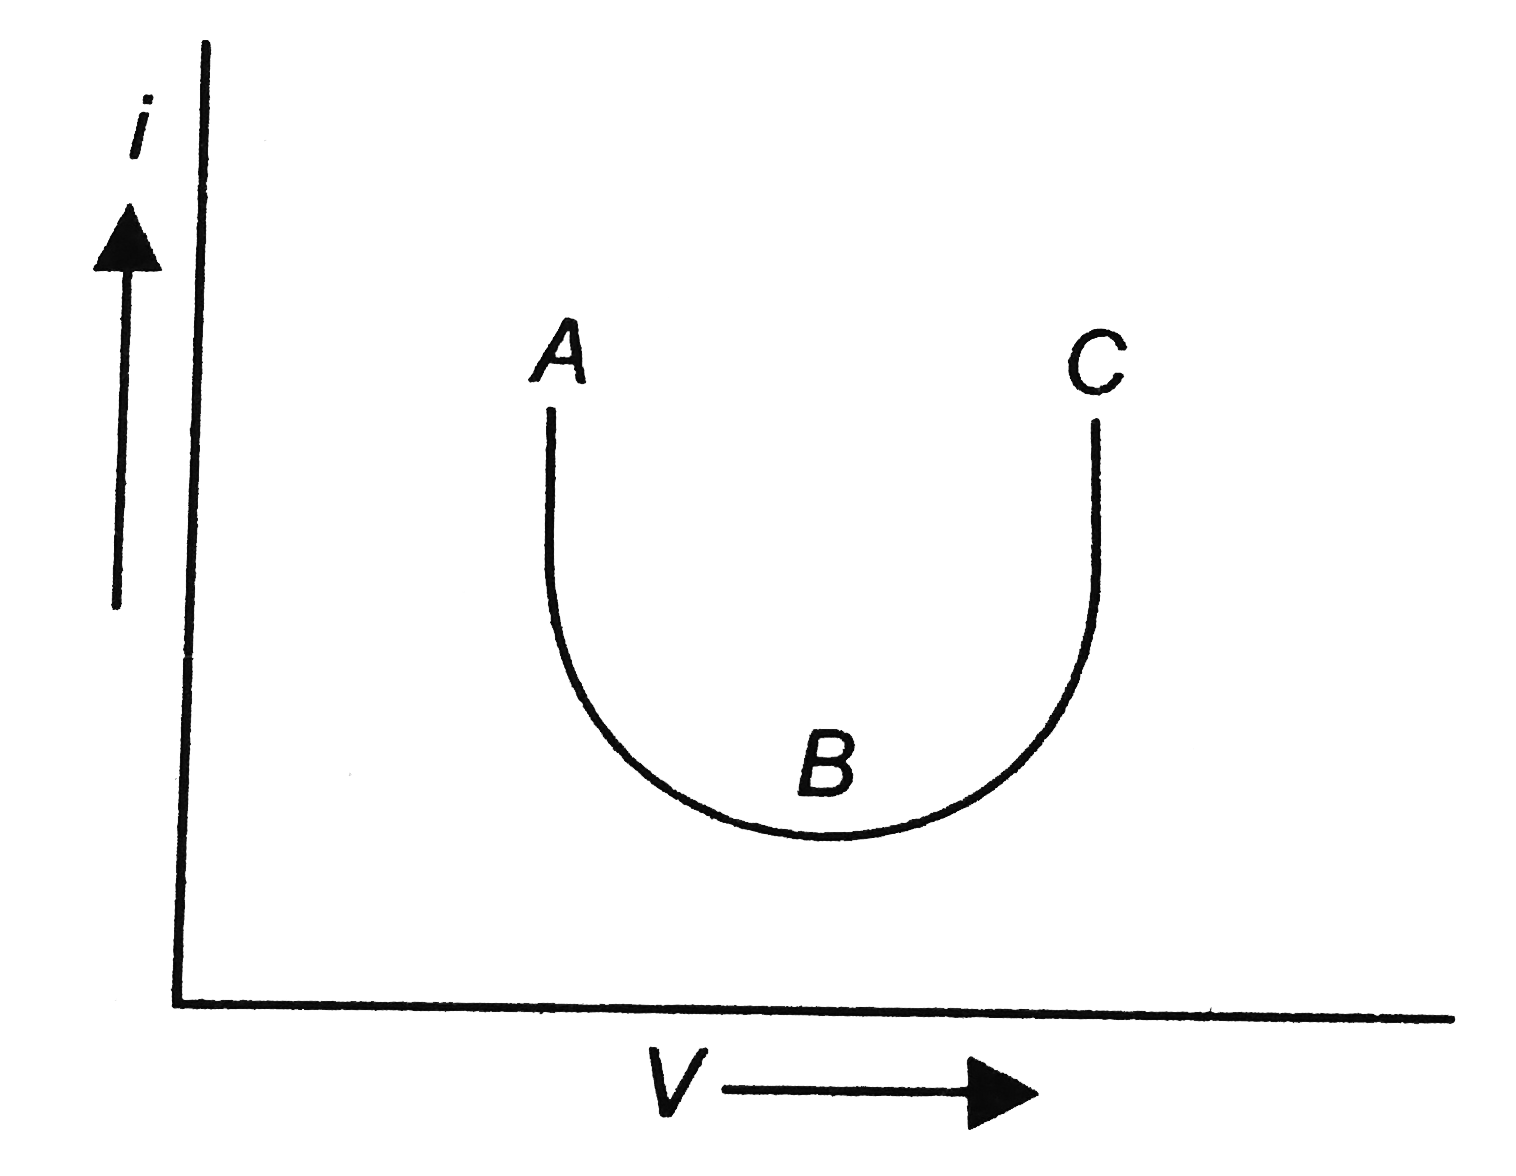
The current-voltage graph of a device is shown in figure. The resistance is negative in region.
 AABBBCCABCDNone of these
Plot a graph showing variation of current versus voltage for the material GaAs
View SolutionPlot a graph showing variation of current versus voltage for the material Ga.
View SolutionIs the graph showing variation of current versus voltage for a diode linear or non-linear?
View SolutionThe graph of current versus voltage drop across the three resistors P,Q,R is shown above. Find the ratio of their resistances.
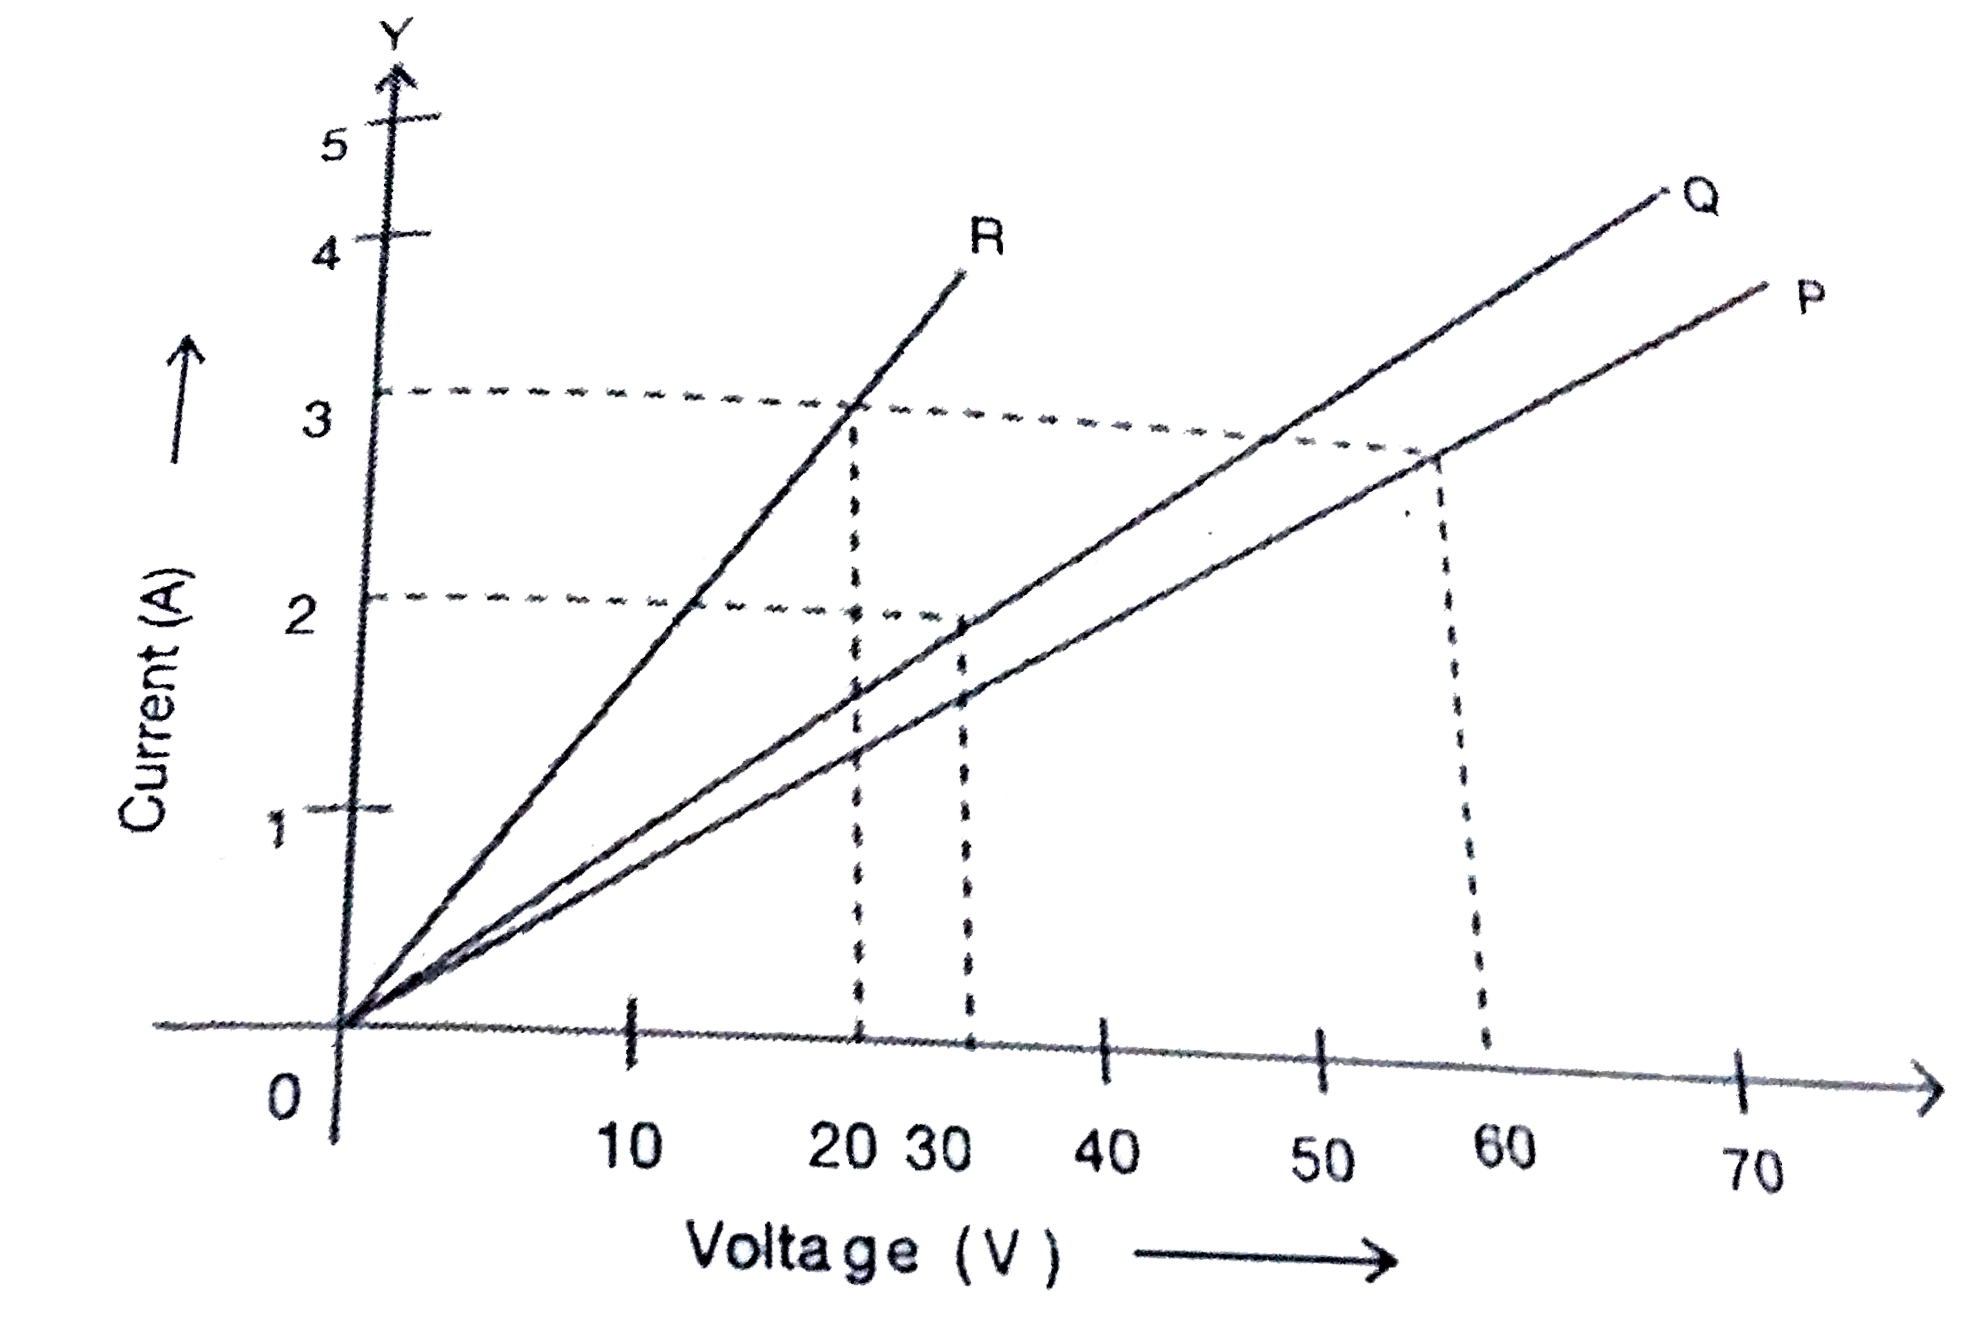
View SolutionVariation of current and voltage in a conductor is shown in the adjoining figure. The resistance of the conductor is
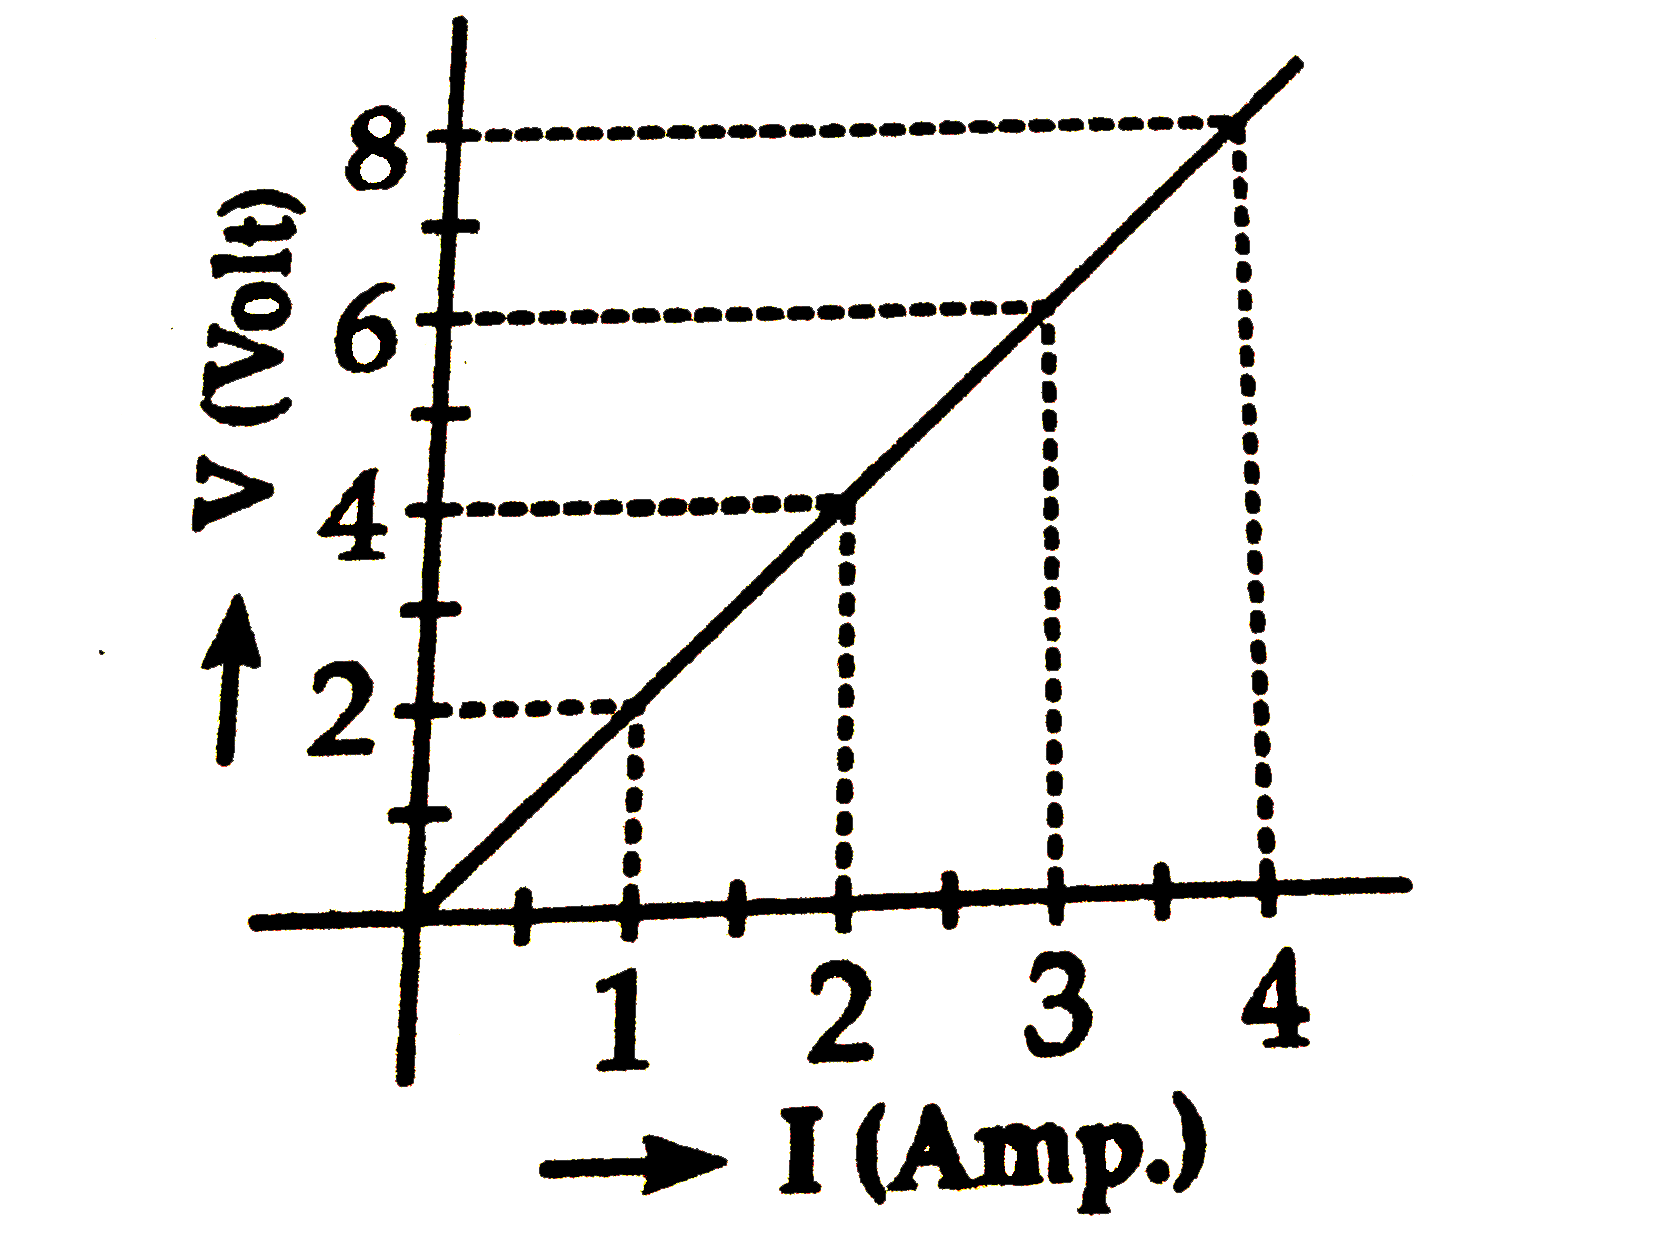
View Solution(a) Draw graph showing the variation of current versus voltage in an electroyte when an external resistance is also connceted.
(b) (i) The graph between resistance (R ) and temperature (T) for Hg is shown in the figure (a). Explain the behaviour of Hg near 4k.
(ii) In which region of the graph shown in the figure (b) is the resistance negative and why?

View Solution
