The maximum kinetic energy of the emitted photoelectrons against frequency ε of incident radiation is plotted as shown in figure. This graph help us in determining the following physical quantities

Work function of the cathode-metal
Threshold frequency
Planck's constant
Charge on an electron
The correct Answer is:A, B, C
(a,b,c) : Intercept of straight line on negative energy axis gives the value of work function of the cathode metal. The point where the straight line cuts the frequency axis give the value of work function of the cathode metal . The point where the straight line cuts the frequency axis gives the value of threshold frequency while the slope of straight line provides the value of Planck.s constant.
Topper's Solved these Questions
- PARTICLE NATURE OF LIGHT AND WAVE PARTICLE DUALISMBook:MTG-WBJEEChapter:PARTICLE NATURE OF LIGHT AND WAVE PARTICLE DUALISMExercise:WB JEE PREVIOUS YEARS QUESTIONS
Explore 15 Videos
- OSCILLATIONS AND WAVESBook:MTG-WBJEEChapter:OSCILLATIONS AND WAVESExercise:WB JEE PREVIOUS YEARS QUESTIONS (CATEGORY 3: ONE OR MORE THAN ONE OPTION CORRECT TYPE (2 MARKS))
Explore 2 Videos
- SOLID STATE ELECTRONS Book:MTG-WBJEEChapter:SOLID STATE ELECTRONS Exercise:WB JEE Previous Years Questions (CATEGORY 1 : Single Option Correct Type)
Explore 15 Videos
Similar Questions
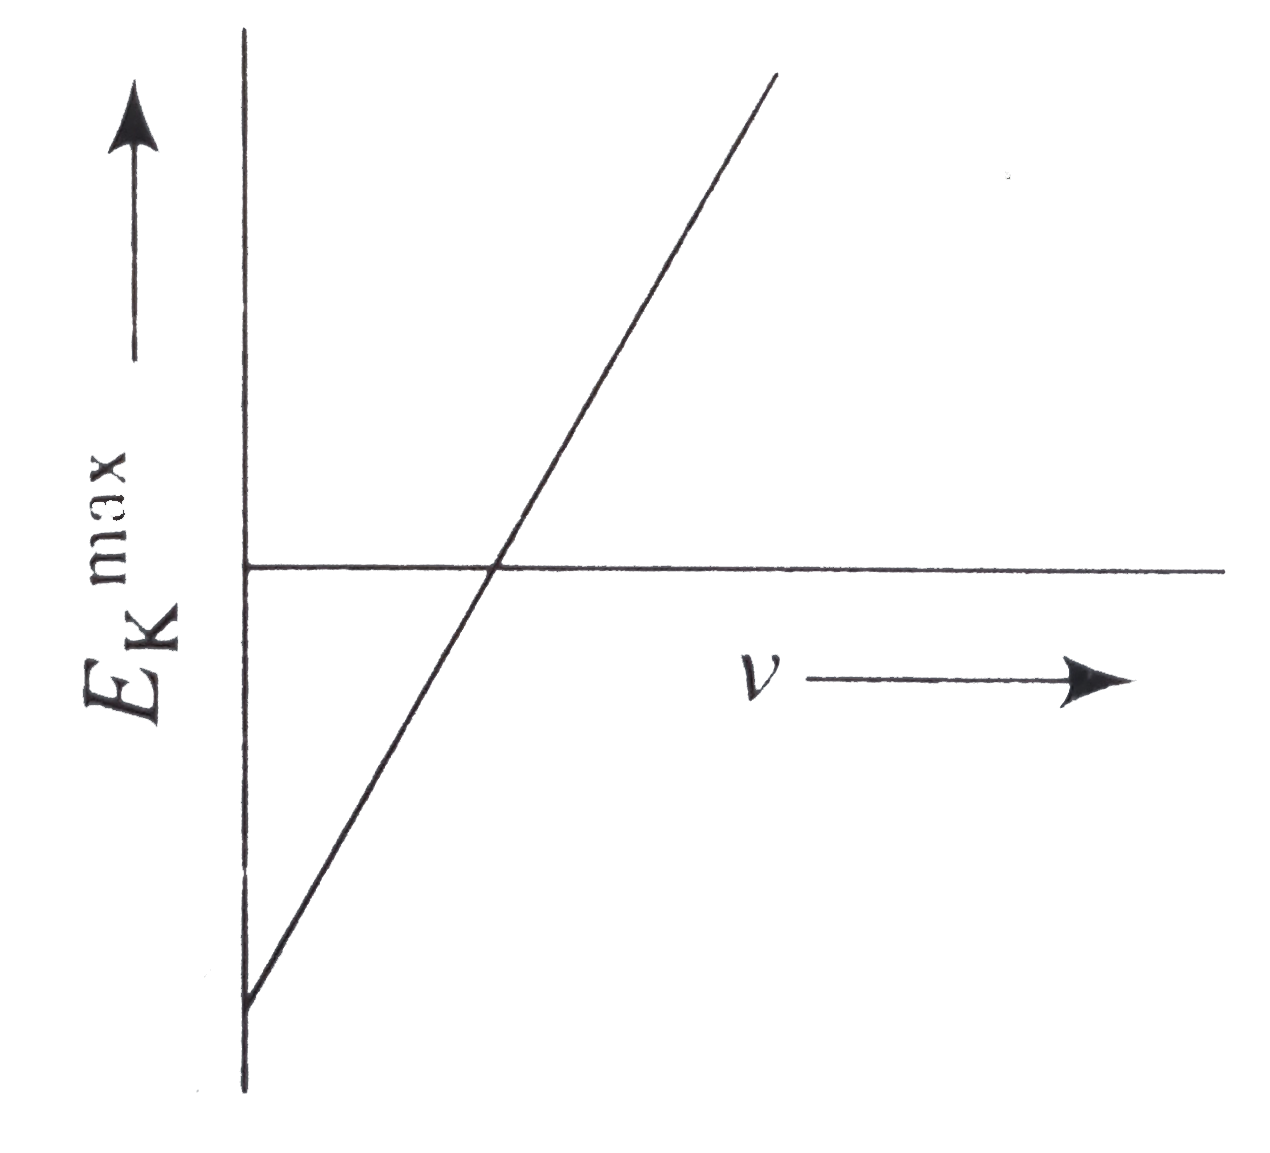
The maximum kinetic energy of the emitted photoelectrons against frequency υ of incident radiation is plotted as shown in Fig. This graph help us in determining the following physical quantities
View SolutionHow does kinetic energy of ejected photoelectrons depend upon the frequency of incident radiation?
View Solution
Knowledge Check

The maximum kinetic energy of the emitted photoelectrons against frequency υ of incident radiation is plotted as shown in Fig. This graph help us in determining the following physical quantitiesAwork function of the cathode-metalBthreshold frequencyCPlanck's constantDcharge on an electronMaximum kinetic energy (Ek) of a photoelectron varies with the frequency (v) of the incident radiation as
A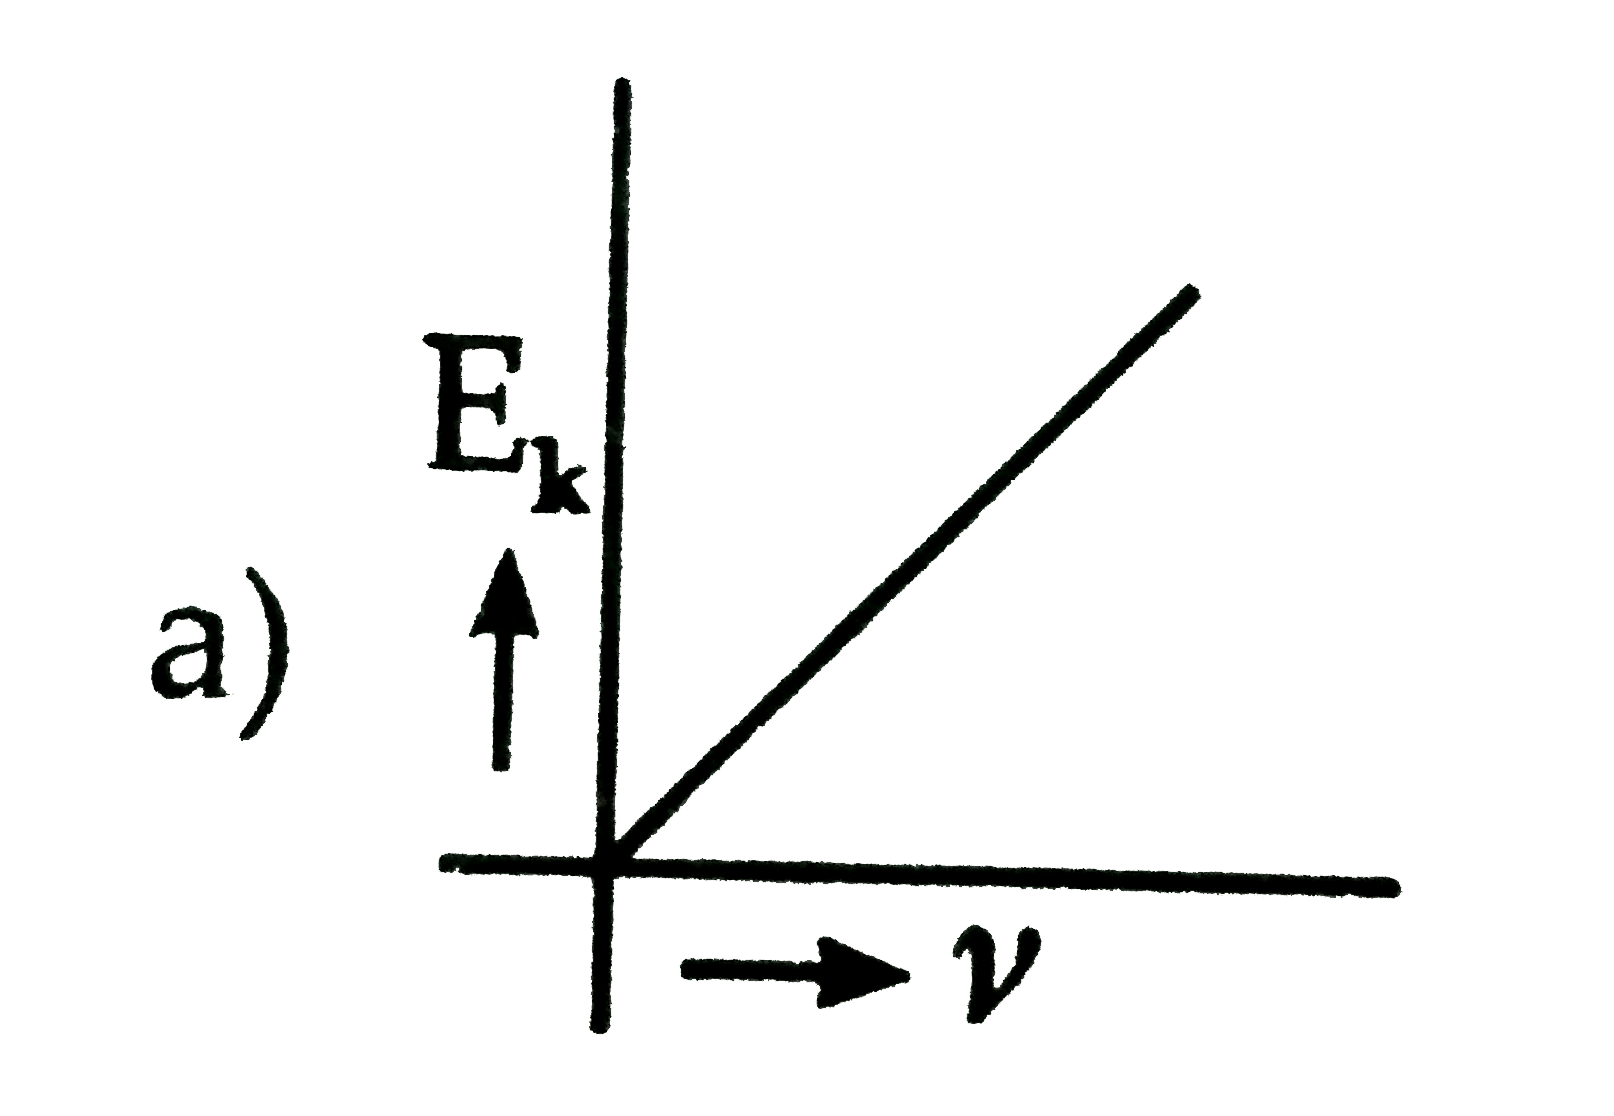 B
B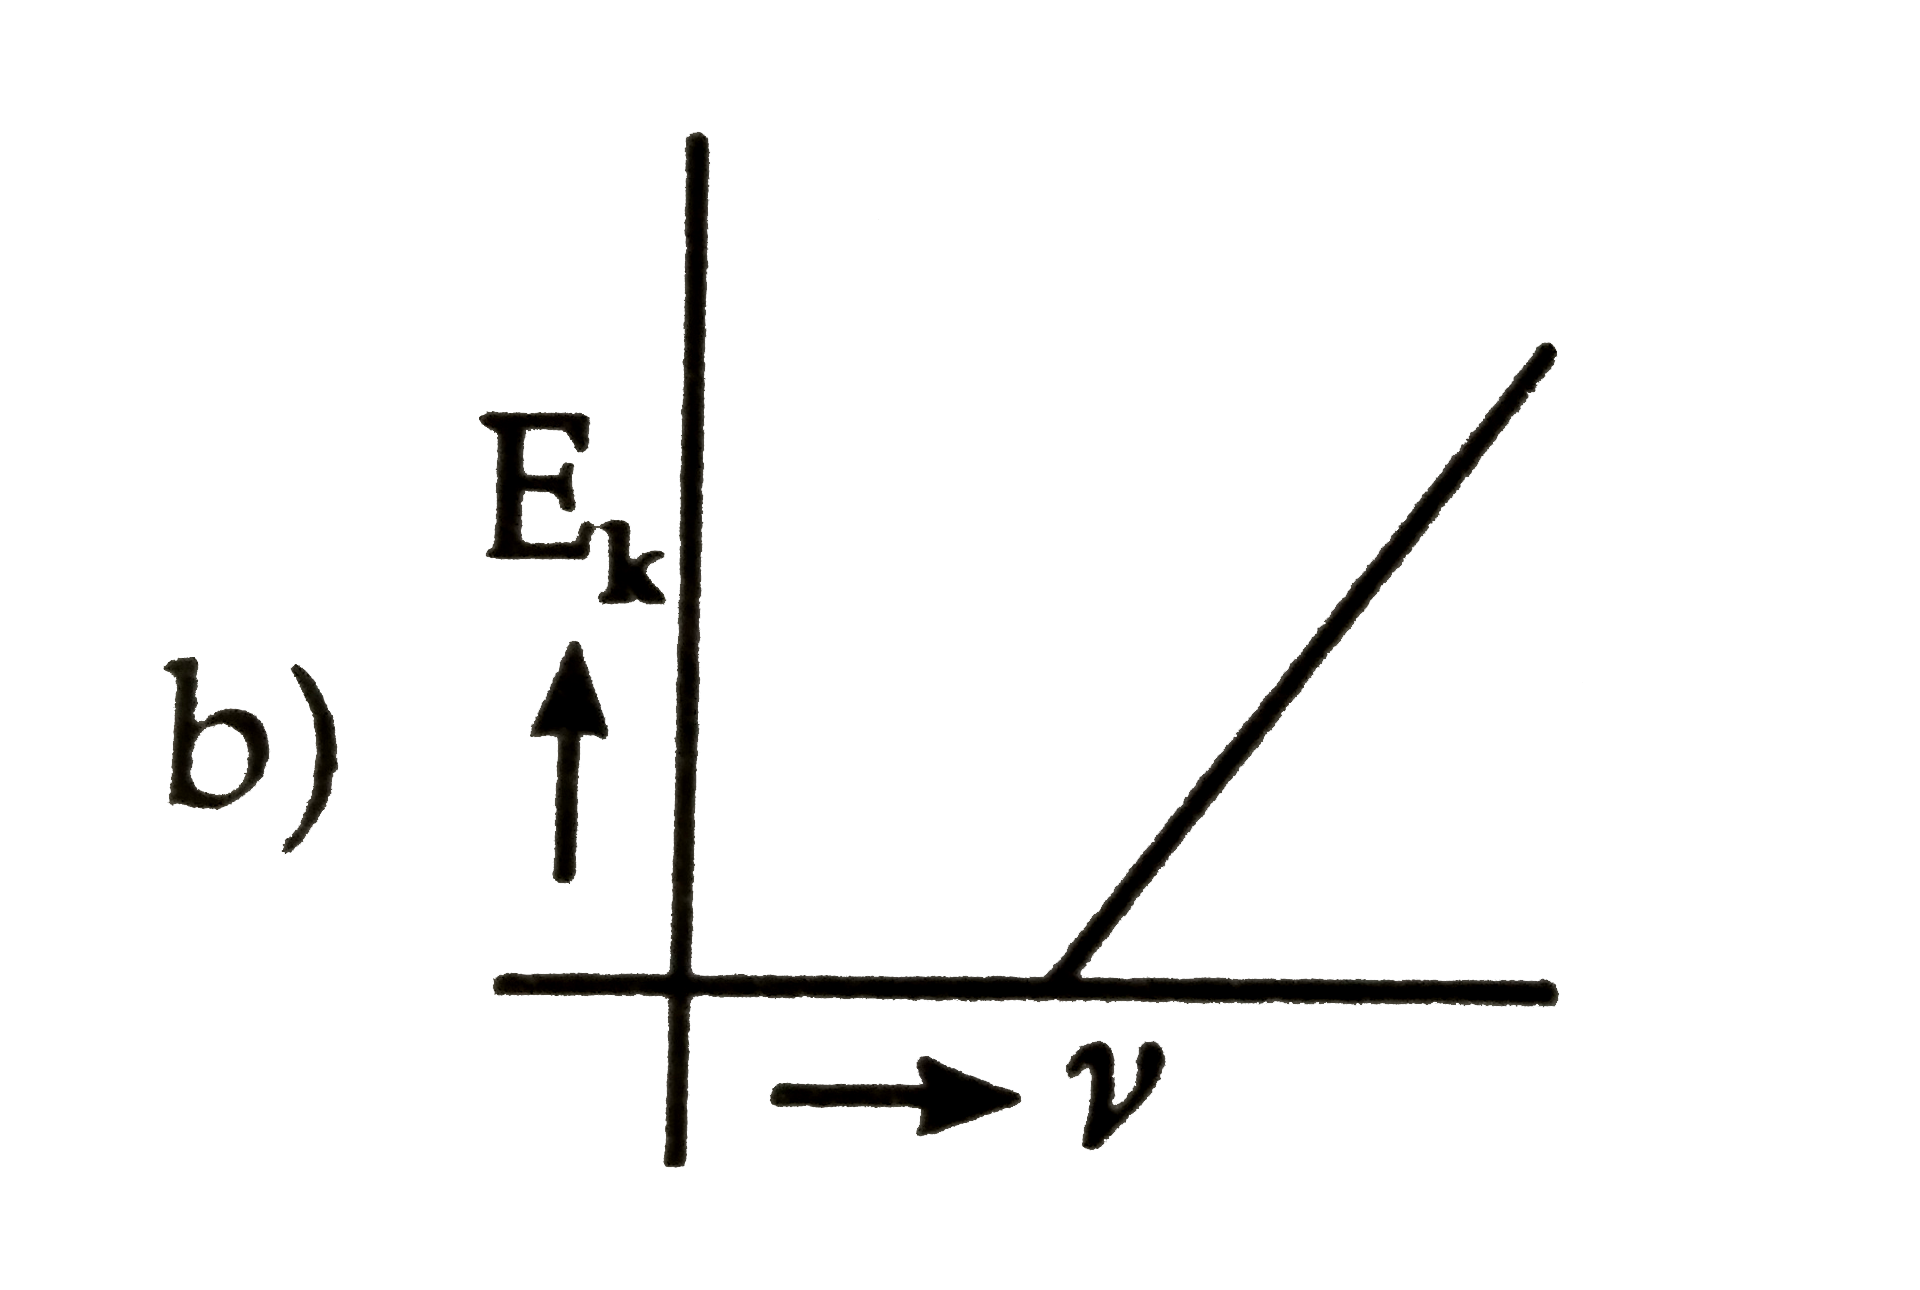 C
C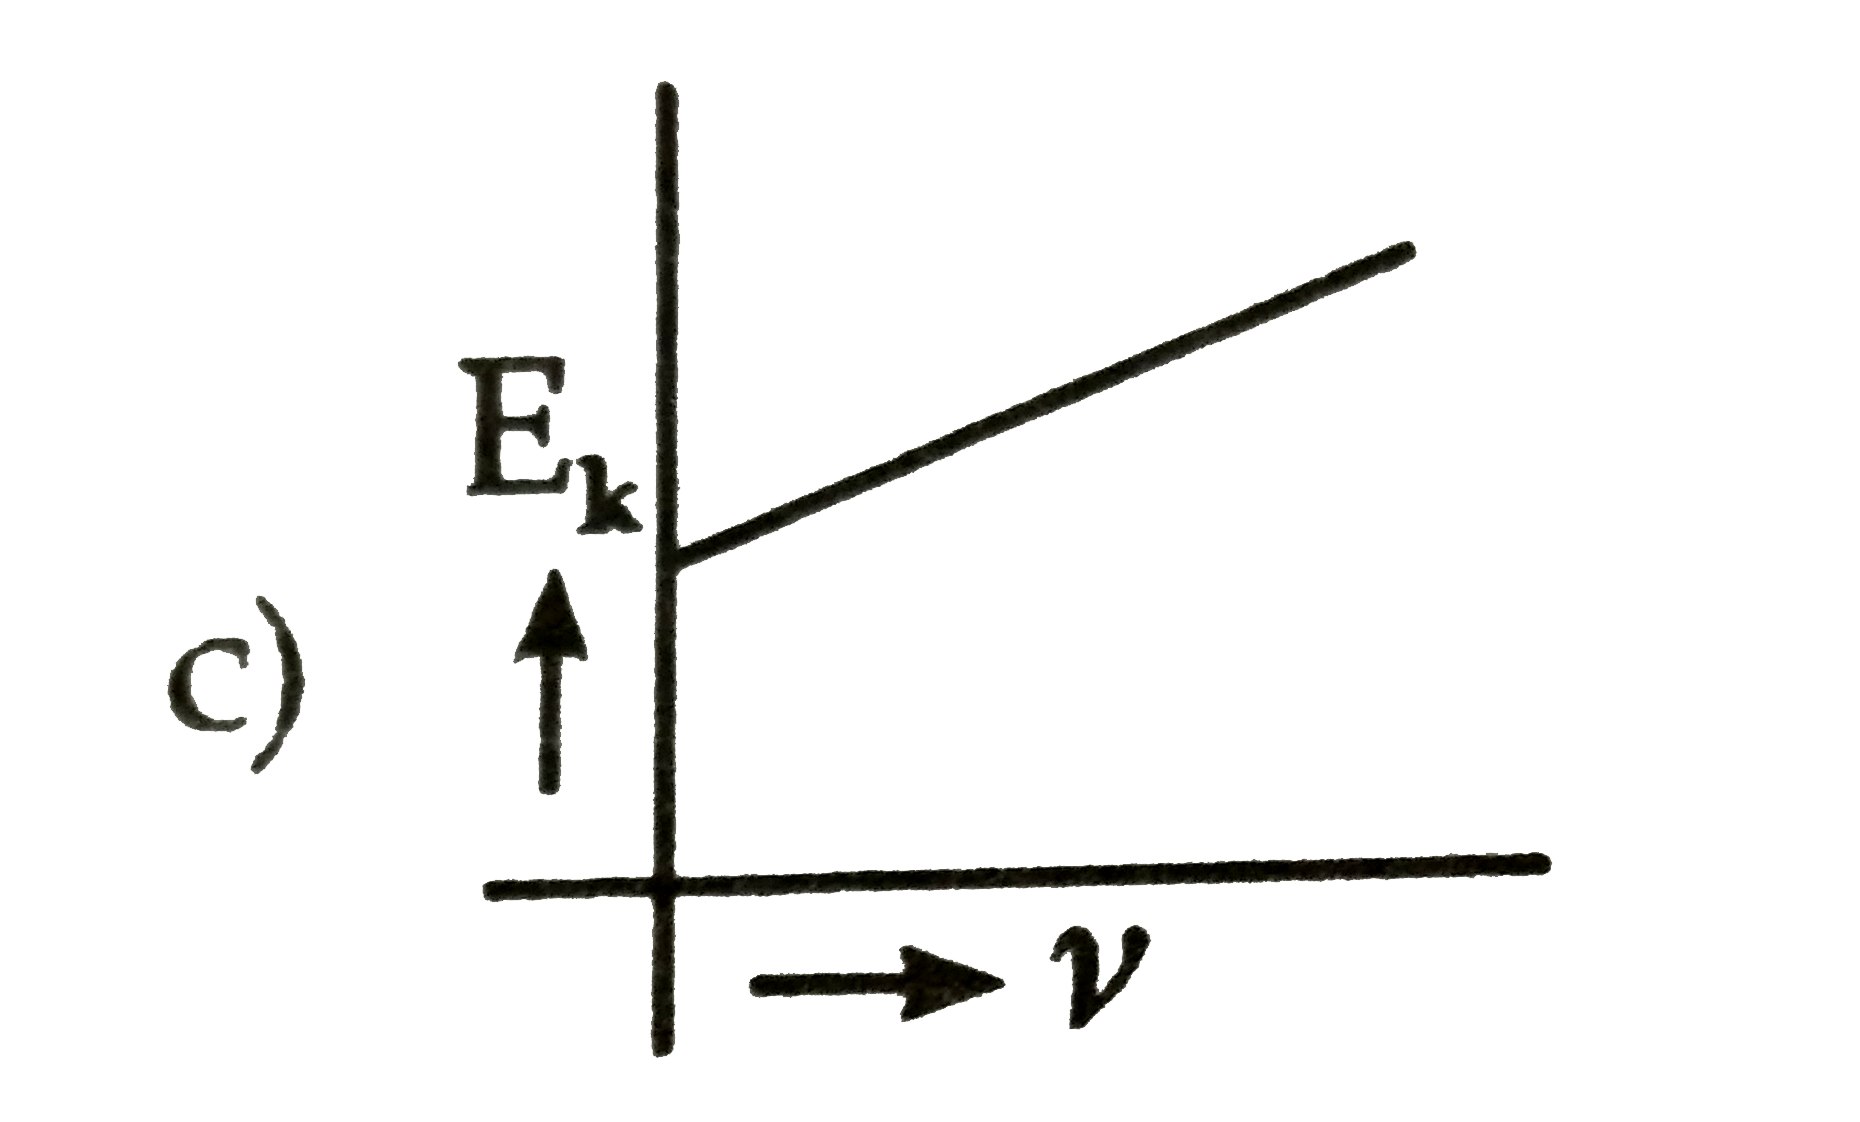 D
D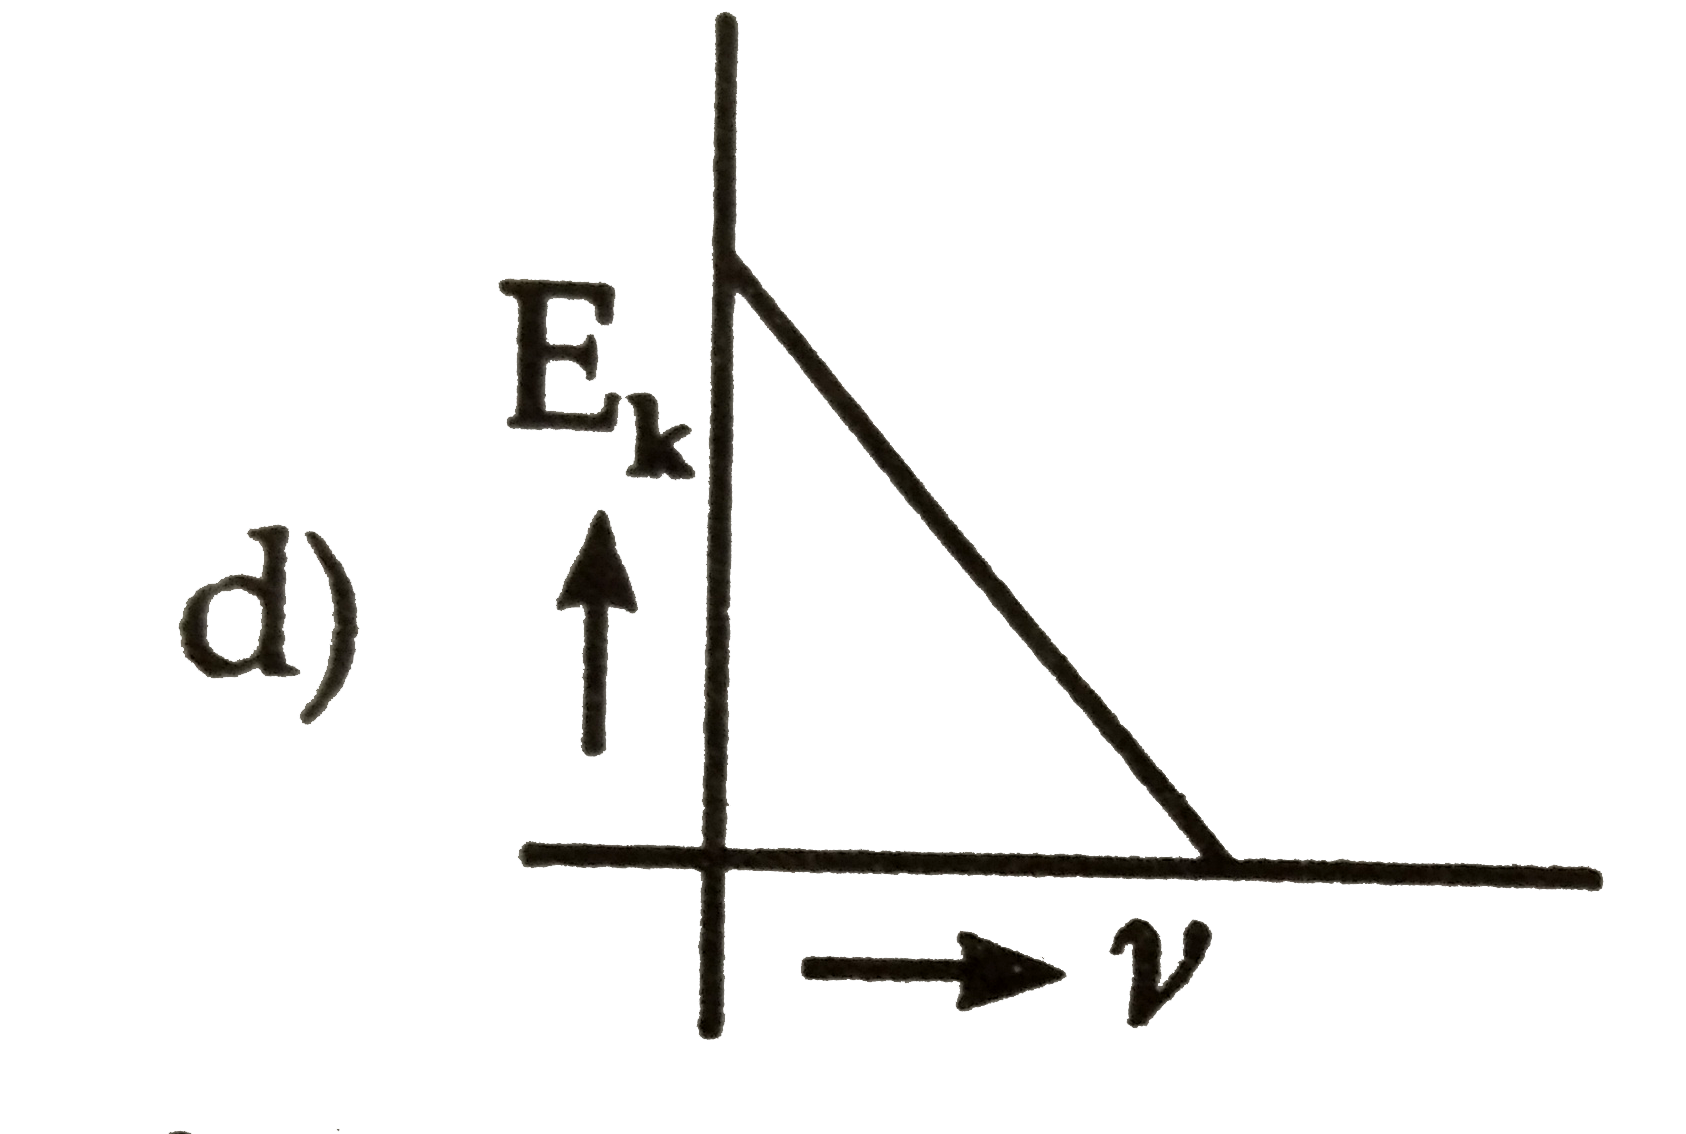
A plot of kinetic energy of the emitted electron against frequency of the incident radiation yields a straight line.t he slope of the straight line is:
A0.66×10−35B0.66×10−33C0.33×10−33D3.33×10−35
Maximum kinetic energy (Ek) of a photoelectron varies with the frequency (v) of the incident radiation as
View SolutionMaximum kinetic energy of the photoelectrons is independent of the intensity of incident radiation .
Give reason.
View SolutionThe maximum kinetic energy of emitted photoelectrons from a surface depends on the ____ of incident radiation as well as the _____of the given surface.
View SolutionThe maximum kinetic energy of photoelectrons is directly proportional to . . . Of the incident radiation. The missing word can be:
View SolutionThe kinetic energy (Ek) of a photoelectron varies with the frequency (v) of the incident radiation as which of the following graph ?
View Solution
