Maximum kinetic energy (Ek) of a photoelectron varies with the frequency (v) of the incident radiation as


The correct Answer is:B
To solve the problem of how the maximum kinetic energy Ek of a photoelectron varies with the frequency ν of the incident radiation, we can use Einstein's photoelectric equation. Here’s a step-by-step solution:
Step 1: Write down Einstein's photoelectric equation
The maximum kinetic energy Ek of a photoelectron is given by the equation:
Ek=hν−ϕ
where:
- Ek is the maximum kinetic energy of the photoelectron,
- h is Planck's constant,
- ν is the frequency of the incident radiation,
- ϕ is the work function of the material.
Step 2: Analyze the equation
From the equation Ek=hν−ϕ, we can see that:
- The term hν represents the energy of the incoming photon.
- The term ϕ represents the minimum energy required to remove an electron from the material (the work function).
Step 3: Rearranging the equation
We can rearrange the equation to express it in a linear form:
Ek=hν−ϕ
This can be compared to the linear equation y=mx+c, where:
- y corresponds to Ek,
- x corresponds to ν,
- m (the slope) corresponds to h,
- c (the y-intercept) corresponds to −ϕ.
Step 4: Interpret the relationship
The relationship shows that the maximum kinetic energy Ek is linearly dependent on the frequency ν. As the frequency increases, the maximum kinetic energy of the emitted photoelectrons also increases linearly, provided that the frequency is above the threshold frequency (where Ek becomes positive).
Step 5: Graphical representation
If we were to plot a graph with frequency ν on the x-axis and maximum kinetic energy Ek on the y-axis, we would get a straight line:
- The slope of the line would be h.
- The x-intercept would be at ν=ϕh, which indicates the threshold frequency below which no photoelectrons are emitted.
Final Relation
Thus, the maximum kinetic energy Ek of a photoelectron varies with the frequency ν of the incident radiation as a linear function, represented by the equation:
Ek=hν−ϕ
The maximum kinetic energy Ek of a photoelectron is given by the equation:
Ek=hν−ϕ
where:
- Ek is the maximum kinetic energy of the photoelectron,
- h is Planck's constant,
- ν is the frequency of the incident radiation,
- ϕ is the work function of the material.
From the equation Ek=hν−ϕ, we can see that:
- The term hν represents the energy of the incoming photon.
- The term ϕ represents the minimum energy required to remove an electron from the material (the work function).
We can rearrange the equation to express it in a linear form:
Ek=hν−ϕ
This can be compared to the linear equation y=mx+c, where:
- y corresponds to Ek,
- x corresponds to ν,
- m (the slope) corresponds to h,
- c (the y-intercept) corresponds to −ϕ.
The relationship shows that the maximum kinetic energy Ek is linearly dependent on the frequency ν. As the frequency increases, the maximum kinetic energy of the emitted photoelectrons also increases linearly, provided that the frequency is above the threshold frequency (where Ek becomes positive).
If we were to plot a graph with frequency ν on the x-axis and maximum kinetic energy Ek on the y-axis, we would get a straight line:
- The slope of the line would be h.
- The x-intercept would be at ν=ϕh, which indicates the threshold frequency below which no photoelectrons are emitted.
Thus, the maximum kinetic energy Ek of a photoelectron varies with the frequency ν of the incident radiation as a linear function, represented by the equation:
Ek=hν−ϕ
Similar Questions
In an experiment of photo-electric effect, the graph of maximum kinetic energy Ek of the emitted photoelectrons versus the frequency v of the incident light is a straight line AB as shown in figure below :
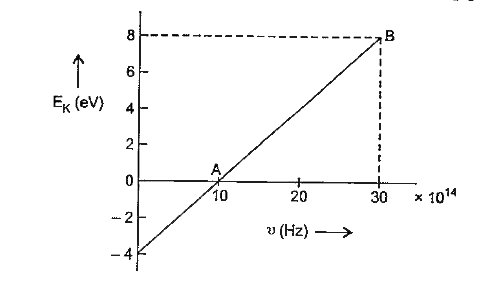
Threshold frequency of the metal.
View SolutionIn an experiment of photo-electric effect, the graph of maximum kinetic energy Ek of the emitted photoelectrons versus the frequency v of the incident light is a straight line AB as shown in figure below :
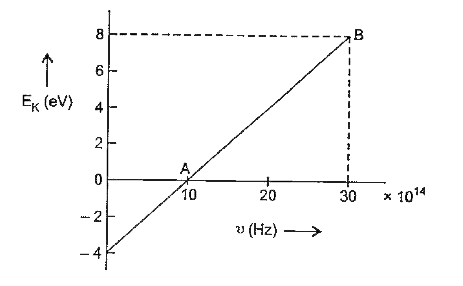
Work function of the metal.
View Solution
Knowledge Check
According to Einstein's photoelectric equation, the plot of the maximum kinetic energy of the emitted photoelectrons from a metal versus frequency of the incident radiation gives a straight line whose slope
Adepends on the intensity of incident radiation.Bdepends on the nature of the metal and also on the intensity of incident radiation.Cis same for all metals and independent of the intensity of the incident radiation.Ddepends on the nature of the metal.
In an experiment of photo-electric effect, the graph of maximum kinetic energy Ek of the emitted photoelectrons versus the frequency v of the incident light is a straight line AB as shown in figure below :
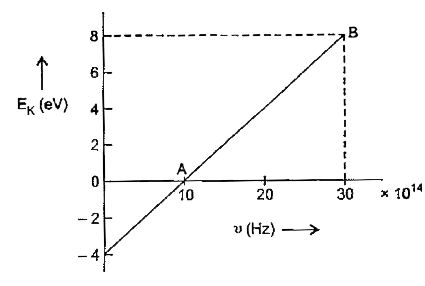
Stopping potential for the photoelectrons emitted by the light of frequency
v=30×1014Hz
View SolutionThe maximum kinetic energy of the photoelectrons veries
View SolutionIn an experiment of photoelectric effect, the graph of maximum kinetic energy EK of the emitted photoelectrons versus the frequency v of the incident light is a straight line AB as shown in Figure below:
Find : (i) Threshold frequency of the metal.
(ii) work function of the metal
(iii) Stopping potential for the photoelectrons emitted by the light of frequency v=30×1014 Hz.
View SolutionThe de Broglie wavelenght (λ) associated with a photoelectron varies with the frequency (v) of the incident radiation as,[v0 is threshold frequency]:
View SolutionThe de Broglie wavelenght (λ) associated with a photoelectron varies with the frequency (v) of the incident radiation as,[v0 is threshold frequency]:
View SolutionFor the photoelectric effect, the maximum kinetic energy Ek of the emitted photoelectrons is plotted against the frequency of the incident photons as shown in the figure. The slope of the curve gives
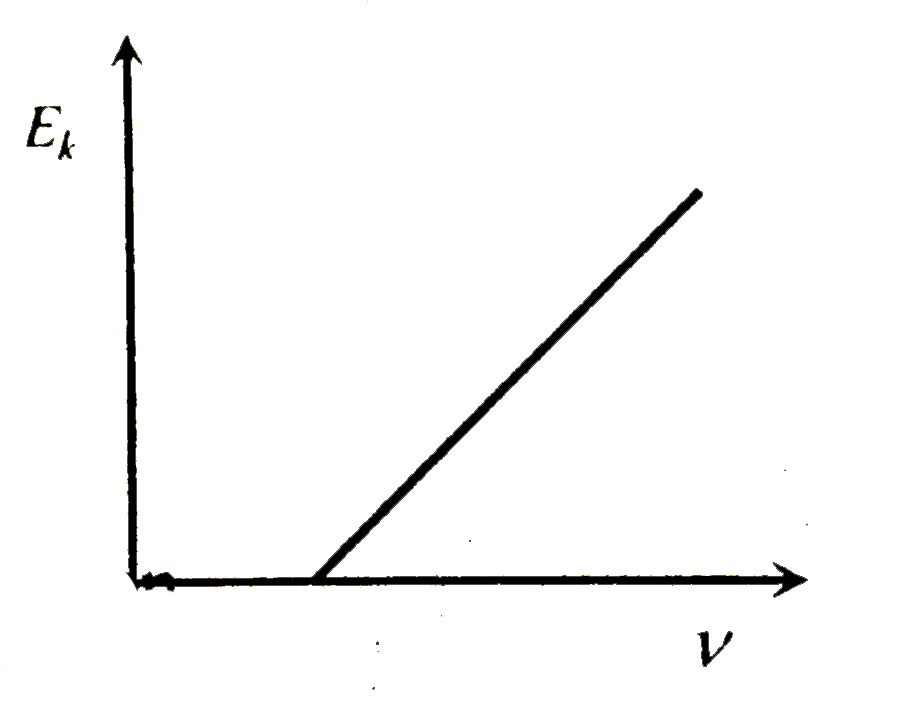
View Solution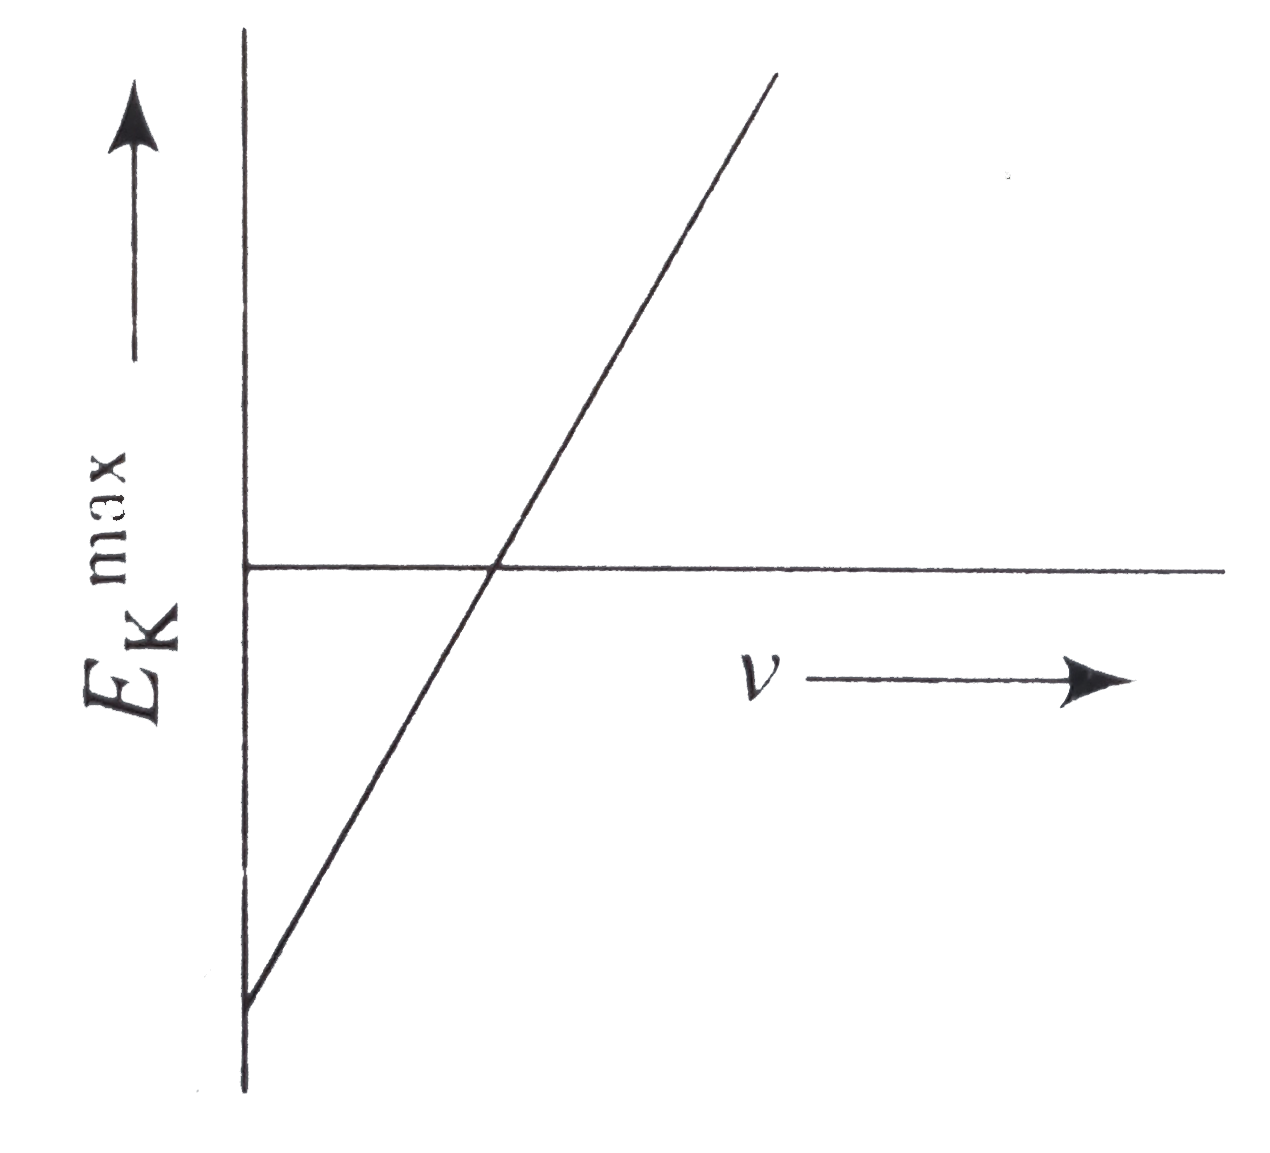
The maximum kinetic energy of the emitted photoelectrons against frequency υ of incident radiation is plotted as shown in Fig. This graph help us in determining the following physical quantities
View Solution
