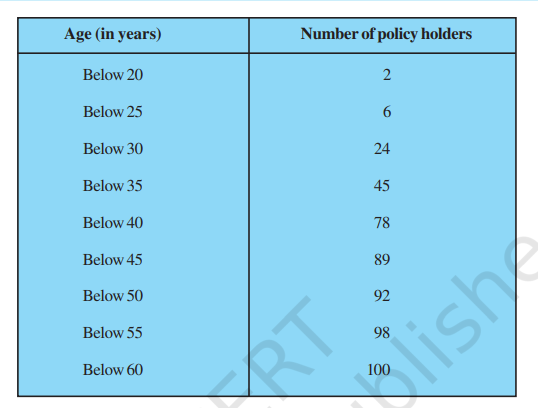
The following is the cumulative frequency distribution (of less than type) of 1000 persons each of age of 20 years and above. Determine the mean age.

The correct Answer is:Mean age is 51.3 years
Topper's Solved these Questions
- MODEL QUESTION PAPER-10 [UNSOLVED]BOOK - VK GLOBAL PUBLICATIONCHAPTER - MODEL QUESTION PAPER-10 [UNSOLVED]EXERCISE - SECTION-C
10 Videos
- MODEL QUESTION PAPER 8 [UNSOLVED]BOOK - VK GLOBAL PUBLICATIONCHAPTER - MODEL QUESTION PAPER 8 [UNSOLVED]EXERCISE - SECTION-D
7 Videos
- MODEL QUESTION PAPER-5 [UNSOLVED]BOOK - VK GLOBAL PUBLICATIONCHAPTER - MODEL QUESTION PAPER-5 [UNSOLVED]EXERCISE - SECTION-D
8 Videos
Similar Questions
Given below is a cumulative frequency distribution table showing the ages of people living in a locality: Age in years No. of persons Above 108 Above 96 Above 84 Above 72 Above 60 Above 48 Above 36 Above 24 Above 12 Above 0 0 1 3 5 20 158 427 809 1026 1024 Prepare a frequency distribution table
View SolutionGiven below is a cumulative frequency distribution table showing the ages of people living in a locality: Age in years No. of persons Above 108 Above 96 Above 84 Above 72 Above 60 Above 48 Above 36 Above 24 Above 12 Above 0 0 1 3 5 20 158 427 809 1026 1024 Prepare a frequency distribution table
View Solution
Knowledge Check
In 'Less than' cumulative frequency distribution the omitted limit is
ALowerBUpperCMiddleDNone of these
The following is the distribution of weights (in kg) of 40 persons.

Construct a cumulative frequency distribution (of the less than type) table for the data above.
View SolutionThe following is the distribution of weights (in kg) of 40 persons.

Construct a cumulative frequency distribution (of the less than type) table for the data above.
View SolutionIn a less than cumulative frequency distribution, frequency and cumulative frequency of a class are 10 and 20 respectively, then the cumulative frequency of the previous class is ______.
View SolutionA life insurance agent found the following data for distribution of ages of 100 policy holders. Calculate the median age, if policies are given only to persons having age 18 years onwards but less than 60 year.

View SolutionThe age distribution of 40 children is as follows:

Consider the following statements in respect of the above frequency distribution:
1. The median of the age distribution is 7 years.
2. 70% of the children are in the age group 6-9 years.
3. The modal age of the children is 8 years.
Which of the above statements are correct?
View SolutionThe age distribution of 40 children is as follows:

Consider the following statements in respect of the above frequency distribution:
1. The median of the age distribution is 7 years.
2. 70% of the children are in the age group 6-9 years.
3. The modal age of the children is 8 years.
Which of the above statements are correct?
View SolutionFor the following frequency distribution, draw a cumulative frequency curve of more than type and hence obtain the median value:

View Solution
